Download presentation
Presentation is loading. Please wait.

2
Energies Renouvelables Renewable Energy G15 – Dakar 6 November 2012 Benoit Lebot UNDP Climate Change Advisor Benoit.lebot@undp.org

3
-1Million BC Cuisson 0.2 koe/d/cap -400 000 BC Feu & Chasse 0.4 koe/d/cap -5 000 BC Agriculture, Elevage 1.2 koe/d/cap 1200 AC Vent, Hydro, Force Animale 2.6 koe/d/cap 1850 AC Révolution Industrielle 5 koe/d/cap 2 000 AC Homme Moderne 20 koe/d/cap

5
Population X 4

6
Population Energie X 4 X 16

7
0 2 000 4 000 6 000 8 000 10 000 12 000 14 000 16 000 18 000 198019902000201020202030 Mtoe Other renewables Hydro Nuclear Biomass Gas Coal Oil World energy demand expands by 45% between now and 2030 – an average rate of increase of 1.6% per year – with coal accounting for more than a third of the overall rise World primary energy demand in the Reference Scenario of the IEA

8
Autres 41 ans Pétrole Réserve Moyen Orient : 63.6% Milliards de TEP Réserves prouvées d’énergie dans le monde Source : AIE/OCDE Charbon Amérique du nord : 25.4% Ex - URSS : 22.5% Chine : 21.8% Autres 218 ans Réserve Conso. annuelle Autres Ex - URSS : 38.7% Moyen Orient : 33.9% 63 ans Gaz Réserve Conso. annuelle 0 100 200 300 400 500 600

9
Les trois générations de consommation du pétrole TVTBMLM Chocs & contre-chocs L’après pic Source: ASPO 2004

10
8

11
Il y a 6 000 ans le Sahara était vert Aujourd’hui c’est un désert

13
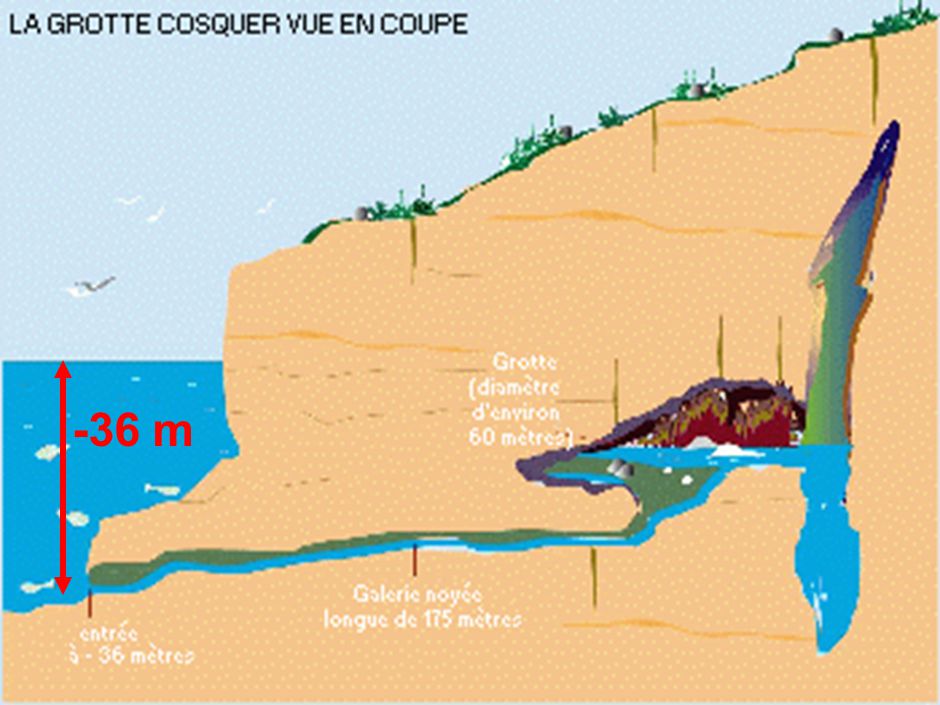
-36 m

14
Mer Méditerranée aujourd’hui Source: GoogleEarth

15
Mer Méditerranée il y a 15 000 année -5 °C par rapport à la température moyenne aujourd’hui Source: France 2 Malaterre

17
15

18
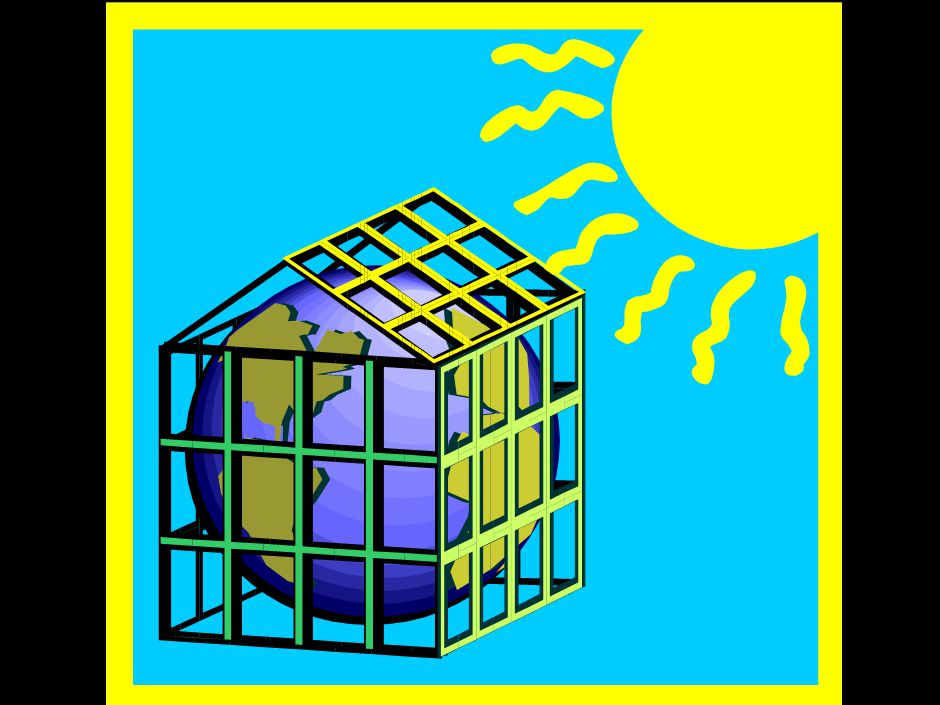
Atmosphère L’effet de serre: un phénomène naturel 1 2 1 3

19
1 Sans atmosphère, la température à la surface du sol serait de -18°C -18°C

20
Atmosphère L’effet de serre: un phénomène naturel 1 2 1 3 Avec atmosphère, la température à la surface du sol est de +15°C +15°C

21
Quels sont les gaz à effet de serre?

22
20 Les 6 Principaux Gaz à Effet de Serre Intégrés au UNFCCC (Convention Cadre des Nations Unies sur le Changement Climatique) Dioxide de Carbone : CO 2 Méthane: CH 4 Protoxyde d’azote : N 2 O Hydrofluorocarbons: HFCs Perfluorocarbons: PFCs Sulphur hexafluoride: SF 6
 Dioxide de Carbone : CO 2 Méthane: CH 4 Protoxyde d’azote : N 2 O Hydrofluorocarbons: HFCs Perfluorocarbons: PFCs Sulphur hexafluoride: SF 6")
24
22

25
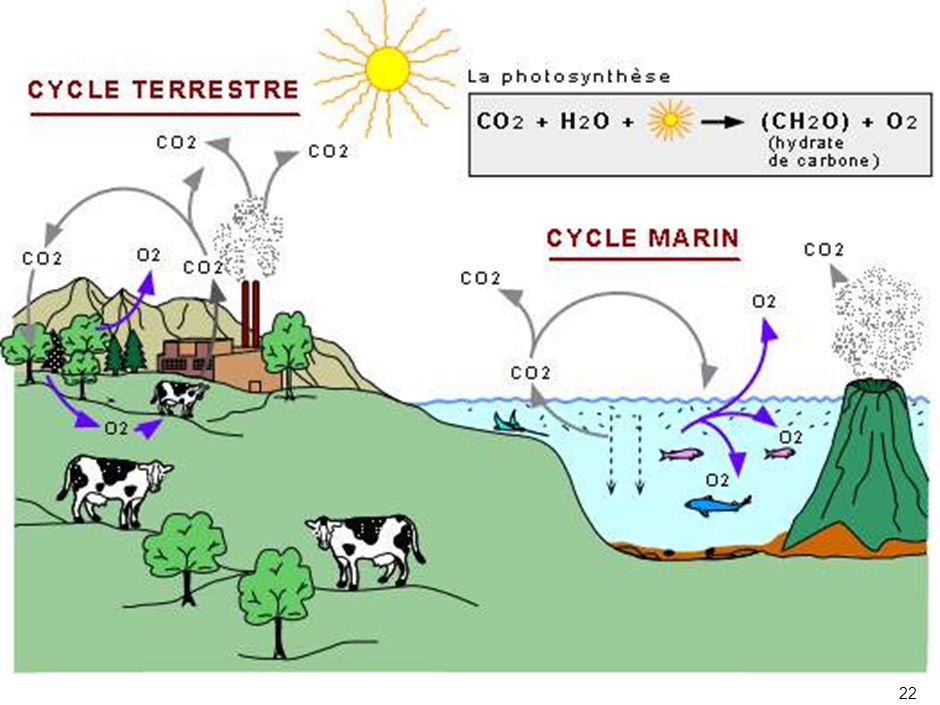
23 Respiration 440 Photosynthesis 440 Respiration 260 Absorbtion 260 Release 70 Absorbtion 80 = 26 Emissions Industrielles Humaines CO2 6 Change Usage des Terres ~15 Accumulation Nette Volcanoes Weathering 0.3 0.7 Terre Océan Increase Uptake by Plants 10 Le Cycle du Carbone : Sources & Puits Dioxide de Carbone Avant l’ère industrielle, les sources de carbone étaient équilibréespar les puits (données en e in Gigatons of CO 2 per year Atmosphere

26
Source: IPCC (2007)
")
27
La couche de Gaz à Effet de Serre s’épaissit L’effet de serre: un phénomène naturel 11 2 1 1 3

28
18% 1% 8% 14% 59% World Green House Gas Emissions CH 4 N2ON2O F Gas CO 2 From Combustion CO 2 From LUCF

29
Source: IPCC AR4, Synthesis Report (shares are for 2004)
")
30
GHG Emissions GHG Concentration GHG Sinks (Sequestration) 2012 394 ppm http://co2now.org/ 450 ppm ~+2°C 32 Gtons CO 2 /year 15 Gtons CO 2 /year
 ppm ppm ~+2°C 32 Gtons CO 2 /year 15 Gtons CO 2 /year")
31
29 Source l’Union of Concerned Scientists (1) http://www.ucsusa.org/global_warming/science/recordtemp2005.htmlhttp://www.ucsusa.org/global_warming/science/recordtemp2005.html 1 2010 11 2001 2200512 2008 21998131997 42009141990 52002151995 62003162000 72007171991 82004181987 92011191988 102006201994 Classement des 20 années les plus chaudes depuis 1880, par ordre décroissant de température
 Classement des 20 années les plus chaudes depuis 1880, par ordre décroissant de température")
32
Evolution du Niveau des Océans 1990s: fastest recorded rise at 4mm per year Longer term: ≥ 1m per century very plausible Source: IPCC (2007)
")
33
31 Projection des Evolutions des concentration CO2 1800 20002100 CO 2 (in ppm) 280 367 970 540
")
34
32 Evolution possible de la température moyenne sur terre 2000 2100 +5°C +2°C ?

35
Mer Méditerranée il y a 15 000 année -5 °C par rapport à la température moyenne aujourd’hui Source: France 2 Malaterre

36
2007 2050 Today World Average South 4.2 tCO 2eq /Cap North 16.1 tCO 2eq /Cap 2050 Target 50% Global Emissions CO 2 /Cap/year UNDP HDR Objective for 2050: In the north, - 80% in emissions In the south, - 20% in emissions 2020 Pathway towards a 2°C Global Warming

37
Prof. Kaya (World Summit 1992) GHG = GHG TOE X GDP X POP X Greenhouse Gas Emission = Carbon Contain Energy x Intensity x Wealth x Population
 GHG = GHG TOE X GDP X POP X Greenhouse Gas Emission = Carbon Contain Energy x Intensity x Wealth x Population.")
38
Prof. Kaya (World Summit 1992) GHG = GHG TOE X GDP X POP X ½ In 2050 = ? x ? x 3 x 3/2
 GHG = GHG TOE X GDP X POP X ½ In 2050 = x x 3 x 3/2")
39
Prof. Kaya (World Summit 1992) GHG = GHG TOE X GDP X POP X 1/2 = x 1/31/6 x by 2050 3 %/year 4 %/year 3 x 3/2
 GHG = GHG TOE X GDP X POP X 1/2 = x 1/31/6 x by %/year 4 %/year 3 x 3/2.")
40
Prof. Kaya (World Summit 1992) GHG = GHG TOE X GDP X POP X 1/2 = x 1/61/3 x by 2050 4 %/year 3 %/year 3 x 3/2
 GHG = GHG TOE X GDP X POP X 1/2 = x 1/61/3 x by %/year 3 %/year 3 x 3/2.")
41
A pressing need for global GHG mitigation

42
Energie Durable pour Tous www.sustainableenergyforall.org

43
© The Energy Resource Institute Sustainable Energy for All Energie Durable pour Tous L’énergie transforme nos vies, nos économies & notre planète. www.sustainableenergyforall.org

44
Energie Durable pour Tous www.sustainableenergyforall.org D’ici à 2030, 3 objectifs 1.Accès à l’énergie moderne pour tous 2.Doubler l’efficacité énergétique 3.Doubler la part des énergies renouvelables

45
43 Renewable Energy in the World RE supplied an estimated 17% of global final energy consumption

46
Top RE Countries in 2012 Germany continues to lead in Europe and to be in the forefront globally, remaining among the top users of many renewable technologies for power, heating, and transport. China ended 2011 with more renewable power capacity than any other country, with an estimated 282 GW; one-quarter of this total (70 GW) was non-hydro.
 was non-hydro..")
47
45

48
46 Renewables accounted for nearly half of the estimated 208 GW of new electric capacity installed in 2011 Renewable electric power capacity worldwide reached 1,360 GW (+8%) in 2011 Renewable energy comprised more than 25% of global power generation capacity 20.3% of global electricity was produced from renewable energy Global Market Overview – Power Markets
 in 2011 Renewable energy comprised more than 25% of global power generation capacity 20.3% of global electricity was produced from renewable energy Global Market Overview – Power Markets")
49
47 RE used in form of electricity, hydrogen, biogas, liquid biofuels. Liquid biofuels provided 3% of global road transport fuel in 2011. Electric transport is being tied directly with renewable energy through policy directives in many countries. Johannesburg, South Africa introduced 25 ethanol buses into its public transportation fleet during 2011 Global Market Overview - Transport

50
48

51
49 25GW of new hydropower was added in 2011, increasing capacity by nearly 3%, bringing installed capacity to 970GW Globally hydropower generated 3,400TW h of electricity in 2011. China alone produced 663TWh followed by Brazil (450TWh) In late 2011, Burundi, Rwanda, and Tanzania announced plans to build a 90MW hydropower plant, with financing expected from the World Bank and AfDB South Africa is expected to have 1332MW of pumped storage facility by 2013-2014 Hydropower
 In late 2011, Burundi, Rwanda, and Tanzania announced plans to build a 90MW hydropower plant, with financing expected from the World Bank and AfDB South Africa is expected to have 1332MW of pumped storage facility by Hydropower.")
52
50 Solar Power

53
51 Solar Power 30GW of new solar PV capacity came into being in 2011 460 MW of Concentrating Solar Power installed in 2011 bringing the total installed capacity to 1.760 MW

54
52

55
53 Wind Power In 2011, 40GW of wind power capacity was installed, increasing the total to 238GW. Annual growth rate of cumulative wind power capacity between 2006-2010 averaged at 26% Wind power accounted for 30% of the total new renewable energy capacity

56
54 Wind Power

57
55

58
Biomass Energy Biomass energy accounted for over 10% of global primary energy supply in 2011 The present global demand for biomass is 53EJ, mainly used for heating, cooking and industrial applications Liquid biofuels production grew rapidly at 17% for ethanol and 27% for biodiesel Most sugar producing countries in Africa generate power and heat with bagasse-based combined heat and power plants. Grid connected CHP exists in Kenya, Mauritius, Tanzania, Uganda and Zimbabwe

59
57 Geothermal Energy

60
58 Geothermal Energy 205 TW h (738PJ) of district heat and electricity was provided by geothermal resources in 2011 Heat output from geothermal sources grew at 100% p.a. from 2005-2010; reaching 489PJ in 2011 Geothermal power became more attractive due to flexibility offered by new technologies such as flash plants combined with binary bottoming cycles for increased efficiency Geothermal Power has taken hold in East Africa’s Rift Valley. Drought in the region has increased interest on geothermal to reduce reliability on hydropower

61
59 Industry Trends

62
60 Industry Trends

63
61 Industry Trends RE industry saw continued growth in manufacturing, sales and installation Cost reductions (especially in PV and onshore wind) contributed to growth Changing policy landscape in many countries industry uncertainties, declining policy support, international financial crisis and barriers to trade Worldwide jobs in renewable energy industries exceeded 5 million in 2011; clustered primarily in bioenergy and solar industries Green power markets are emerging in South Africa, with at least one company providing green power to retail customers in South Africa
 contributed to growth Changing policy landscape in many countries industry uncertainties, declining policy support, international financial crisis and barriers to trade Worldwide jobs in renewable energy industries exceeded 5 million in 2011; clustered primarily in bioenergy and solar industries Green power markets are emerging in South Africa, with at least one company providing green power to retail customers in South Africa")
64
62 Investment Flows

65
63 Investment Flows Total global investment in RE jumped in 2011to a record of $257 billion, up 17% from 2010 (15 % for Asia Oceania region). This is 6 times the level of investment in 2004 and 94% more than the total investment in RE in 2007. Despite the rise in investment, the rate of growth of investment was below the 37% rise in investment from 2009 to 2010. Total investment in the RE sector in the Middle East and Africa combined was USD 4.9 Billion.

66
Investment Flows The top 5 countries for total investment in 2011: China, USA, Germany, Italy and India. RE Investment in China went up by 17% in 2011 Investment in RE in USA made a significant leap of 57% in 2011. Investment in Germany (excluding R&D) dipped 12% from the 2010 levels Investment in RE in India went up by 62% in 2011 relative share of total global investment of developing countries slip back : USD 89 billion of new investment in 2011 in developing countries USD 168 billion in developed countries
 dipped 12% from the 2010 levels Investment in RE in India went up by 62% in 2011 relative share of total global investment of developing countries slip back : USD 89 billion of new investment in 2011 in developing countries USD 168 billion in developed countries.")
67
65 Policy Landscape

68
66 Policy Landscape Targets in at least 118 countries up from the 96 reported in previous year; more than half are developing countries Some setbacks resulting from a lack of long- term policy certainty and stability in many countries South Africa introduced a new 20 year plan calling for renewables to account for 42% of all new capacity installed up to 2030

69
67 Policy Landscape Renewable power generation policies remain the most common type of support policy, in particular Feed-in- tariffs (FIT) and renewable portfolio standards (RPS) FIT policies were in place in at least 65 countries and 27 states worldwide by early 2012. Policies to promote renewable heating and cooling expanded. Almost two-thirds of the world’s largest cities had adopted climate change action plans by the end of 2011, with more than half of them planning to increase their uptake of renewable energy.

70
68

71
69 2.6 billion people still employed traditional cookstoves and open fires for heating and cooking in 2011 UN Secretary General’s goal: Global action to achieve universal access to modern energy services by 2030 In order to achieve universal access for all, current global investments on energy access of annual 9 billion USD need to be increased to 48 billion USD Lower prices of renewable energy technology is allowing manufacturers to diversify into emerging markets Large numbers of actors and programmes, with limited coordination, makes impact assessment and data collection a big challenge Energy Access

72
Electricity Access by Region

73
71 Rural Renewable Energy in Africa Africa : lowest rates of access to modern energy services More than 650 million people rely on using traditional biomass for cooking Ghana is the frontrunner with an electrification rate of 72% and aims for universal energy access by 2020 Most renewable energy projects being implemented in Africa are off-grid (though grid connected renewable energy necessary to attract investment) 550,000 improved cookstoves have been disseminated in Benin, Burkina Faso, Burundi, Ethiopia, Kenya, Senegal and Uganda since 2009
 550,000 improved cookstoves have been disseminated in Benin, Burkina Faso, Burundi, Ethiopia, Kenya, Senegal and Uganda since 2009")
74
72 Enabling Framework Right policy framework Increased productivity & growth Creation of jobs Improved public health Enhanced energy security, more stable climate

75
Kombikraftwerk: almost 100 % verified in real time on one year Possible potential to add: DSM (kW and kWh), Hydro, offshore wind, solid biomass, geothermal power, ocean energy
, Hydro, offshore wind, solid biomass, geothermal power, ocean energy")
76
74

77
Figure 1: Traditional Electric Landscape (XX Century) Large Power Plants Transmission Grid Distribution Grid Passive & captive consumers Limited Exchanges Central Dispatching
 Large Power Plants Transmission Grid Distribution Grid Passive & captive consumers Limited Exchanges Central Dispatching")
78
Regulatory Framework Figure 2: New & Desirable Electrical Landscape (XXI Century) Large Power Plants Transmission & Balancing Grid Harvesting, Mutualisation &Distributing Grid Eco-Consumers (Energy Efficient end- use) Expanded Exchanges Central Dispatching + Forecasting, control-command & distributed intelligence, RESe production supervision Local clusters Coupling Offer & Demand: « Virtual Grids » RE IPPs
 Large Power Plants Transmission & Balancing Grid Harvesting, Mutualisation &Distributing Grid Eco-Consumers (Energy Efficient end- use) Expanded Exchanges Central Dispatching + Forecasting, control-command & distributed intelligence, RESe production supervision Local clusters Coupling Offer & Demand: « Virtual Grids » RE IPPs")
79
77

80
78 Merci pour votre attention! Benoit.lebot@undp.org

Similar presentations


: Diversifying the U.S. Electricity Portfolio Marc Santos 2008 ASME WISE Intern University of Massachusetts.>")


