Download presentation
Presentation is loading. Please wait.

1
Geography 463 May 14, 2004 Project Evaluation

2
Final Report 1. Introduction 2. Needs Assessment (or Background or Problem Statement) 3. System Requirements 4. Data Acquisition 5. Data Analysis 6. Results 7. Project Evaluation 8. Summary, Conclusions, and Recommendations 9. Technical Appendices

3
Results Section Should cover implications of your data analysis or development effort What did your analysis reveal? Did the analysis result in unexpected findings? Should include the maps, charts, diagrams you created What do they portray? Should include tools, website, guides/curricula etc. that you created What is the tools purpose? How does it work? How should it be used?

4
Evaluating GIS Projects Analytical evaluation –Sensitivity Analysis – logically consistent, blunder-free –Empirical Comparison – data vs. analysis, “ground truth” –Practical Comparison – vs. similar method/research –Cost-Benefit Analysis Analytical evaluation often inadequate –A perfect data fit does not ensure good decision support –Costs and benefits can’t always be expressed in $ Uncertainty is not just an analytical issue –Also social and ethical uncertainties Solution is to have clients/stakeholders participate

5
Type of Benefits for GIS From Antenucci et al. GIS: Guide to the Technology (1991) Type 1: Quantifiable efficiencies in current practice, or improvements to existing practices such as cost reduction of labor, Type 2: Quantifiable expanded or added capabilities to be more effective Type 3: Quantifiable, unpredictable events that can take advantage of geographic information Type 4: Intangible benefits related to intangible advantages Type 5: Quantifiable sale of information
 Type 1: Quantifiable efficiencies in current practice, or improvements to existing practices such as cost reduction of labor, Type 2: Quantifiable expanded or added capabilities to be more effective Type 3: Quantifiable, unpredictable events that can take advantage of geographic information Type 4: Intangible benefits related to intangible advantages Type 5: Quantifiable sale of information.")
6
Type of Costs for GIS Capital costs (durable good with extended life over several years): 1) data base 2) hardware and software 3) implementation Operating costs: 1) personnel 2) overhead 3) maintenance fees 4) utilities 5) supplies 6) other Hidden costs: time and resources that aren’t $
: 1) data base 2) hardware and software 3) implementation Operating costs: 1) personnel 2) overhead 3) maintenance fees 4) utilities 5) supplies 6) other Hidden costs: time and resources that aren’t $")
7
Why Have Clients/Stakeholders Participate? (Fischer,2000) Avoids/minimizes politics of expertise Shows concern for clients/stakeholders needs over professional success Gets clients/stakeholders to talk about issues that effect them Can increase legitimacy and trust of what your work Shifts focus from analytic proof to social inquiry Promotes a living process and product Inspires further work and inquiry
 Avoids/minimizes politics of expertise Shows concern for clients/stakeholders needs over professional success Gets clients/stakeholders to talk about issues that effect them Can increase legitimacy and trust of what your work Shifts focus from analytic proof to social inquiry Promotes a living process and product Inspires further work and inquiry.")
8
Elements of Participatory Model Assessment Software usability testing Focus group research Socio-behavioral experimental design –Field (case) study –Laboratory experiment –Field experiment –Exploratory study Qualitative and quantitative data collection Role play / Decision simulation Consensus building / Joint fact-finding
 study –Laboratory experiment –Field experiment –Exploratory study Qualitative and quantitative data collection Role play / Decision simulation Consensus building / Joint fact-finding")
9
Case Studies of PMA First two formal participatory assessments of sustainability models 1.Comprehensive Areal Model of Earthquake- induced Landslides (CAMEL) –Field/lab experiment for detailed design assessment, decision support assessment, and stakeholder involvement 2.Prototype model of community recovery from disasters –Exploratory study for needs assessment and stakeholder involvement
 –Field/lab experiment for detailed design assessment, decision support assessment, and stakeholder involvement 2.Prototype model of community recovery from disasters –Exploratory study for needs assessment and stakeholder involvement")
10
Case Study 1 Comprehensive Areal Model of Earthquake-induced Landslides

11
CAMEL Objectives For integration with community loss and recovery modeling; design to –Consider the impacts of all landslide types –Characterize, propagate, and convey uncertainties –Predict spatial and temporal probabilities –Open and transparent –Able to incorporate quantitative and qualitative knowledge –Operable with missing data For aiding collaborative decisions sustainability vulnerability

12
CAMEL Framework

13
Predicted Concentration (ls/km 2 ) Number of Loma Prieta Landslides Area of Predicted Range (km 2 ) Actual Landslide Concentration (ls/km 2 ) None2632.460.80 0.1 - 0.562424.350.99 0.56 - 3.214170.092.01 3.2 - 17.81006.3615.73 Analytical Evaluation Disrupted soil slides, falls, avalanches CAMEL vs. Loma Prieta landslides 1989, M = 6.9 Laurel 7.5’ quadrangle Inventory of Keefer (1998) USGS ShakeMap data 10-meter USGS DEM USGS DLG roads/streams Geology of McLaughlin et al. (1999) Ranked w/ Keefer (2000) Dry conditions
 USGS ShakeMap data 10-meter USGS DEM USGS DLG roads/streams Geology of McLaughlin et al. (1999) Ranked w/ Keefer (2000) Dry conditions.")
14
Participatory Model Assessment Design 4 assessment workshops 45 total participants 20 USGS scientists 25 disaster mitigation professionals Workshop-1 : USGS earth scientists assessing Newmark’s then CAMEL (Order 1). Workshop-2 : USGS earth scientists assessing CAMEL then Newmark’s (Order 2). Workshop-3 : Earthquake mitigation professionals assessing models by Order 1. Workshop-4 : Earthquake mitigation professionals assessing models by Order 2. Fictional hospital site selection using CAMEL and Newmark Controlled for order of models Quantitative and qualitative data collection
. Workshop-3 : Earthquake mitigation professionals assessing models by Order 1. Workshop-4 : Earthquake mitigation professionals assessing models by Order 2. Fictional hospital site selection using CAMEL and Newmark Controlled for order of models Quantitative and qualitative data collection.")
15
1.Questionnaire 1 2.Background presentation 3.Role-play scenario 4.Presentation of model 1 5.Task demonstration 6.Siting task with model 1 7.Questionnaire 2 8.Presentation of model 2 9.Siting task with model 2 10.Questionnaire 3 11.Group discussion Workshop Format “Bay City, CA”

16
Hypothesis 1 - Model Assessment : Participants’ perceptions of CAMEL and the Newmark model of Jibson et al. (1998) are not significantly different with respect to each model’s: H1a. Completeness H1b. Information Content H1c. Transparency Hypothesis 2 – Hazard/Risk Perception : Participants’ perceptions of the hazard and risk conveyed by CAMEL and the Newmark model of Jibson et al. (1998) are not significantly different. Participatory Assessment Hypotheses
 are not significantly different with respect to each model’s: H1a. Completeness H1b. Information Content H1c. Transparency Hypothesis 2 – Hazard/Risk Perception : Participants’ perceptions of the hazard and risk conveyed by CAMEL and the Newmark model of Jibson et al. (1998) are not significantly different. Participatory Assessment Hypotheses.")
17
Hypothesis 3 – Decision Process : Participants’ perceptions of the decision process when appropriating CAMEL and the Newmark model of Jibson et al. (1998) are not significantly different with respect to: H3a. Individual Enjoyment H3b. Meeting/Task Efficiency H3c. Group Collaboration Hypothesis 4 – Decision Process Outcomes : Participants’ perceptions of decision process outcomes when appropriating CAMEL and the Newmark model of Jibson et al. (1998) are not significantly different. Hypothesis 5 – Participant’s Ability : Assessments will be significantly different between the USGS (experts) and ABAG (users) workshops, with respect to other hypotheses Participatory Assessment Hypotheses
 are not significantly different with respect to: H3a. Individual Enjoyment H3b. Meeting/Task Efficiency H3c. Group Collaboration Hypothesis 4 – Decision Process Outcomes : Participants’ perceptions of decision process outcomes when appropriating CAMEL and the Newmark model of Jibson et al. (1998) are not significantly different. Hypothesis 5 – Participant’s Ability : Assessments will be significantly different between the USGS (experts) and ABAG (users) workshops, with respect to other hypotheses Participatory Assessment Hypotheses.")
18
Assessment Findings

19
Assessment Findings Cont. significant, CAMEL significant, Newmark

20
Case Study 2 A Prototype Model of Community Recovery from Disasters

21
To develop an interactive simulation model of how cities recover from disasters 1.Extend disaster loss estimation Go beyond physical damage and immediate economic effects Emphasize recovery time, social and economic impact, broader range of interventions 2.Provide decision support tool(s) to explore how engineering & policy measures effect community resilience Especially social and economic dimensions Model Design Objectives
 to explore how engineering & policy measures effect community resilience Especially social and economic dimensions Model Design Objectives")
22
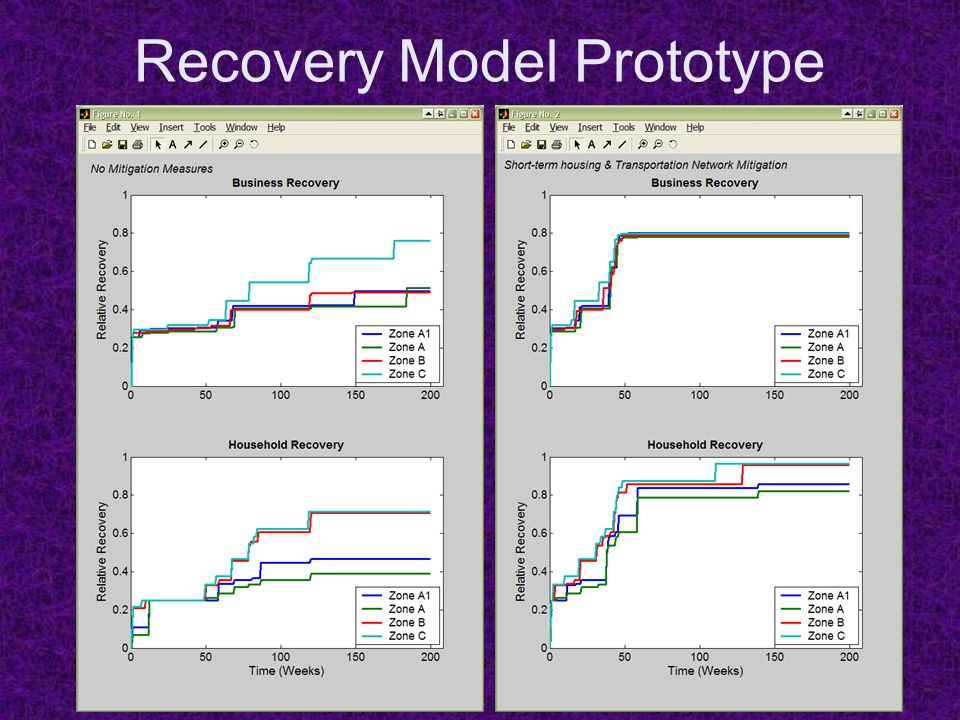
Recovery Model Prototype

24
Analytical Evaluation Sensitivity analysis of prototype Empirical comparison not appropriate

25
Participatory Assessment Workshop Format 9 disaster professionals –UW, local, state & federal 1.Group discussion on community loss and recovery 2.Presentation on research perspectives on urban disaster recovery 3.Presentation on prototype model and software demonstration 4.Facilitated group interaction with prototype Two groups around collaboratory workstations 5.Questionnaire on prototype model and software 6.Group discussion on recovery model and software

26
Assessment Findings Participants’ perceptions regarding potential uses of recovery model/software Participants’ perceptions regarding the means of delivering the recovery model

27
Assessment Findings Cont. Likert questions about what policies, mitigation measures, and indicators are important resulted in little distinction The most valuable data collected was participant comments before, during, and after interacting with the prototype Participants were enthusiastic regarding further development and use within their practices

28
After Evaluating the Project Draw conclusions –About significance of what you found –About the effectiveness of your methods –About whether needs were met –About whether research question was answered Provide recommendations –For improving the completed work –For additional work

Similar presentations


 May.>")


