Download presentation
Presentation is loading. Please wait.

1
SIP Quarterly Review: Number 1 Nellie Stone Johnson Community School Big Picture October 31, 2013

2
Nellie Stone Johnson SIP QR#1 Agenda TopicEstimated SlidesEstimated time Mission Vision1 Goal1 Purpose1 Overview of Instructional Leadership Team 15 min. Description of School priorities (include data) 1-215 min. Description of School Improvement strategies 2-35 min. Next Steps1-210 min. Q & A/discussion030 min 1) SuggestionsTake notes15 min. 2) Next StepsTake notes15 min.
 min. Description of School Improvement strategies 2-35 min. Next Steps1-210 min. Q & A/discussion030 min 1) SuggestionsTake notes15 min. 2) Next StepsTake notes15 min..")
3
Nellie Stone Johnson Community School Mission Mission The mission of Nellie Stone Johnson Community School is to ensure a safe inclusive learning community where all children successfully master academic and social skills preparing them to be creative and critical thinkers.

4
SIP Quarterly Review Goal The goal of the SIP Quarterly Review process is to increase academic outcomes for ALL students with particular attention to closing the achievement gap.

5
Purpose of SIP QR #1 The goal of the SIP Quarterly Review process is to increase academic outcomes for ALL students with particular attention to closing the achievement gap. SIP QR #1 will provide a discussion framework for answering the following questions: Where are we now? Where are we going? How will we get there? How will we monitor progress? Specifically during this discussion we will: Share our plan for the year (SIP) Identify challenges and opportunities for additional support Ask and answer questions regarding SIP
 Identify challenges and opportunities for additional support Ask and answer questions regarding SIP.")
6
Instructional Leadership Team ILT Purpose: School leaders collaborate to improve student learning with a focus on results. ILT roles and responsibilities to support SIP implementation: ❖ Monitor and support PLC’s ❖ Analyze and discuss trends student achievement data ❖ Make data based decisions 2013-14 ILT Areas for Growth: ❖ After analyzing the data, coming up with next steps for implementation in the classrooms. ❖ Staying focused on our goal during meetings. Principal: Leadriane Roby Asst. Principal: Yusuf Abdullah Asst. Principal: Amy Luehmann Language Arts Teacher: Pia Payne-Shannon 1 st grade Teacher: Steve Drone Testing Coordinator: Martha Shanesy Reading Teacher: Sarah Crawford Instructional Specialist: Libby White SIS: Kelly Woods

7
State Data Summary and School Designation School Designation: Priority Data Summary, MDE-Defined: {MMR: 17.76%, FR: 18.00%}

8
MCA Proficiency Data

9
MCA 2012-2013 Percentage of Students Meets or Exceeds Grade Reading Mathematics Science 3 rd 18% 40% NA 4 th 9% 36% NA 5 th 23% 36% 19% 6 th 15% 10% NA 7 th 10% 9% NA 8 th 10% 14% 0%

10
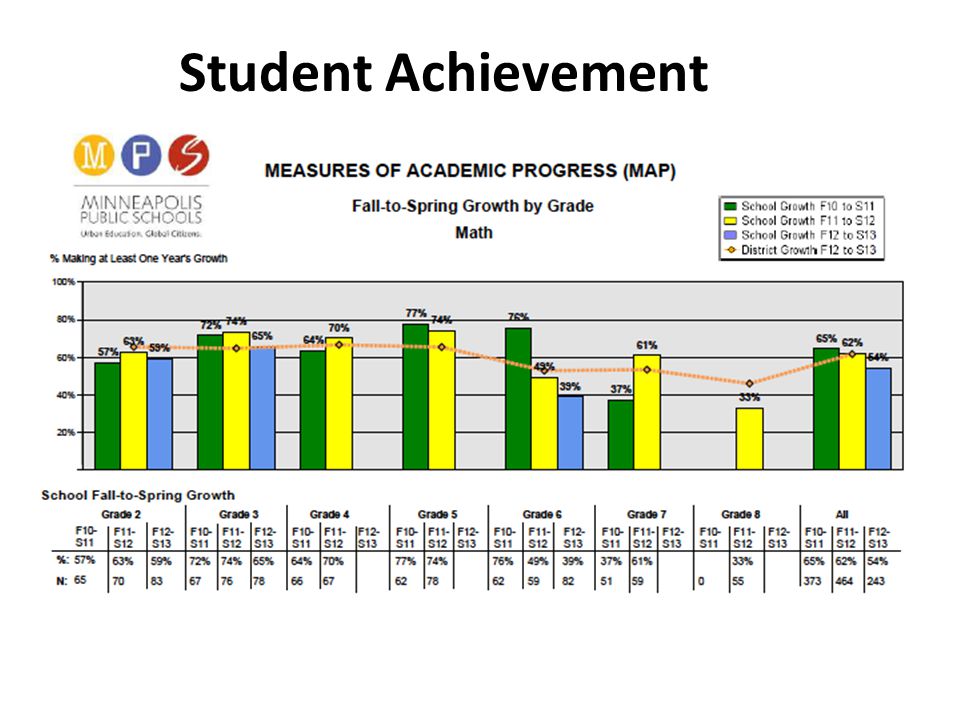
Student Achievement Math: The trend data shows that math proficiency at Nellie Stone Johnson has increased from 20.9% to 24.6%. Priority needs/focus: ●Grades where the percent of students meeting or exceeding the standard in 2013 was below the state and district averages are 3rd, 4th, 5th, 6th, 7th, 8th. ●The largest gap between the school and the state in percent of students meeting or exceeding the standards is in grade 7th. ●6th Grade continues to be an area of focus at 10% proficient in 2013.

11
Student Achievement

13
Math Goal: Increase math proficiency from 24% to 31% on the MCAIII. Strategies Focused Instruction to align what we teach with how we teach and what we assess. Co-teaching with Math Specialists for grades 2-6 Math Specialist and Content teachers will meet in teams and review student data related to math concepts and discuss student work, assessments, and strategies for differentiation. Teachers will create and share (w/students and parents) individual student learning goals (based on assessments) and review progress towards goals. Coaching will be provided by the Instructional Specialist and administration with an emphasis on SOEI 3Bi: Using instructional strategies to engage students in learning. Extend learning opportunities through ALC in subject of mathematics. NSJ will host family fun and learning nights with students and parents to allow children to interact with math activities and games to strengthen students understanding.
 individual student learning goals (based on assessments) and review progress towards goals. Coaching will be provided by the Instructional Specialist and administration with an emphasis on SOEI 3Bi: Using instructional strategies to engage students in learning. Extend learning opportunities through ALC in subject of mathematics. NSJ will host family fun and learning nights with students and parents to allow children to interact with math activities and games to strengthen students understanding..")
14
Student Achievement Reading: 15.4% of the students meet or exceed the standards in Reading. 27% of the students K-8 are in the yellow. 42% of the yellow group are high yellow. Priority needs/focus Grades where the percent of students meeting or exceeding the standard in 2013 was below the state and district averages are 3rd, 4th, 5th, 6th, 7th, 8th. The largest gap between the school and the state in percent of students meeting or exceeding the standards is in 4th grade. Literacy is a focus for all grades.

15
Student Achievement

16
Reading Growth by Grade

17
Student Achievement Goal : Increase reading proficiency from 15% to 22% Strategies Focused Instruction to align what we teach with how we teach and what we assess. Professional Learning Communities that focus on literacy. Use of Readers/Writers workshop Model for literacy. Vocabulary is explicitly taught. Students use specific-content vocabulary during class conversations and/or are encouraged to use content vocabulary by the teacher. Power Words-using 6 simple steps for reading, defining and understanding 12 words that are commonly used on standardized tests. Extend learning opportunities through ALC in subject of reading.

18
School Climate Goal Areas: Increase attendance from 94.14 to 95% Priority needs/focus: Increase attendance in the following categories: Black, Special Education, and Homeless/Highly Mobile Strategies Attendance team meet weekly to identify the frequently absent, send out letters, connect with teachers and make parent & student contact. Daily parent contact for absent students Continue monthly and quarterly recognition for perfect attendance Connect each HHM student with a staff mentor

19
Student Engagement Goal Areas: Decrease the number of removals/suspensions by 15%. Strategies To have all of NSJ teachers and staff trained in Responsive Classroom/Developmental Design by 2015. PD with staff in support of student engagement strategies including school wide morning meetings to set positive tone of classroom and school community. Introduce structured play during recess for Grades K-5. Development of focused single-gender advisories to build students social, emotional problem-solving skills. Implement a student Ambassador Program to create opportunities for student leadership and student empowerment.

20
Professional Practices Informal learning walks related to Responsive Classroom/ Developmental Design Admin, SIS & IL) Established co-teaching model in ELL and SpEd across all grade levels and a math specialist at grades 2, 3, 4, 5 and 6. SOEI Observations Focused Instruction Cohorts Professional development on ST Math in grades 3, 4, 5 PLC’s that will focus on Literacy

21
Summary Statement(s) Our goal is to continue increasing math proficiency for all students by: Maintaining the success of the math support in grades 2,3,4, and 5 while increasing math support in grades 6, 7, 8. Our goal is to show growth in our reading proficiency by: Dedicating our PLC’s to literacy and using data to inform instruction. Our goal is to improve student’s attendance AND decrease the number of removals/ suspensions by: Continuing to focus on the students with a high number of absences, referrals, and suspensions through building relationships and community.

22
PLCs Strengths Common goals and focus (more authentic) Becoming more data driven Based on student work and analysis Challenges Consistency Each action cycle is done with fidelity After analyzing the data, getting stuck with “What’s next” Getting all PLCs to function at the same level What to do with all students (High, medium, low) Celebration of Success
 Becoming more data driven Based on student work and analysis Challenges Consistency Each action cycle is done with fidelity After analyzing the data, getting stuck with What’s next Getting all PLCs to function at the same level What to do with all students (High, medium, low) Celebration of Success")
23
PLCs Key Actions PLCs are a priority. Create high functioning PLCs at NSJ. Continue to analyze student work PLCs document and monitor their progress Consistent focus Monitoring Weekly check-ins by ILT Sharing smart goals and reporting to ILT Carrying out implementation through the SOEI observations Needs for Support Professional Development throughout the cycles Research-based strategies

24
Focused Instruction Strengths Following the scope and sequence Instructional pacing with curriculum guides Challenges Differentiation: Most classroom differentiate based on interest, depth and complexity Scaffolding of learning targets Co-planning with ELL and SpEd

25
Focused Instruction Key Actions Attend Focus Instruction Cohorts Share information during PLCs Monitoring SOEI observations and learning walks Math and science benchmark assessments Needs for Support Understanding the MN Common Core Standards and where they are at in Focus Instruction Assisting teachers with implementing the common core through a cultural lense. Implementing strong effective strategies to meet our students needs.

26
Family Engagement Goal Areas: Increase parent participation during conferences and evening events. Increase the number of returned weekly progress reports. Strategies Communicate to families in multiple ways: website, ROBO CALLS, personal phone call by teacher, and letter etc. Students write a letter to their parents inviting them to events. Find a hook; be purposeful

27
Moving Forward We will strengthen our stakeholder input for school improvement by/through… …Annual staff surveys …10 Minute conversations …Team Meetings...PTA/PTO/Site Council meetings We will strengthen our communication of school improvement progress by/through… …Team meetings …Send letters home to families …State of the school address...NSJ’s Website

28
Data Appendix

29
Black Students Math MCA Trend Data 201120122013 Statewide 28.5%32.6% MPS 18.9%20.1%23.2% NSJ13.0%15.9%17.9% 201120122013 Statewide 52.1%52.7%32.9% MPS41.0%41.6%23.1% NSJ34.3%30.0%12.8% Black Students Reading MCA Trend Data

30
201120122013 Statewid e 53.4%58.9%58.8% MPS 40.5%42.4%44.9% NSJ44.0%40.0% 201120122013 Statewide 64.7%65.8%48.8% MPS 53.7%52.6%39.1% NSJ54.2%56.0%35.0% Asian Students Math MCA Trend Data Asian Students Reading MCA Trend Data

31
Special Ed Students Reading MCA Trend Data Special Ed Students MCA Math Trend Data 201120122013 Statewide43.5%46.1%33.0% MPS30.0%30.7%23.6% Nellie Stone 15.2%16.4%8.5% 201120122013 Statewide29.3%33.9%31.9% MPS20.620.4%21.5% Nellie Stone 4.8%8.0%9.8%

32
201120122013 Statewid e 25.8%37.7%17.2% MPS18.3%19.1%20.9% NSJ19.8%22.4%31.9% 201120122013 Statewid e 37.6%37.7%17.2% MPS30.4%28.4%13.6% NSJ37.8%27.6%14.9% EL Students Math MCA Trend Data EL Students Reading MCA Trend Data

33
201120122013 Statewid e 37.7%43.5%41.5% MPS21.7%22.9%25.2% NSJ18.9%20.6%25.2% 201120122013 Statewid e 58.2%59.4%38.3% MPS40.7%41.0%23.3% NSJ41.6%36.3%15.2% FRP Students Math MCA Trend Data FRP Students Reading MCA Trend Data

34
201120122013 Statewid e 32.0%38.2%36.5% MPS24.4%27.0%29.0% NSJ26.3%26.9%36.9% 201120122013 Statewide52.9%53.8%34.6% MPS41.6%40.4%23.7% NSJ53.6%45.8%17.4% Hispanic Students Math MCA Trend Data Hispanic Students Reading MCA Trend Data

Similar presentations