Download presentation
Presentation is loading. Please wait.

1
The Compelling Display of Health & Safety Information to Achieve Desired Decision Making Robert Emery, DrPH, CHP, CIH, CSP, RBP, CHMM, CPP, ARM Assistant Vice President for Safety, Health, Environment & Risk Management The University of Texas Health Science Center at Houston Associate Professor of Occupational Health The University of Texas School of Public Health

2
Why Training on Data Presentation ? An interesting dilemma: –EH&S programs thrive on data –Virtually every important EH&S decision is based on data to some extent –Formal training in the area of compelling data presentations is rare for EH&S professionals –The ability to compellingly display data is the key to desired decision making

3
Why Training on Data Presentation (cont.)? The EH&S profession is awash in bad examples of data presentations! We’ve all endured them at some point in our careers! Commentary: This may be the reason for repeated encounters with upper management who do not understand what their EH&S programs do.

4
Evolution of EH&S Measures and Metrics First step: –ultimate outcomes – OSHA 300 log, inspection non-compliance Second step: –EH&S activities prior to first order events – injuries and non-compliance

5
Evolution of EH&S Measures and Metrics (cont.) Third step: –Relating activities to larger institutional parameters – true metrics Fourth step: –The compelling display of relationships so that the desired decision by upper management becomes obvious
 Third step: –Relating activities to larger institutional parameters – true metrics Fourth step: –The compelling display of relationships so that the desired decision by upper management becomes obvious")
6
Achieving EH&S Data Display Excellence The presentation of complex ideas and concepts in ways that are –Clear –Precise –Efficient How do we go about achieving this?

7
Go to The Experts On Information Display Three compelling books by Edward Tufte: –The Visual Display of Quantitative Information How to depict data and enforce statistical honesty –Envisioning Information Pictures of nouns –Visual Explanations Pictures of verbs, cause and effect

8
Sample Recommendations Don’t blindly rely on the automatic graphic formatting provided by Excel or Powerpoint! Strive to make large data sets coherent Encourage the eye to compare different data Representations of numbers should be directly proportional to their numerical quantities Use clear, detailed, and thorough labeling

9
Sample Recommendations (cont.) Display the variation of data, not a variation of design Maximize the data to ink ratio – put most of the ink to work telling about the data! When possible, use horizontal graphics: 50% wider than tall is usually best

10
Compelling Tufte Remark Visual reasoning occurs more effectively when relevant information is shown adjacent in the space within our eye-span This is especially true for statistical data where the fundamental analytical act is to make comparisons The key point: “compared to what?”

11
Four UTHSCH “Make Over” Examples Data we accumulated and displayed on: –Nuisance Fire Alarms –Workers compensation experience modifiers –First reports of injury –Corridor clearance But first, 2 quick notes: –The forum to be used: The “big screen” versus the “small screen”? In what setting are most important decisions made? –Like fashion, there are likely no right answers – individual tastes apply, but some universal rules will become apparent

12
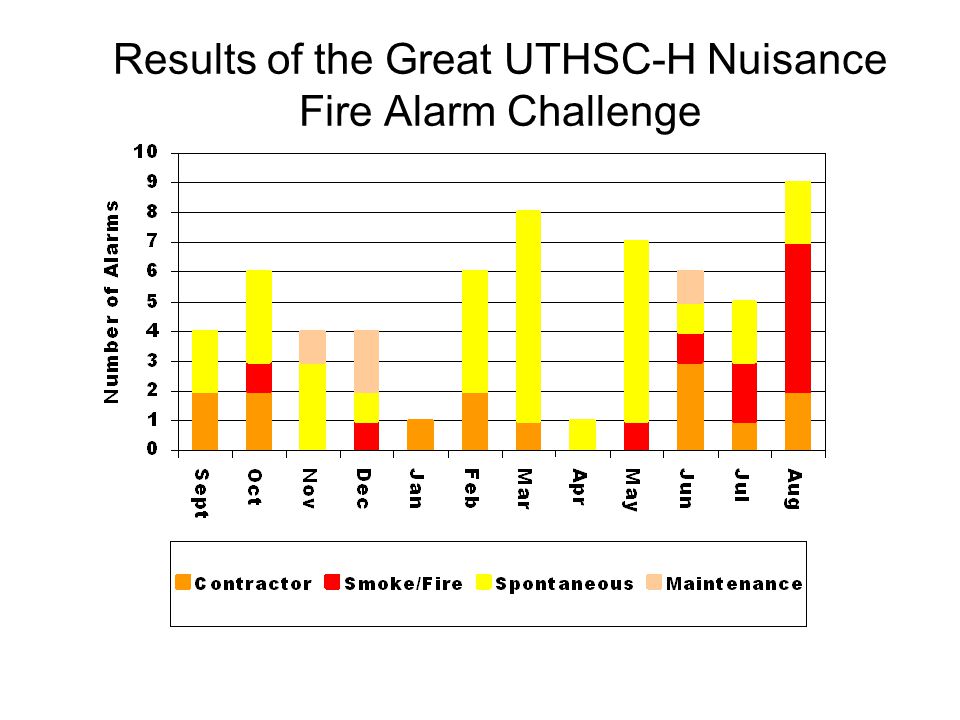
Results of the Great UTHSC-H Nuisance Fire Alarm Challenge

19
Results of the Great UTHSC-H Nuisance Fire Alarm Challenge (FY04) Fiscal Year 04
 Fiscal Year 04")
20
Results of the Great UTHSC-H Nuisance Fire Alarm Challenge

21
Employee Worker’s Comp Experience Modifier compared to other UT health components, FY 98-FY 04 UT-TylerUTMBUT-SAMDAUT-HUT-SW Rate of "1" industry average, representing $1 premium per $100

22
WCI Premium Adjustment for UTS Health Components (discount premium rating as compared to a baseline of 1) Fiscal year UT Health Center Tyler UT Medical Branch Galveston UT HSC San Antonio UT Southwestern Dallas UT HSC Houston UT MD Anderson Cancer Center
 Fiscal year UT Health Center Tyler UT Medical Branch Galveston UT HSC San Antonio UT Southwestern Dallas UT HSC Houston UT MD Anderson Cancer Center")
23
Losses – Personnel Reported Injuries by Population EmployeeResidentStudent 690 694715 675 623608 511

24
Number of First Reports of Injury, by Population Type Total Employees Residents Students

26
MSB Corridor Blockage in Cumulative Occluded Linear Feet, by Month and Floor (building floor indicated at origin of each line) 2004 2005 7 th 6 th 5 th 4 th 3 rd 2 nd 1 st G
 th 6 th 5 th 4 th 3 rd 2 nd 1 st G")
27
Summary The ability to display data compellingly is the key to desired decision making Always anticipate “compared to what?” Maximize the data-to-ink ratio – e.g. eliminate the unnecessary Think about what it is you’re trying to say Show to others unfamiliar with the topic without speaking – does this tell the story we’re trying to tell?

28
Your Questions? Other Examples?

29
COLLABORATIVE LABORATORY INSPECTION PROGRAM (CLIP) Total PI’s#Without Lab Violations # With Lab Violations %Without Lab Violations %With Lab Violations May 200594534156.3843.62 June 200578403851.2848.72 July 200584543064.2935.71 August 200574542072.9727.03 September 200569393056.5243.48 October 200580503062.5037.50 During October 2005, 80 Principle Investigators for a total of 316 laboratory rooms were inspected A total of 30 CLIP inspections were performed PI Inspections:
 Total PI’s#Without Lab Violations # With Lab Violations %Without Lab Violations %With Lab Violations May June July August September October During October 2005, 80 Principle Investigators for a total of 316 laboratory rooms were inspected A total of 30 CLIP inspections were performed PI Inspections:")
30
2005 Collaborative Laboratory Inspection Program (CLIP) Inspection Activities and Compliance Findings Number without violations Number with violations
 Inspection Activities and Compliance Findings Number without violations Number with violations")
31
2005 Collaborative Laboratory Inspection Program (CLIP) Inspection Activities and Compliance Findings Number without violations Number with violations
 Inspection Activities and Compliance Findings Number without violations Number with violations")
33
Fig. 3. Receipts of Radioactive Materials Number of medical use radioactive material receipts Number of non-medical use radioactive material receipts

34
Fig. 3. Receipts of Radioactive Materials Number of medical use radioactive material receipts Number of non-medical use radioactive material receipts

36
2005 Total Number of Monthly Workers Compensation Claims inclusive of the three most frequent identifiable classes of injuries Total Fall Strain Cut, Puncture

37
Fire Extinguisher Systems Fire ExtinguishersFire Related Incidents Asbestos Projects 19860000 1996203199155 1998208251568 200343746-18191

38
Growth in Occupational Safety Responsibilities 1986 to 2003

40
Figure 1: Laboratory Waste verses Total Waste Generated

41
Amount from administrative departments Amount from renovation projects Total hazardous waste generation in pounds Amount from laboratory operations Figure 1: Hazardous Waste Generation in Pounds by Type of Institutional Activity

42
Figure 1: Laboratory Waste verses Total Waste Generated

43
Figure 2: Annual Hazardous Waste Disposal Cost by Type of Institutional Activity Total cost Cost of waste from lab operations Cost of waste from administrative departments Cost of waste from renovation projects

45
UCR Campus Growth Indicators Compared to EH&S Staffing

46
Note: Emery ranked as Assistant Professor 1999-2000, promoted to Associate Professor in 2002. Outstanding Excellent Good Acceptable

47
Annual SPH Faculty Activities Peer Review Results for Emery (15% Faculty Appointment) Outstanding Excellent Acceptable Good Asst Professor Assoc Professor
 Outstanding Excellent Acceptable Good Asst Professor Assoc Professor")
Similar presentations


 at the University of North Carolina at Chapel Hill Jonathan Moore, Associate Radiation Safety Officer.>")


