Download presentation
Presentation is loading. Please wait.

1
To Start the Slideshow Press ‘F5’ or Click “View” and then Click “Slide Show” © Automatic Forecasting Systems 2010

2
Awards Picked as the “Best Dedicated Forecasting” Software in the “Principles of Forecasting” text book (Go to page 671 for overall results) Placed 12th in the “NN5” 2010 Forecasting Competition on “Daily data” (Click here to see results), but 1st among Automated software. Placed 2nd in the “NN3” 2007 Forecasting Competition on “Monthly data” (Click here to see and 1st on more difficult data sets. © Automatic Forecasting Systems 2010
, but 1st among Automated software. Placed 2nd in the NN Forecasting Competition on Monthly data (Click here to see and 1st on more difficult data sets. © Automatic Forecasting Systems")
3
Journals Autobox has been used in articles published in a variety of Journals as it has unique strengths not found in other software. Read the articles in our “News” section on the website Journal of Forecasting Journal of Business Forecasting North American Actuarial Journal Forest Research and Management Institute Environmental and Resource Economics Technological Forecasting and Social Change Fraud Magazine Canadian Journal of Forest Research Applied Economics Journal of applied Pharmacology Journal of Endocrinology and Metabolism Journal of Urban Studies © Automatic Forecasting Systems 2010

4
Some Recent Customers © Automatic Forecasting Systems 2010

5
© Automatic Forecasting Systems 2010
System Integrators AFS has focused on providing Autobox as an engine to business partners who provide value added integrated solutions. Partial List of OEM Partners: AdapChain – Market6 Corporation - Fiserv Corporation – © Automatic Forecasting Systems 2010 © Automatic Forecasting Systems 2010

39
Autobox’s Early Warning System
You can inform senior management which SKU’s seem to be out of control based on the latest data. Instead of using an arbitrary measure to detect unusual behavior (i.e. % change from last year or % difference using the last two periods), Autobox tells you “the probability of observing that last observation before it was observed” . Autobox will test and report on the probability that the last observation is unusual. It will write out a report for every series analyzed which can then be sorted to identify those series that look to be unusual. Here we run the series “inlier” and the report shows no warning in the “probability” field when the actual last value was 9.0. When we change that value to a 5.0 and rerun then AUTOBOX reacts and the small P-value reported showing us significance. © Automatic Forecasting Systems 2010
, Autobox tells you the probability of observing that last observation before it was observed . Autobox will test and report on the probability that the last observation is unusual. It will write out a report for every series analyzed which can then be sorted to identify those series that look to be unusual. Here we run the series inlier and the report shows no warning in the probability field when the actual last value was 9.0. When we change that value to a 5.0 and rerun then AUTOBOX reacts and the small P-value reported showing us significance. © Automatic Forecasting Systems")
40
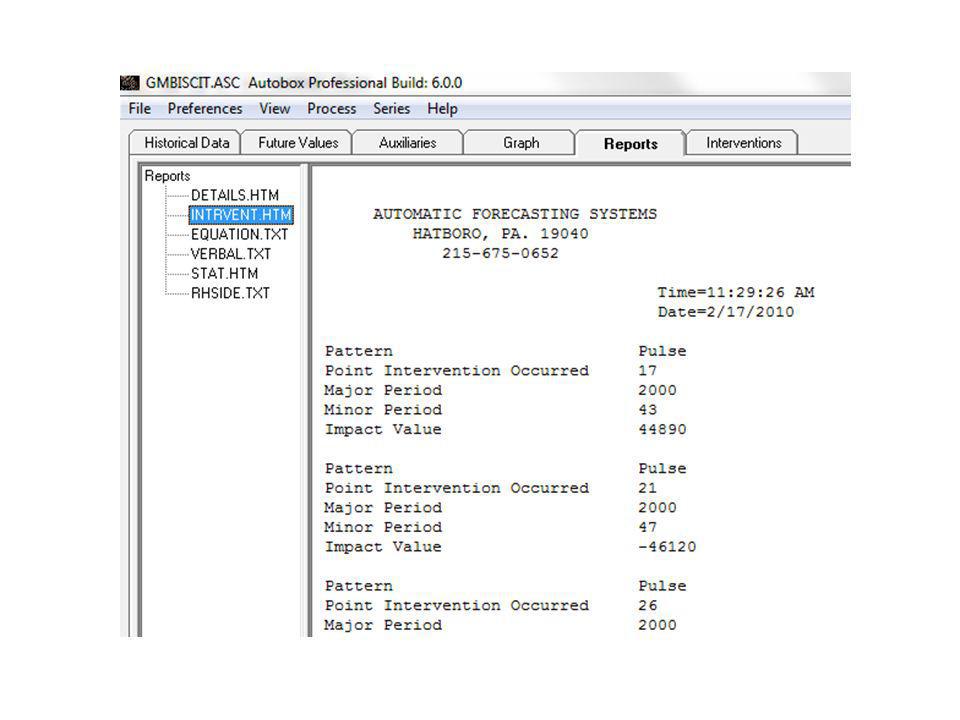
Autobox’s Pulse Report and Level Report
You can identify across all SKU’s a point in time where many of the SKU’s seem to be out of control suggesting a widespread event (known or possibly unknown). Pulse Interventions and Level Shift Interventions are reported for every time period and for every SKU. Just import the data into Excel, sum the columns and transpose to identify time periods with multiple pulses in the same time period. 2 of the 3 SKUs show period 30, 41, and 52 with an intervention. This might spark some discussion as to why this is occurring. It may be random or part of a systematic event. If so, then a causal variable could be introduced before running Autobox to include its effect as it might occur in the future and you can now plan for it. © Automatic Forecasting Systems 2010
. Pulse Interventions and Level Shift Interventions are reported for every time period and for every SKU. Just import the data into Excel, sum the columns and transpose to identify time periods with multiple pulses in the same time period. 2 of the 3 SKUs show period 30, 41, and 52 with an intervention. This might spark some discussion as to why this is occurring. It may be random or part of a systematic event. If so, then a causal variable could be introduced before running Autobox to include its effect as it might occur in the future and you can now plan for it. © Automatic Forecasting Systems")
41
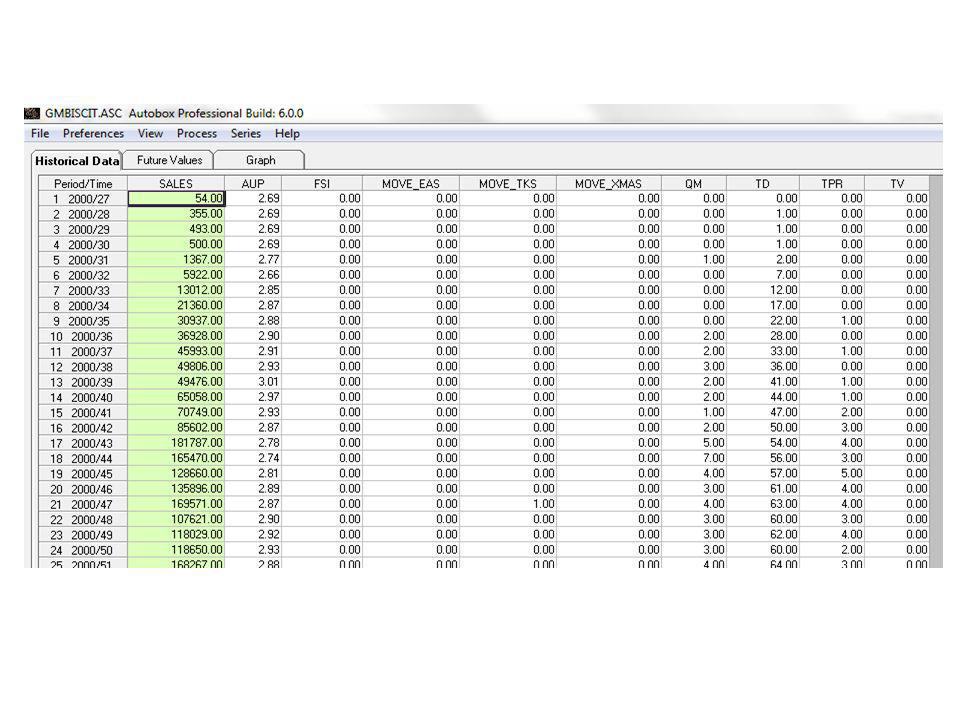
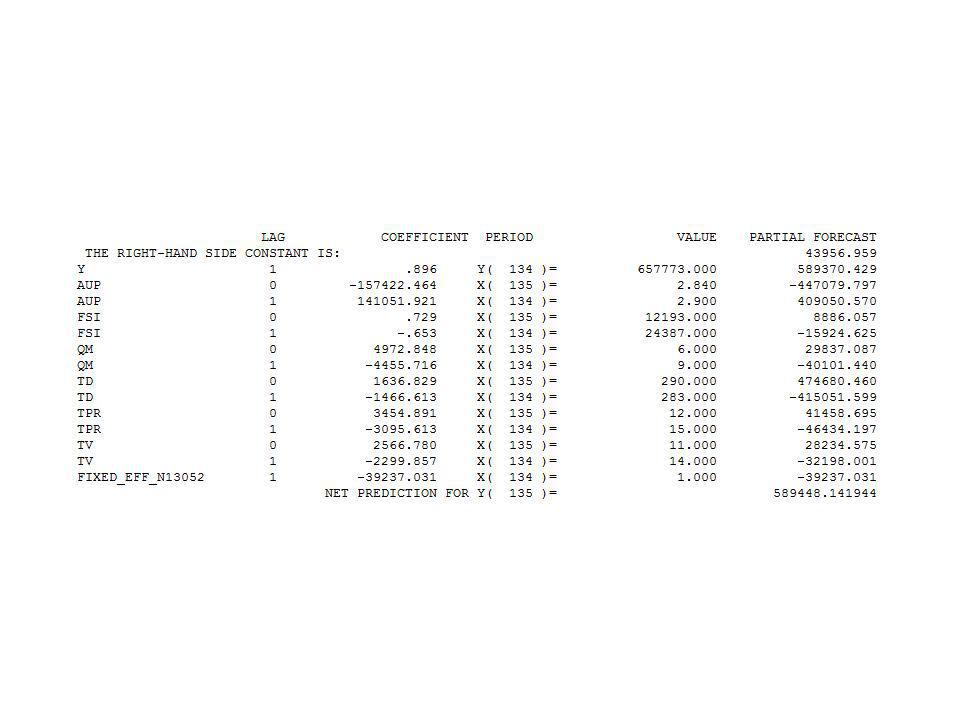
Case Study – What-if Analysis Baseline Forecast
© Automatic Forecasting Systems 2010 © Automatic Forecasting Systems 2010

42
Case Study – What-if Analysis Baseline Future Values of Causals
© Automatic Forecasting Systems 2010 © Automatic Forecasting Systems 2010

43
Case Study – What-if Analysis Scenario #1 Adjust Price and TV Spots Up
© Automatic Forecasting Systems 2010 © Automatic Forecasting Systems 2010

44
Case Study – What-if Analysis Graph of Baseline and Scenario #1
© Automatic Forecasting Systems 2010 © Automatic Forecasting Systems 2010

Similar presentations