Download presentation
Presentation is loading. Please wait.

1
ECMWF long range forecast systems
Dr. Tim Stockdale European Centre for Medium-Range Weather Forecasts

2
Outline Overview of System 4 Some recent research results
EUROSIP multi-model forecasts Forecasts for JJA 2013 Seasonal prediction at ECMWF History/approach Strengths and weaknesses of S4 History of EUROSIP, including theory of multi-model Inc DEMETER results as motivation Also theoretical basis for mm averaging Practical considerations – real-time risks, confidence etc NCEP joining Mention Paco’s assessment Difficulty of 14 years for assessment Show some results from Laura New suite and products Mention that NCEP processing suite now operational New multi-model suite still in esuite – want to be sure everything is complete, and manage handover for MS Example plots, esp inc Nino pdfs. Summary Operational system, plus benefits for research, some already, more for future. Plus meeting together, discussing, sharing expertise etc.

3
System 4 seasonal forecast model
IFS (atmosphere) TL255L91 Cy36r4, 0.7 deg grid for physics (operational in Dec 2010) Full stratosphere, enhanced stratospheric physics Singular vectors from EPS system to perturb atmosphere initial conditions Ocean currents coupled to atmosphere boundary layer calculations NEMO (ocean) Global ocean model, 1x1 resolution, 0.3 meridional near equator NEMOVAR (3D-Var) analyses, newly developed. Coupling Fully coupled, no flux adjustments Sea-ice based on sampling previous five years
 TL255L91 Cy36r4, 0.7 deg grid for physics (operational in Dec 2010) Full stratosphere, enhanced stratospheric physics. Singular vectors from EPS system to perturb atmosphere initial conditions. Ocean currents coupled to atmosphere boundary layer calculations. NEMO (ocean) Global ocean model, 1x1 resolution, 0.3 meridional near equator. NEMOVAR (3D-Var) analyses, newly developed. Coupling. Fully coupled, no flux adjustments. Sea-ice based on sampling previous five years.")
4
Reduced mean state errors
JJA T850 bias (left), DJF U50 – stratosphere – right. S4 bias (top), S3 (bottom) – on same scale!! Note for T850, much reduced error in structure of T850 field over N America And surrounding oceans These plots are typical of very many fields – almost all aspects of climate improved. Almost all!
, DJF U50 – stratosphere – right. S4 bias (top), S3 (bottom) – on same scale!! Note for T850, much reduced error in structure of T850 field over N America And surrounding oceans. These plots are typical of very many fields – almost all aspects of climate improved. Almost all!")
5
Tropospheric scores One month lead Four month lead
Spatially averaged grid-point temporal ACC One month lead Four month lead

6
S4 extended hindcast set
Scores are smoother and systematically higher with 51 member hindcasts

7
S4 extended hindcast set
Gain over S3 is now stronger and more robust

8
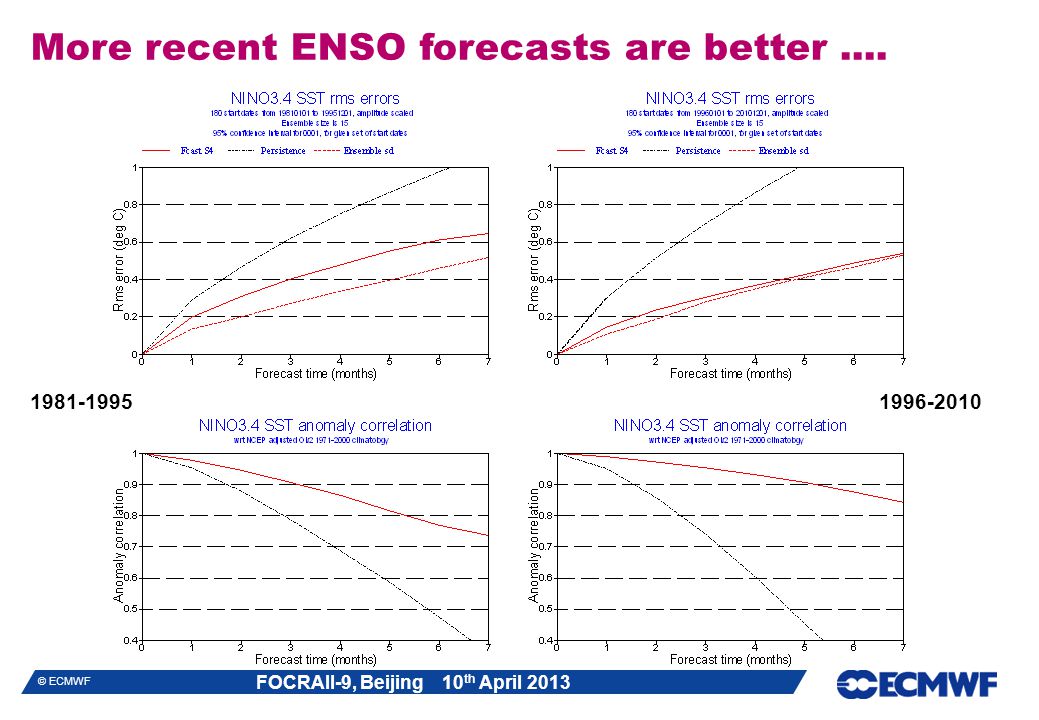
More recent ENSO forecasts are better ....
9
QBO System 4 30hPa System 3 50hPa

10
Problematic ozone analyses

11
Snow depth limits, 1st April
Land surface Snow depth limits, 1st April

12
Sea ice

13
Tropical storm forecasts

14
Recent Research

15
QBO A big reduction in vertical diffusion, and a further tuning of non-orographic GWD, has given a big additional improvement in the QBO compared to S4. Period and downward penetration match observations Semi-annual oscillation still poorly represented

16
QBO forecasts S3 S4 New

17
NH winter forecasts 0.371 0.319

18
NH winter forecasts Even with 101 members, ensemble mean signal not always well defined

19
NH winter forecasts New version has weaker signal, more noise

20
NH winter forecasts Forecast skill is above perfect model predictability limit

21
EUROSIP A European multi-model seasonal forecast system
Operational since 2005 Data archive and real-time forecast products Initial partners: ECMWF, Met Office, Météo-France NCEP an Associate Partner; forecasts included since 2012 Products released at 12Z on the 15th of each month Aim is a high quality operational system Data policy issues are always a factor in Europe Initially, all models ran at ECMWF, comprehensive data archive; now, some models run remotely with reduced data volumes Also more diversity in forecast/re-forecast strategy

22
Recent changes: variance scaling
Robust implementation Limit to maximum scaling (1.4) Weakened upscaling for very large anomalies Improves every individual model Improves consistency between models Improves accuracy of multi-model ensemble mean
 Weakened upscaling for very large anomalies. Improves every individual model. Improves consistency between models. Improves accuracy of multi-model ensemble mean.")
23
Revised Nino plumes

24
Error vs spread (uncalibrated)
")
25
Calibrated p.d.f. ENSO forecasts have good past performance data
We can calibrate forecast spread based on past performance We can also allow varying weights for models We have to be very careful not to overfit data at any point. Represent forecast with a p.d.f. This is the natural output of our calibration procedure Easier visual interpretation by user Calibration and combination in general case Ideally apply similar techniques to all forecast values (T2m maps etc) More difficult because less information on past (higher noise levels) Hope to get there eventually ….. .
 More difficult because less information on past (higher noise levels) Hope to get there eventually ….. .")
26
Nino 3.4 plume and p.d.f.

27
P.d.f. interpretation P.d.f. based on past errors Bayesian p.d.f.
The risk of a real-time forecast having a new category of error is not accounted for. E.g. Tambora volcanic eruption. We plot 2% and 98%ile. Would not go beyond this in tails. Risk of change in bias in real-time forecast relative to re-forecast. Bayesian p.d.f. Explicitly models uncertainty coming from errors in forecasting system Two different systems will calculate different pdf’s – both are correct Validation Rank histograms show pdf’s are remarkably accurate (cross-validated) Verifying different periods shows relative bias of different periods can distort pdf – sampling issue in our validation data.
 Verifying different periods shows relative bias of different periods can distort pdf – sampling issue in our validation data.")
28
Forecasts for JJA 2013

29
ECMWF forecast: ENSO Past performance

30
EUROSIP forecast: ENSO
Past performance

31
Tercile probabilities
ECMWF forecast: JJA 2mT Tercile probabilities ACC skill ( )
")
32
ECMWF forecast: JJA precip
Tercile probabilities ACC skill ( )
")
Similar presentations


 Instituto Nacional de Pesquisas Espaciais (INPE) 1 st EUROBRISA.>")


