Download presentation
Presentation is loading. Please wait.

1
Caitlin S. Flinn, NCSP & Andy E. McCrea, NCSP NASP Annual Convention – February 23, 2012

2
Participants will ◦ Review the research on interpreting student growth using CBM ◦ Learn how to use Excel or Numbers to calculate a rate of improvement (RoI) statistic ◦ Learn how student growth fits into the eligibility conversation within an RTI system
 statistic ◦ Learn how student growth fits into the eligibility conversation within an RTI system")
3
Assuming participants have at least a basic understanding of: ◦ Response to Intervention (RTI) components/framework ◦ Specific learning disabilities (SLD) ◦ The Individuals with Disabilities Education Act (IDEA) ◦ Curriculum-based measurements (CBM)
 components/framework ◦ Specific learning disabilities (SLD) ◦ The Individuals with Disabilities Education Act (IDEA) ◦ Curriculum-based measurements (CBM)")
4
Rate of improvement (RoI) Background and Definitions RoI in the Context of an RTI System Establishing a Need for Consistency and for Quantifying RoI Graphing and Calculating RoI for Individual Students Applying RoI: Operationalizing Adequate & Inadequate Growth
 Background and Definitions RoI in the Context of an RTI System Establishing a Need for Consistency and for Quantifying RoI Graphing and Calculating RoI for Individual Students Applying RoI: Operationalizing Adequate & Inadequate Growth")
5
Background and Definitions

6
Specific Learning Disability InclusionaryExclusionary 1. Failure to meet age- or grade-level State standards in one of eight areas: oral expression listening comprehension written expression basic reading skill reading fluency skill reading comprehension mathematics calculation mathematics problem solving 2. Discrepancy: Pattern of strengths & weaknesses, relative to intellectual ability as defined by a severe discrepancy between intellectual ability and achievement, or relative to age or grade. OR RTI: Lack of progress in response to scientifically based instruction 3. Rule out: Vision, hearing, or motor problems mental retardation emotional disturbance cultural and/or environmental issues limited English proficiency 4. Rule out lack of instruction by documenting: Appropriate instruction by qualified personnel Repeated assessments Observation PA Guidelines, 2008

7
…that is the question! First – Define Progress… Progress Monitoring: Continuous progress monitoring of student performance and use of progress monitoring data to determine intervention effectiveness and drive instructional adjustments, and to identify/measure student progress toward instructional and grade-level goals. (PA) Progress = Rate of Improvement (ROI)
 Progress = Rate of Improvement (ROI).")
8
Growth, progress, learning Algebraically: slope of a line Slope: the vertical change over the horizontal change on a Cartesian plane. (x-axis and y-axis graph) ◦ Also called: Rise over run ◦ Formula: m = (y 2 - y 1 ) / (x 2 - x 1 ) ◦ Describes the steepness of a line (Gall & Gall, 2007)
 ◦ Also called: Rise over run ◦ Formula: m = (y 2 - y 1 ) / (x 2 - x 1 ) ◦ Describes the steepness of a line (Gall & Gall, 2007).")
9
Finding a student’s rate of improvement means determining the student’s learning What are some ways you are currently using to determine a student’s learning? ◦ Looking at CBM data, are the scores improving? ◦ Looking at where the student is performing compared to their aimline (goal) on a graph ◦ Creating a line that fits the data points – line of best fit, trendline
 on a graph ◦ Creating a line that fits the data points – line of best fit, trendline.")
10
Measures basic skills – general outcome measures Technically adequate – reliable and valid ◦ RTI4success.org Table of Assessment Tools http://www.rti4success.org/progressMonitoringTools http://www.rti4success.org/progressMonitoringTools Quick to administer Sensitive to growth Alternate forms / repeatable Standardized Represented well in educational research Linked to instruction and intervention

11
Oral Reading Fluency Reading Comprehension Early Literacy Skills Spelling Written Expression Math Computation Math Concepts and Applications Early Numeracy Behavior*

12
10 data points are a minimum requirement for a reliable trendline (Gall & Gall, 2007) 7-8 is minimum for using the Tukey Method (Wright, 1992) 8-9 for stable slopes of progress in early writing (McMaster, 2011) Take-away: The more data points the more stable the slope (Christ, 2006; Hintze & Christ, 2004)
 7-8 is minimum for using the Tukey Method (Wright, 1992) 8-9 for stable slopes of progress in early writing (McMaster, 2011) Take-away: The more data points the more stable the slope (Christ, 2006; Hintze & Christ, 2004)")
13
Results Summary

14
Speeches that included visuals, especially in color, improved recall of information (Vogel, Dickson, & Lehman, 1990) “Seeing is believing.” Useful for communicating large amounts of information quickly “A picture is worth a thousand words.” Transcends language barriers (Karwowski, 2006) Responsibility for accurate graphical representations of data
 Seeing is believing. Useful for communicating large amounts of information quickly A picture is worth a thousand words. Transcends language barriers (Karwowski, 2006) Responsibility for accurate graphical representations of data")
15
To graph data responsibly! To find the line of best fit with CBM data ◦ Simple linear regression ◦ Ordinary least squares To quantify RoI ◦ Using a trendline of CBM data, calculate slope

16
In the Context of an RTI System

17
PA Model www.pattan.netwww.pattan.net Standards aligned core instruction Universal screening Interventions of increasing intensity Research-based practices Progress monitoring Data analysis teaming Parental engagement

18
Fuchs & Fuchs (1998) Hallmark components of Response to Intervention ◦ Ongoing formative assessment ◦ Identifying non-responding students ◦ Treatment fidelity of instruction Dual discrepancy model ◦ Significantly below typically performing peers in level and rate
 Hallmark components of Response to Intervention ◦ Ongoing formative assessment ◦ Identifying non-responding students ◦ Treatment fidelity of instruction Dual discrepancy model ◦ Significantly below typically performing peers in level and rate")
19
School Improvement/Comprehensive School Reform Response to Intervention Dual Discrepancy: Level & Growth Rate of Improvement

20
Classroom Instruction (Content Expectations) Measure Impact (Test) Proficient!Non Proficient Content Need?Basic Skill Need? Intervention Progress Monitor With CBM Rate of Improvement Intervention Progress Monitor If CBM is Appropriate Measure Use Diagnostic Test to Differentiate

21
RoI for instructional decisions is not a perfect process, but is well-documented and researched Many sources of error to consider: ◦ Standard error of measurement for slope (Christ, 2006) Ben Ditkowsky www.measuredeffects.comwww.measuredeffects.com Downloads > Monitor with Confidence chart ◦ Reading passage variability (Ardoin & Christ, 2009) ◦ Frequency of progress monitoring (Jenkin, Graff, & Miglioretti, 2009)
 Ben Ditkowsky Downloads > Monitor with Confidence chart ◦ Reading passage variability (Ardoin & Christ, 2009) ◦ Frequency of progress monitoring (Jenkin, Graff, & Miglioretti, 2009)")
22
Many sources of error to consider (cont.): ◦ Progress monitoring off grade level (Silberglitt & Hintze, 2007) ◦ CBM for non-English speaking students ◦ Difference in growth for benchmarks between fall and spring (Ardoin & Christ, 2008; Christ, Silberglitt, Yeo, & Cormier, 2010; Graney, Missall, & Martinez, 2009; Fien, Park, Smith, & Baker, 2010) ◦ Difference in growth depending on initial level of performance (Fien, Park, Smith, & Baker, 2010; Good et. al., 2010, Silberglitt & Hintze, 2007)
.")
23
“…before adding a trend line, it is important to carefully consider whether the overall pattern in the data is consistent and linear across time, or whether another pattern (nonlinear, curvilinear) better explains the data.” Hixson, Christ, & Bradley-Johnson. (2008) Best Practices in the Analysis of Progress Monitoring Data and Decision Making. Best Practices in School Psychology V. 135 (6) 2133-2146.
 Best Practices in the Analysis of Progress Monitoring Data and Decision Making. Best Practices in School Psychology V. 135 (6)")
24
More growth from fall to winter than winter to spring for benchmarks (3x per year) ◦ Christ & Ardoin (2008) ◦ Christ, Silberglitt, Yeo, & Cormier (2010) ◦ Fien, Park, Smith, & Baker (2010) More growth from winter to spring than fall to winter ◦ Graney, Missall, & Martinez (2009)
 ◦ Christ & Ardoin (2008) ◦ Christ, Silberglitt, Yeo, & Cormier (2010) ◦ Fien, Park, Smith, & Baker (2010) More growth from winter to spring than fall to winter ◦ Graney, Missall, & Martinez (2009)")
25
DIBELS (6 th Ed.) ORF Norms Fall to Winter Winter to Spring 2 nd 2422 3 rd 1518 4 th 1313 5 th 119 6 th 115
 ORF Norms Fall to Winter Winter to Spring 2 nd rd th th th 115")
26
AIMSWeb Norms R-CBM Based on 50 th Percentile Fall to Winter Winter to Spring 1 st 1831 2 nd 2517 3 rd 2215 4 th 1613 5 th 1715 6 th 1312

27
Fuchs, Fuchs, Hamlett, Walz, & Germann (1993) Typical weekly growth rates in oral reading fluency and digits correct Silberglitt & Hintze (2007) Examined weekly growth in R-CBM mediated by level Shapiro (2008) Described challenging and ambitious goals for rates of improvement
 Typical weekly growth rates in oral reading fluency and digits correct Silberglitt & Hintze (2007) Examined weekly growth in R-CBM mediated by level Shapiro (2008) Described challenging and ambitious goals for rates of improvement")
28
Benchmark ROI=0.88 Student SLOPE=2.5 Benchmark ROI=1.06 Student SLOPE=1.89

30
Looked at Rate of Improvement in small 2nd grade sample Found differences in RoI when computed for fall and spring: Ave RoI for fall:1.47 WCPM Ave RoI for spring:1.21 WCPM

31
Relax instruction after high stakes testing in March/April; a PSSA effect. Depressed initial benchmark scores due to summer break; a rebound effect (Clemens). Instructional variables could explain differences in Graney (2009) and Ardoin (2008) & Christ (in press) results (Silberglitt). Variability within progress monitoring probes (Ardoin & Christ, 2008) (Lent).
. Instructional variables could explain differences in Graney (2009) and Ardoin (2008) & Christ (in press) results (Silberglitt). Variability within progress monitoring probes (Ardoin & Christ, 2008) (Lent)..")
32
Fien, Park, Smith, & Baker (2010) ◦ Different growth rates depending on beginning level Silberglitt & Hintze (2007) ◦ Differences in growth rates depending on level ◦ Lowest and highest deciles had least amount of growth
 ◦ Different growth rates depending on beginning level Silberglitt & Hintze (2007) ◦ Differences in growth rates depending on level ◦ Lowest and highest deciles had least amount of growth")
33
Growth Rate as Function of Level at BOY (2 nd Grade) 20th40th60th80 th Intensive 0 to 50.110.330.560.98 6 to 150.400.701.051.53 16 to 250.951.431.782.20 Strategic 26 to 341.301.732.062.43 35 to 431.501.832.112.50
 20th40th60th80 th Intensive 0 to to to Strategic 26 to to")
34
And for Quantifying RoI

35
“Statistical methods, such as ordinary least square regression can be used to calculate the slope or trend line… Visual analysis can also be used to estimate the general pattern of change across time.” p 2136 Hixson, Christ, & Bradley-Johnson. (2008) Best Practices in the Analysis of Progress Monitoring Data and Decision Making. Best Practices in School Psychology V. 135 (6) 2133-2146.
 Best Practices in the Analysis of Progress Monitoring Data and Decision Making. Best Practices in School Psychology V. 135 (6)")
36
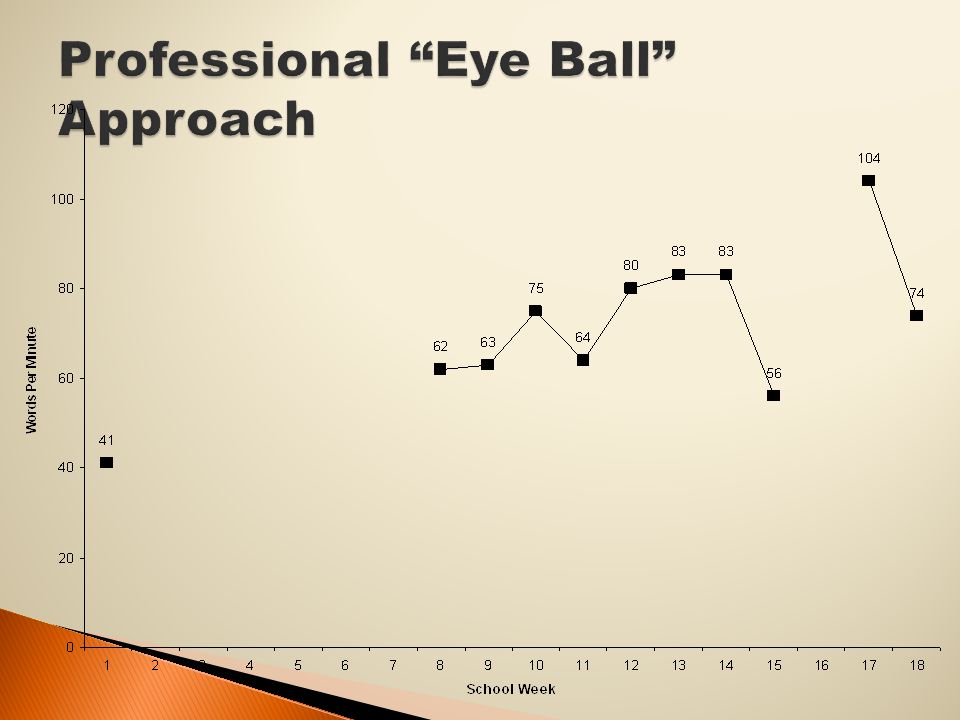
QUALITATIVE APPROACHES QUANTITATIVE APPROACHES Professional “Eye Ball” Approach Three Data-Point Decision Rule Split Middle Standard Celeration Chart Tukey Method Last Minus First Tukey Method “Plus” a statistic Split Middle “Plus” a statistic Linear Regression*

37
Methods for Interpreting Rate of Improvement

38
Are the data generally trending in a positive, negative, neutral manner? Where are the data points in relation to the goal or aimline (if available)? Is there variability among the data points?
. Is there variability among the data points .")
40
PROSCONS Easy to use, no calculations involved May lead to interesting discussions Fairly subjective May lead to interesting discussions because there are multiple interpretations of the same data

41
Requires an aimline If three successive data points lie above the aimline, adjust the aimline upward If three successive data points lie below the aimline, adjust the instructional intervention If three successive data points lie around the aimline, make no changes (Wright, 1992)
")
43
PROSCONS Easy to use Requires only an aimline and three data points No calculations or software needed, can complete by hand Does not provide an RoI statistic Does not indicate a degree of growth Need to be good at drawing lines and accurately plotting data!

44
Developed by Ogden Lindsley, precision teaching Ensures a standardization in the display of data Y-axis: set up on a multiply scale to accommodate behavior frequencies ranging from 1 per day to 1,000 per minute X-axis: set up on an add scale to accommodate 140 successive calendar days, which is about the equivalent of one school semester Mark multiple academic skills/behaviors on same graph Leave blank any days a skill wasn’t measured (White, 1986, p. 524)
.")
47
PROSCONS Easy to use Can measure multiple academic behaviors (errors and corrects) Easy to share with students Charts about one semester at a time No software or calculations required Requires specific graph paper – one sheet per student Does not provide an RoI statistic Does not provide a degree of growth
 Easy to share with students Charts about one semester at a time No software or calculations required Requires specific graph paper – one sheet per student Does not provide an RoI statistic Does not provide a degree of growth")
48
Drawing a line through the two points obtained from the median data values and the median days when the data are divided into two sections.” (Shinn, Good, & Stein, 1989) 1. Split the data points into two sections – if unequal, draw line on the middle data point. 2. Find the middle/median data point in each section. This gives you the X-value. 3. Figure out the median number of weeks in each section. This gives you the Y-value. 4. Draw a line through those two coordinates.

49
(6, 63) (15, 83) X X
 (15, 83) X X")
50
PROSCONS No calculations or software needed Can be done fairly easily by hand Provides a trendline to compare against an aimline (yes/no for acquisition of skill) Accounts for outliers Possible solution for different RoIs between fall and spring Does not provide an RoI statistic Does not described degree of growth Need to have some training in finding the median score and week
 Accounts for outliers Possible solution for different RoIs between fall and spring Does not provide an RoI statistic Does not described degree of growth Need to have some training in finding the median score and week")
51
1. Count the number of data points on the graph. 2. Divide the graph into three approximately equal sections. 3. Ignore the middle section and focus on first and third section. Draw an X where the median data point in the first section meets with the median number of weeks in that section. Then do the same for the third section: Draw an X where the median data point meets with the median number of weeks in that section. 4. Draw a line through both Xs, extending to the ends of the graph to see an approximate rate of improvement, or trendline.

52
(5, 62) (16, 74) X X
 (16, 74) X X")
53
PROSCONS No calculations or software needed, can be done fairly easily by hand Provides a trendline to compare against and aimline (yes/no for acquisition of skill) Accounts for outliers May be a solution to account for differences in performance b/t fall and spring RoI Ignores middle 1/3 of data Does not provide an RoI statistic Does not described degree of growth Need to have some training in finding the median score and week
 Accounts for outliers May be a solution to account for differences in performance b/t fall and spring RoI Ignores middle 1/3 of data Does not provide an RoI statistic Does not described degree of growth Need to have some training in finding the median score and week")
54
Methods for Interpreting Rate of Improvement

55
Iris Center http://iris.peabody.vanderbilt.edu/resources.html http://iris.peabody.vanderbilt.edu/resources.html Last data point minus first data point Divided by administration period minus first administration period RoI = (Y2 – Y1) / (X2 – X1) RoI = (74 – 41) / (18 – 1) 33 / 17 = 1.9 RoI = 1.9 words gained on average per week
 / (X2 – X1) RoI = (74 – 41) / (18 – 1) 33 / 17 = 1.9 RoI = 1.9 words gained on average per week")
56
Student SLOPE=1.9

57
PROSCONS Provides a growth statistic and trendline Can compare trendline to aimline Easy to compute, software not necessary, can complete by hand Does not account for all data points, depends only on two data points Requires some simple math

58
Median point in 2 nd section minus median point in 1 st section Divided by median point in 2 nd section minus median point in 1 st section RoI = (Y2 – Y1) / (X2 – X1) RoI = (83 – 63) / (15.5 – 6.5) 20 / 9 = 2.2 2.2 word correct gained on average per week
 / (X2 – X1) RoI = (83 – 63) / (15.5 – 6.5) 20 / 9 = 2.2 2.2 word correct gained on average per week")
59
(6, 63) (15, 83) X X Student SLOPE=2.2
 (15, 83) X X Student SLOPE=2.2")
60
Median point in 3 rd section minus the median point in 1 st section Divided by the number of data points minus one Slope = (74 – 62) / (16 – 5) 12 / 11 = 1.1 1.1 words correct gained on average per week
 / (16 – 5) 12 / 11 = 1.1 1.1 words correct gained on average per week")
61
(5, 62) (16, 74) X X
 (16, 74) X X")
62
PROSCONS Provides an RoI statistic Provides a degree of growth Can be compared to aimline or growth of typically performing peers Tukey “plus” does not consider all data points No empirical support for adding the statistic to the trendline Requires some math and knowledge of how to find the median

63
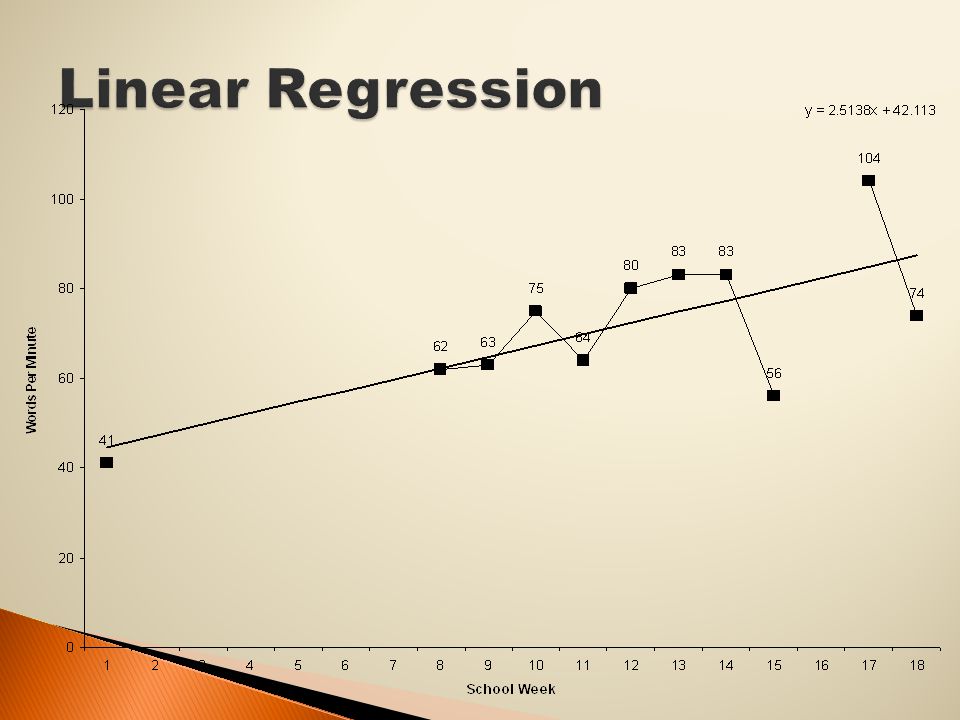
Used when there is some correlation between two types of data. ◦ In this case: words gained (skill) per week (time) Most common type of regression used is least squares A line of best fit is calculated and drawn through the data points The line of best fit is the line with the minimum amount of error between the data point and the line (vertical deviation)
 per week (time) Most common type of regression used is least squares A line of best fit is calculated and drawn through the data points The line of best fit is the line with the minimum amount of error between the data point and the line (vertical deviation).")
65
PROSCONS Considers all data points Provides an RoI statistic and trendline that can be compared to aimline and RoI of typically performing peers Researchers use it to measure growth of CBM! Requires software/ computer for calculations Time consuming Need several data points Influenced by outlier data points

66
Linear Regression Tukey Split Middle Last Minus First

67
Chart/Track Data PointsInterpret Trend Instructional DecisionNo Consistency!

68
MethodRate of Improvement Qualitative Methods? Last Minus First1.9 Tukey Method1.1 Split Middle2.2 Linear Regression2.5

69
MethodRoIAfter 18 Weeks Qualitative Methods ?? Last Minus First1.975.2 Tukey Method1.160.8 Split Middle2.280.6 Linear Regression 2.586

70
“Student’s daily test scores…were entered into a computer program. The data analysis program generated slopes of improvement for each level using an Ordinary Least Squares procedure (Hayes, 1973) and the line of best fit.” “This procedure has been demonstrated to represent CBM achievement data validly within individual treatment phases (Marston, 1988; Shinn, Good, & Stein, in press; Stein, 1987).” Shinn, Gleason, & Tindal (1989)
 and the line of best fit. This procedure has been demonstrated to represent CBM achievement data validly within individual treatment phases (Marston, 1988; Shinn, Good, & Stein, in press; Stein, 1987). Shinn, Gleason, & Tindal (1989).")
71
Christ, T. J. (2006). Short-term estimates of growth using curriculum based measurement of oral reading fluency: Estimating standard error of the slope to construct confidence intervals. School Psychology Review, 35, 128-133. Deno, S. L., Fuchs, L. S., Marston, D., & Shin, J. (2001). Using curriculum based measurement to establish growth standards for students with learning disabilities. School Psychology Review, 30, 507-524. Good, R. H. (1990). Forecasting accuracy of slope estimates for reading curriculum based measurement: Empirical evidence. Behavioral Assessment, 12, 179-193. Fuchs, L. S., Fuchs, D., Hamlett, C. L., Walz, L. & Germann, G. (1993). Formative evaluation of academic progress: How much growth can we expect? School Psychology Review, 22, 27-48.
. Using curriculum based measurement to establish growth standards for students with learning disabilities. School Psychology Review, 30, Good, R. H. (1990). Forecasting accuracy of slope estimates for reading curriculum based measurement: Empirical evidence. Behavioral Assessment, 12, Fuchs, L. S., Fuchs, D., Hamlett, C. L., Walz, L. & Germann, G. (1993). Formative evaluation of academic progress: How much growth can we expect. School Psychology Review, 22,")
72
Jenkins, J. R., Graff, J. J., & Miglioretti, D.L. (2009). Estimating reading growth using intermittent CBM progress monitoring. Exceptional Children, 75, 151- 163. Shinn, M. R., Gleason, M. M., & Tindal, G. (1989). Varying the difficulty of testing materials: Implications for curriculum-based measurement. The Journal of Special Education, 23, 223-233. Shinn, M. R., Good, R. H., & Stein, S. (1989). Summarizing trend in student achievement: A comparison of methods. School Psychology Review, 18, 356-370.
. Estimating reading growth using intermittent CBM progress monitoring. Exceptional Children, 75, Shinn, M. R., Gleason, M. M., & Tindal, G. (1989). Varying the difficulty of testing materials: Implications for curriculum-based measurement. The Journal of Special Education, 23, Shinn, M. R., Good, R. H., & Stein, S. (1989). Summarizing trend in student achievement: A comparison of methods. School Psychology Review, 18,")
73
Ease of application Focus on Yes/No to goal acquisition, not degree of growth How many of us want to calculate OLS Linear Regression formulas (or even remember how)?
")
74
If we are not all using the same model to compute RoI, we continue to have the same problems as past models, where under one approach a student meets SLD criteria, but under a different approach, the student does not. Without a consensus on how to compute RoI, we risk falling short of having technical adequacy within our model.

75
For Individual Students

76
Open Microsoft Excel I love RoI

77
Fall to Winter

78
In cell A1, type 3 rd Grade ORF In cell A2, type 1 st Semester In cell A3, type School Week In cell A4, type Benchmark In cell A5, type Student’s Name Boots

79
Starting with cell B3, type numbers 1 through 18 going across row 3 (horizontal). Numbers 1 through 18 represent the number of the school week. You will end with week 18 in cell S3.

80
Note: You may choose to enter a date for the school week across row 2 for easy identification. We leave out the week of Thanksgiving break and Winter Break

81
Our example is using DIBELS 6 th Ed. 3 rd Grade ORF Benchmarks. You would enter the benchmarks for fall and winter of whatever grade level for which you are graphing rate of improvement here. In cell B4, type 77 for the fall benchmark. In cell S4, type 92 for the winter benchmark.

82
Enter the following numbers, going across row 5, under the corresponding week numbers. Week 1 – 41 Week 8 – 62 Week 9 – 63 Week 10 – 75 Week 11 – 64 Week 12 – 80 Week 13 – 83 Week 14 – 83 Week 15 – 56 Week 17 – 104 Week 18 – 74

83
If a student was not assessed during a certain week, leave that cell blank Do not enter a score of zero (0) if a student wasn’t assessed during a certain week. The program will read the 0 as being a score (e.g., zero words correct per minute) and skew your trendline!
 and skew your trendline!.")
84
Highlight cells A4 and A5 through S4 and S5 Click Insert from your top row

85
Find the icon for Line

86
Click the arrow below it to show options

87
6 graphics appear for 2-D Line graphs Choose “Line with Markers”

88
Your graph will appear

89
To change your graph labels, click on your graph Your options appear in the top row Click on one of the Chart Layouts

90
Your chosen layout is applied to the graph By clicking on the labels (Chart Title, etc.) you can edit them Y-Axis is words per minute X-Axis is number of school weeks
 you can edit them Y-Axis is words per minute X-Axis is number of school weeks")
91
Right click (Mac – control click) on any of the student data points. From the drop-down menu that appears, click on “Add Trendline”

92
On that menu, choose “Linear” To label your trendline, choose “Custom” and type in RoI, or Boots’ Progress Further down on that menu, check the box next to “Display Equation on Chart”

93
Click on “Close” Your trendline should appear on your graph An equation will also appear on your graph You can relocate the trendline by clicking on it and dragging it to a new place

94
You can repeat the same procedure by clicking on one of the benchmark data points Suggestion: Label this trendline Typical RoI Move this equation under the first

95
Y=2.5138x +42.113 What does it mean? 2.513 is the average words per week the student is gaining based on the given data points 42.133 is where the trendline crosses the Y-Axis Y=0.8824x +76.118 0.8824 is the average words gained per week for typically performing peers in 3 rd grade for oral reading fluency

96
Discuss with your neighbor: ◦ How is this student progressing? ◦ What is the student’s RoI compared to the typical RoI?

97
To add additional data points to the graph (e.g., if you are doing ongoing monitoring) once you’ve already created the graph, simply enter those data in row 5 under the corresponding school week. You don’t have to re-create the graph each time you add a data point!

98
The typical RoI can change depending on where (which week) you enter the benchmark scores on your chart. Suggestion: Enter the benchmark scores based on when your school district completes their benchmark administration for the most accurate description of expected student progress.

99
Calculating Needed RoI Calculating Typical RoI Calculating Student RoI

100
Needed RoI ◦ The rate of improvement needed to close the achievement gap Typical RoI ◦ The rate of improvement of typically performing peers according to the norms Student RoI ◦ The actual rate of improvement at which the student is achieving based on available data points

101
In cell T3, type Needed RoI Click on cell T5 In the fx line at the top of the worksheet, type this formula =((S4-B5)/18) Then hit enter/return
/18) Then hit enter/return")
102
Your result in cell T5 should read: 2.833… This formula subtracts the student’s actual beginning of the year (BOY) benchmark from the expected middle of the year (MOY) benchmark, then divides by 18 for the first 18 weeks
 benchmark from the expected middle of the year (MOY) benchmark, then divides by 18 for the first 18 weeks")
103
In cell U3, type Typical RoI Click on cell U4 In the fx line at the top of the sheet, type this formula =SLOPE(B4:S4,B3:S3) Then hit enter
 Then hit enter")
104
Your result should read: 0.8825… This formula considers 18 weeks of growth according to the benchmark data – or – typical change (growth) expected per week in the target skill.
 expected per week in the target skill.")
105
Click on cell U5 In the fx line at the top of your sheet, type this formula =SLOPE(B5:S5,B3:S3) Then hit enter
 Then hit enter")
106
Your result should read: 2.5137… This formula considers 18 weeks of student data (as long as you have a few data points) and provides an average growth or change in skill acquisition per week.
 and provides an average growth or change in skill acquisition per week.")
107
Operationalizing Adequate & Inadequate Growth

108
1. Gather the data 2. Ground the data & set goals 3. Interpret the data

109
Universal Screening Progress Monitoring

110
Screening Tools Chart ◦ http://www.rti4success.org/screeningTools http://www.rti4success.org/screeningTools Progress Monitoring Tools Chart ◦ http://www.rti4success.org/progressMonitoringTools http://www.rti4success.org/progressMonitoringTools

111
1) To what will we compare our student growth data? 2) How will we set goals?
 To what will we compare our student growth data 2) How will we set goals")
112
Fuchs et. al. (1993) Table of Realistic and Ambitious Growth Needed Growth Expected Growth & Percent of Expected Growth Growth Toward Individual Goal* *Best Practices in Setting Progress Monitoring Goals for Academic Skill Improvement (Shapiro, 2008)
 Table of Realistic and Ambitious Growth Needed Growth Expected Growth & Percent of Expected Growth Growth Toward Individual Goal* *Best Practices in Setting Progress Monitoring Goals for Academic Skill Improvement (Shapiro, 2008).")
113
Fuchs, Fuchs, Hamlett, Walz, & Germann (1993) Realistic Growth Ambitious Growth 1 st 2.03.0 2 nd 1.52.0 3 rd 1.01.5 4 th 0.91.1 5 th 0.50.8
 Realistic Growth Ambitious Growth 1 st nd rd th th")
114
Fuchs, Fuchs, Hamlett, Walz, & Germann (1993) Realistic Growth Ambitious Growth 1 st 0.30.5 2 nd 0.30.5 3 rd 0.30.5 4 th 0.751.2 5 th 0.751.2
 Realistic Growth Ambitious Growth 1 st nd rd th th")
115
Difference between student’s BOY (or MOY) score and benchmark score at MOY (or EOY). Example: MOY ORF = 10, EOY benchmark is 40, 18 weeks of instruction (40-10/18=1.67). Student must gain 1.67 wcpm per week to make EOY benchmark.
. Student must gain 1.67 wcpm per week to make EOY benchmark..")
116
Difference between two benchmarks. Example: MOY benchmark is 20, EOY benchmark is 40, expected growth (40-20)/18 weeks of instruction = 1.11 wcpm per week.
/18 weeks of instruction = 1.11 wcpm per week..")
117
Tigard-Tualatin School District (www.ttsd.k12.or.us) Tier ITier IITier III Greater than 150% Between 110% & 150% Possible LD Between 95% & 110% Likely LD Between 80% & 95% May Need More Likely LD Below 80%Needs More Likely LD

118
Appears to be a theoretical convergence on use of local criteria (what scores do our students need to have a high probability of proficiency?) when possible.
 when possible.")
119
Use norms that accompany the measure (DIBELS, AIMSweb, etc.). Use national norms.
. Use national norms.")
120
Research has yet to establish a blue print for ‘grounding’ student RoI data. At this point, teams should consider multiple comparisons when planning and making decisions.

121
When tracking on grade level, consider an RoI that is 100% of expected growth as a minimum requirement, consider an RoI that is at or above the needed as optimal. So, 100% of expected and on par with needed become the limits of the range within a student should be achieving.

125
http://rateofimprovement.com/roi/ http://rateofimprovement.com/roi/ ◦ Click on Downloads Update dates and benchmarks. Enter names and benchmark/progress monitoring data.

127
Independent/Instructional/Frustrational Instructional often b/w 40 th or 50 th percentile and 25 th percentile. Frustrational level below the 25 th percentile. AIMSweb: Survey Level Assessment (SLA).
..")
128
100% of expected growth not enough. Needed growth only gets to instructional level benchmark, not grade level. Risk of not being ambitious enough. Plenty of ideas, but limited research regarding Best Practice in goal setting off of grade level.

129
Weekly probe at instructional level for sensitive indicator of growth. Monthly probes (give 3, not just 1) at grade level to compute RoI. Goal based on grade level growth (more than 100% of expected).
 at grade level to compute RoI. Goal based on grade level growth (more than 100% of expected)..")
131
When to make a change in instruction and intervention? When to consider SLD?

132
Enough data points (6 to 10)? Less than 100% of expected growth. Not on track to make benchmark (needed growth). Not on track to reach individual goal.
. Not on track to reach individual goal..")
133
Continued inadequate response despite: Fidelity with Tier I instruction and Tier II/III intervention. Multiple attempts at intervention. Individualized Problem-Solving approach. Evidence of dual discrepancy…

135
Addressing the “Much to be Done” Meaningfulness of Curvilinear Growth Non-CBM data

136
Caitlin S. Flinn ◦ caitlinflinn@rateofimprovement.com caitlinflinn@rateofimprovement.com Andy McCrea ◦ ammcrea@ldsd.org ammcrea@ldsd.org Web Site: Downloads & Info ◦ www.rateofimprovement.com www.rateofimprovement.com

Similar presentations