Download presentation
Presentation is loading. Please wait.

1
Thoughts on the bat research and monitoring program at Fort Drum, NY
Chris Dobony, Fort Drum Military Installation, Fort Drum, NY David Jachowski, Clemson University, Clemson SC Eric Britzke, U.S. Army Engineer Research Development Center, Vicksburg, MS John Edwards, West Virginia University, Morgantown, WV Joshua Johnson, Pennsylvania Game Commission, Phillipsburg, PA Laci Coleman, Ecotech Inc., Marietta, GA W. Mark Ford, U.S. Geological Survey, Blacksburg, VA Jane Rodrigue, U.S. Forest Service, Northern Research Station, Princeton, WV

2
MIST NET SAMPLING MISTNET SURVEY LOCATIONS 2007 - 2011
JUN – AUG 2007 = 41 SURVEY LOCATIONS JUL – AUG 2008 = 85 SURVEY LOCATIONS JUN – AUG 2009 = 86 SURVEY LOCATIONS JUN – AUG 2010

3
MIST NET RESULTS MYOTIS 2007 (n = 81) 2008 (n = 41) 2009 (n = 85) 2010
2011 (n = 60)* Little Brown Myotis 440 (5.43) 104 (2.54) 35 (0.41) 51 (0.6) 15 (0.25) Northern Myotis 260 (3.21) 37 (0.90) 5 (0.06) 1 (0.02) Indiana Myotis 18 2 1 Small-footed Myotis * 30 Sites Repeated Twice
* Little Brown Myotis. 440 (5.43) 104 (2.54) 35 (0.41) 51 (0.6) 15 (0.25) Northern Myotis. 260 (3.21) 37 (0.90) 5 (0.06) 1 (0.02) Indiana Myotis Small-footed Myotis. * 30 Sites Repeated Twice.")
4
Indiana bat foraging ecology
Introduction 1. Monitoring 2. Indiana bat 3. White-nose Jachowski, D.S., J.B. Johnson, C.A. Dobony, J.W. Edwards and W.M. Ford Space Use and Resource Selection by Foraging Indiana Bats at Their Northern Distribution. Endangered Species Management 24: 149–157. Future research

5
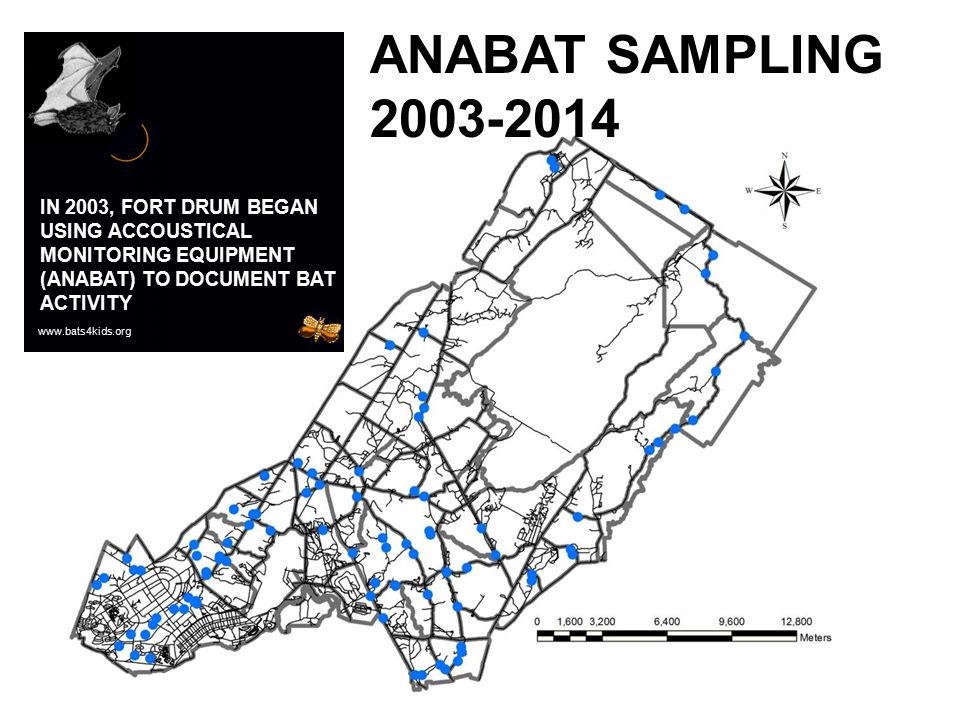
ANABAT SAMPLING IN 2003, FORT DRUM BEGAN USING ACCOUSTICAL MONITORING EQUIPMENT (ANABAT) TO DOCUMENT BAT ACTIVITY
6
ANABAT RESULTS SPECIES YEAR EPFU LABO LACI LANO MYLE MYLU MYSE MYSO
PEMY NOID ∑ X 2004 n= 229 1138 4.97 945 4.13 640 2.79 90 0.39 1 0.004 2910 12.71 178 0.78 365 1.59 84 0.37 1158 5.06 7509 32.79 2009 n= 259 652 2.52 383 1.48 402 1.55 384 15 0.06 501 1.93 13 0.05 60 0.23 192 0.74 1461 5.64 4063 15.69 2005 n= 297 318 1.07 717 2.41 545 1.84 24 0.08 3 0.01 3561 11.99 200 0.67 947 3.19 9 0.03 726 2.44 7050 23.74 2010 n= 574 600 1.05 183 0.32 176 0.31 262 0.46 32 144 0.25 7 40 0.07 18 2238 3.90 3700 6.45 YEAR CALLS/HR

7
Introduction 1. Monitoring 2. Indiana bat Next was determination of ideal passive arrays to capture Indiana bat and Little brown bat, i.e., transects, double-sites, grids – all to relate to using occupancy analyses to examine trends. 3. White-nose Future research

8
Introduction 1. Monitoring 2. Indiana bat Two points here. Note the absolute drop in activity pre- vs post- and note the direction of the line. Bat #’s should increase from May-June to July-Aug when new bats are volant. They did pre-WNS, but do not post-WNS, indicating that while there is survival, recruitment is not occuring 3. White-nose Future research

9
Introduction 1. Monitoring 2. Indiana bat For example, here with the little brown bat, Myotis lucifugus, we see a dramatic decline in activity in the years of monitoring post-WNS. Particularly notice this distinct peak in activity by MYLU in the early morning hours. Rather than just a decline in activity post-WNS and similar trend in temporal behavior, that peak is completely absent post-WNS. 3. White-nose Future research

10
Introduction 1. Monitoring 2. Indiana bat For some species like the rare Indiana bat that were historically active throughout the night, the few remaining bats post-WNS may be switching to being early evening specialists. This suggests that niche partitioning may be relaxed temporally - potentially due to a lack of competition with MYLU that formerly dominated that time period in the evening. 3. White-nose Jachowski, D.S., C.A. Dobony, L.S. Coleman, W.M. Ford, E.R. Britzke, and J.L. Rodrigue Disease and community structure: white-nose syndrome alters spatial and temporal niche partitioning in sympatric bat species. Diversity and Distributions 20: 29. Future research

11
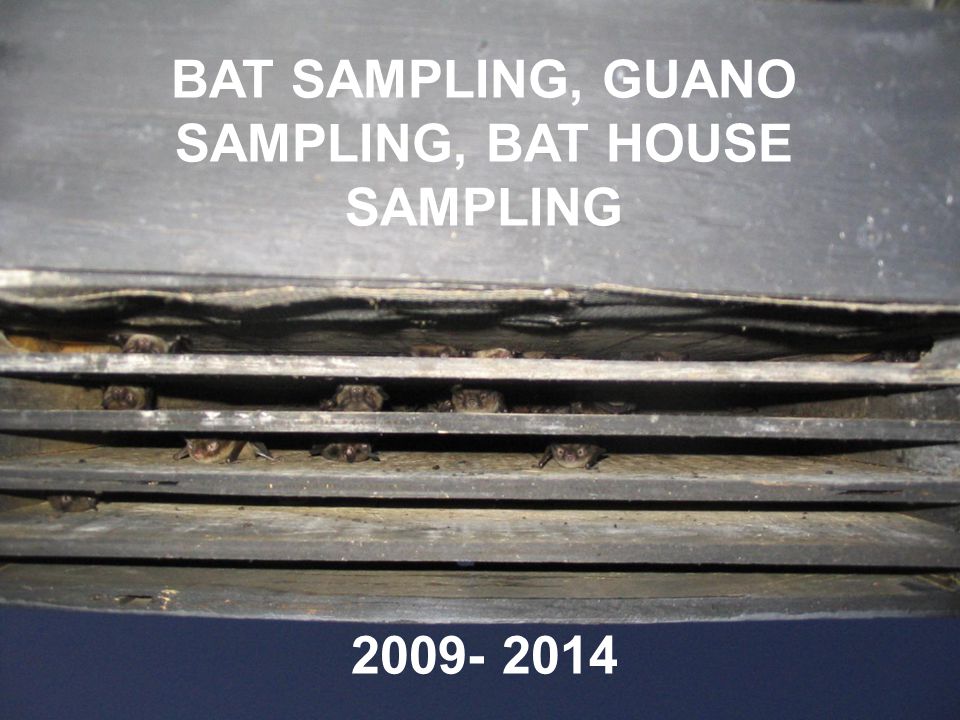
BAT SAMPLING, GUANO SAMPLING, BAT HOUSE SAMPLING
12
Introduction 1. Monitoring 2. Indiana bat Large little brown bat colony in artificial structure became a primary focus. Pre-WNS, colony of > 1000 bats. Now probably 100, but still largest remaining for most of NY and New England. 3. White-nose Future research

13
FORT DRUM LITTLE BROWN BAT MATERNITY COLONY
Introduction YEAR # BATS REPRO RATE Pre-volant Post-volant 2006 -- 1,144 2007 2008 1,200 2009 243 345 42% 2010 104 155 49% 2011 99 158 60% 2012 101 169 67% 2013 96 2014 95 185 95% 1. Monitoring 2. Indiana bat 3. White-nose Future research

14
JUVENILE SURVIVAL 2009 - 2013: 1 Recapture 2009 - 2014: 1 Recapture
: 3 Recaptures : 1 Recaptures : 4 Recaptures : 3 Recaptures : 6 Recaptures : 9 Recaptures 13 juveniles survived multiple years

15
Pd detected from swabs, culture, and/ or guano from bats in the bat house in April, May, June, July, and August of 2009 and/ or 2010. Pd detected from swabs taken from bat house in March and September of 2011. Pd detected from swabs taken from bat house in March, April, May, June, July, August, September, October, November of 2013

16
Introduction 1. Monitoring 2. Indiana bat Immediately used to look at rate bats at this northern latitude go into torpor in the summer which might contribute to 3. White-nose Future research Britzke, E.R and C.A. Dobony (in prep). Could summer torpor be a factor in White-nose Syndrome? U.S. Army Engineer Research and Development Center Tech Note. Vicksburg, MS.
. Could summer torpor be a factor in White-nose Syndrome U.S. Army Engineer Research and Development Center Tech Note. Vicksburg, MS.")
Similar presentations


 pantry survey found that.>")


 patients Policy.>")
