Download presentation
Presentation is loading. Please wait.

2
ECG DIAGNOSIS OF ISCHEMIC VT
BY SAID FAWZY ASSISSTENT LECTURER OF CARDIOLOGY BENHA UNIVERSITY

3
Disclosures None

4
Do you think that it is important to have a 12 lead ECG recording of VT before starting VT ablation procedure ? YES NO IT DEPENDS

5
ECG is very specific tool for localizing VT foci or reentry circuit exit sites ?
AGREE DO NOT AGREE IT DEPENDS

6
Clinical or inducible non clinical VT ?!

7
Possible VT mechanisms in ischemic patients
Scar related reentrant VTs (most common). Focal VTs (including those originating from the papillary muscles). Fascicular VTs (inter-fascicular) BBR VT
. Focal VTs (including those originating from the papillary muscles). Fascicular VTs (inter-fascicular) BBR VT.")
8
What do we expect from the ECG ?
Localize or at least Regionalize the focus or the exit site. The possible mechanism of the tachycardia. Is it endocardial or Epicardial

9
Limitations of the ECG as a mapping tool
The presence and the extent of infarction. The degree of intra-myocardial fibrosis. The shape of the heart and its position in the chest . Influence of non-uniform anisotropy in affecting propagation from tachy site.

10
Continue…Limitations
Effect of acute ischemia,drugs,and metabolic abnormalities on conduction. Integrity of the His-Purkinje system. Presence of increased myocardial mass

11
What we are searching for ?
QRS initial forces QRS amplitude QRS width QRS frontal plane axis BBB pattern Concordance The presnece of QR complexes.

12
QRS initial forces Rapid initial forces>>> More likely arising from normal myocardium Slurred initial forces (pseudodelta wave )>>> More likely from a scar or from epicardium
>>> More likely from a scar or from epicardium.")
13
QRS amplitude Usually VTs arising from diseased myocardium have lower QRS amplitudes from those arising from normal myocardium

14
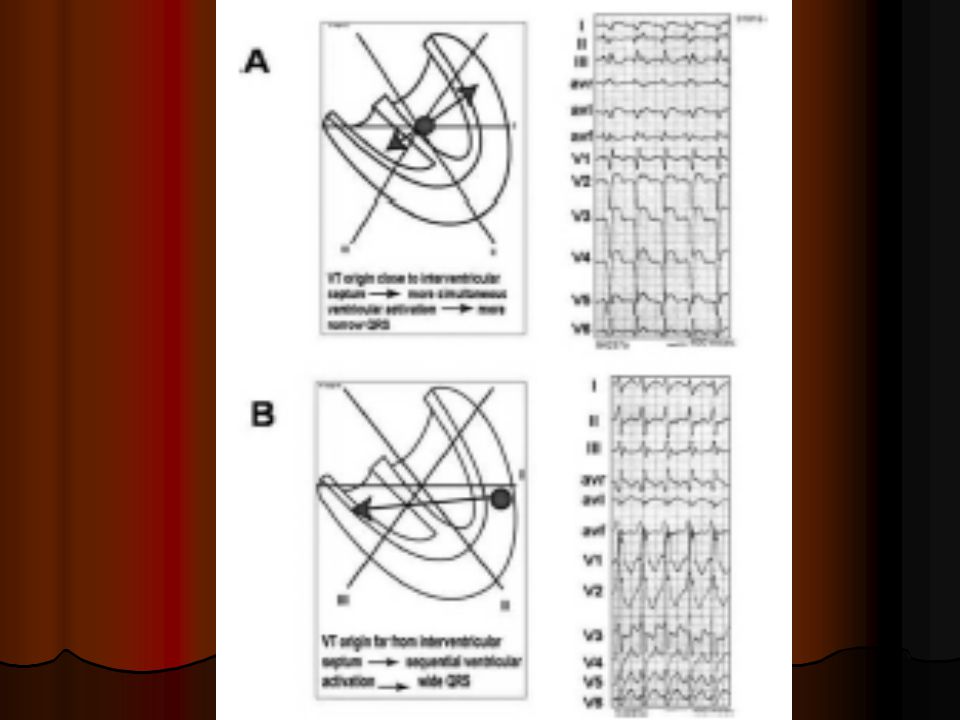
QRS width Free wall VTs > Septal VTs ( assuming conduction in all directions is equal ) Epicardial VTs > Endocardial VTs
 Epicardial VTs > Endocardial VTs.")
16
QRS frontal plane axis Superior axis >>> apical site (septal or lateral ) or inferior wall VTs Inferior axis>>> basal , outflow tract,high septal or latral wall of LV.

17
Concordance Positive concordance>>> Basal sites
Negative concordance>>> Apical ( mainly apical septum and most commonly seen with anteroseptal infarctions )
")
19
BBB pattern RBBBR pattern>>> VT certainly from LV
LBBB pattern>>> VT from LV septum or the right side of the septum

20
Presence of QS complexes
QS complexes in the inferior leads>>> Activation start at the inferior wall ! QS complexes in precordial leads>>> Activation is going away from the anterior wall.

23
Just to rememeber

24
Basic roles in post MI VTs
Almost all VTs arise in the LV or IVS ECG looses a lot of its ability to precisely localize VT origin or exit sites Accuracy of the ECG in anterior MI (greater myocardial damage)patients is much less than in inferior MI.
patients is much less than in inferior MI.")
25
Continue…Basic roles It is extremely rare for an inferior MI dependent VT to have an exit site at the higher septum close to the aortic valve QS complexes in the lateral leads (V4-V6) reflect origin near the apex ( septal or lateral ) Almost impossible to distinguish VTs coming from apical septum and apical free wall based on ECG alone
 reflect origin near the apex ( septal or lateral ) Almost impossible to distinguish VTs coming from apical septum and apical free wall based on ECG alone.")
26
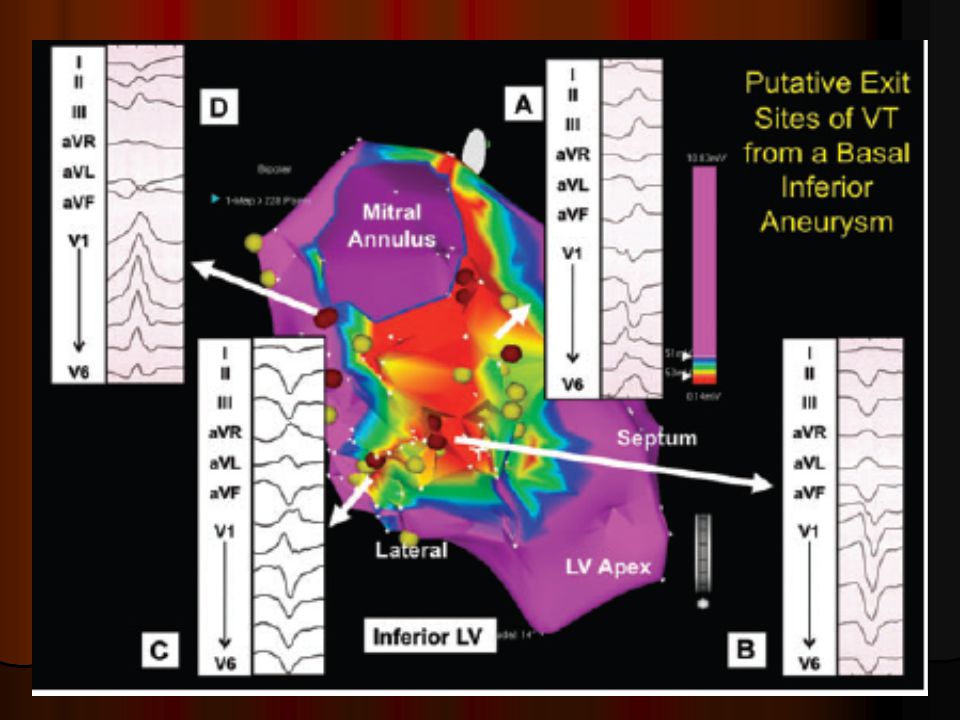
Inferior infarction VT
Activation goes from back to front>> large R wave in the precordial leads starting from V2 LBBB VT in inferior MI >> mainly basal septum (inferobasal septum with left axis and higher septal with normal axis).
.")
28
Anterior infarction VT
The situation becomes more complicated with less accuracy of the ECG (more myocardial damage). LBBB VT or RBBB VT can occur LBBB VT and LAD is associated usually with inferoapical septal region.It can present with negative concordance and always associated with Q wave in I and aVL
. LBBB VT or RBBB VT can occur. LBBB VT and LAD is associated usually with inferoapical septal region.It can present with negative concordance and always associated with Q wave in I and aVL.")
29
R wave in V1 and Q in aVL indicates more posterior position on the septum
RBBB VT usually shows superior axis. V1 can show monophasic R or qR pattern with QS from V2-V4 or up to V6

31
Endocadial or Epicardial VT ?
Can the ECG alone answer this Q ?

32
The answer is simply NO

33
What is epicardial VT ? VTs in which the origin or the critical sites of the reentrant circuit are located in the subepicardial tissue as suggested by entrainment maneuvers and/or termination withen 10 seconds of standard RF pulses. Critical epicardial sites may be entained or interrupted from both the epicardial and endocardial surfaces making it difficult to demonstrate the presence of a truly epicardial circuit in a given case

34
Limitations Most of the adopted ECG criteria to predict Epicardial foci or exit sites have been described in patients with NICM and idiopathic VTs . Even VTs with presumed epicardial exit sites can be still ablated from the endocardial approach (The entrance or the central isthmus). No ECG features distinguished outflow tract epicardial exit sites. Poor sensitivity and specificty.
. No ECG features distinguished outflow tract epicardial exit sites. Poor sensitivity and specificty.")
35
Suggested ECG criteria

36
1-Total QRS duration QRS more than 198 ms has 86% specificity and 69% sensitivity for epicardial origin of VT.

37
2-Pseudo delta wave Earliest ventricular actiavation to the fastest delection an any precordial lead Pdw >34 ms has 80% sensitivity and specificty

38
3-Intrinscoid deflection time
ID from the earlist ventricular activation to the nadir of the first S wave in any precordial lead . ID more than 97 ms has 80% specificity and 50% sensitivity for epicardial VT origin.

39
4-RS duration RS from the earliest ventricular activation to the peak of R wave in lead V2 RS >121 ms is 82% specific and 57% sensitive for epicardial VT

40
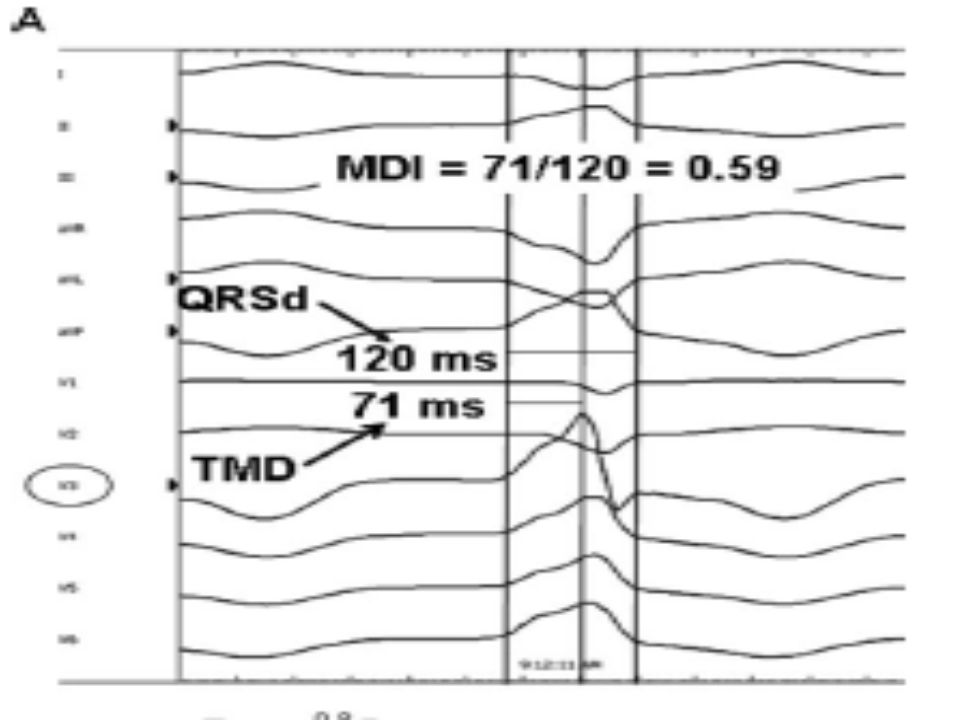
5-Maximum Deflection Index ( MDI)
It is defined as the shortest time to maximum positive or negative deflection in any precordial lead divided by the QRS duration. A cut-off value of 0.55 has high sensitivity (100%) and specificity (98%) for epicardial VT. This was mainly adopted for epicardial VTs arising from sinuses of Valsalva.
 and specificity (98%) for epicardial VT. This was mainly adopted for epicardial VTs arising from sinuses of Valsalva.")
42
6-Precordial pattern break (R wave regression progression)
This was mainly described by Marchilinski group in Pheladelphia and was in the context of idiopathic VTs (but may still work). There is a brupt loss of R wave in V2 followed by a resumption in R waves from V3 to V6. Unkown predictive value.
. There is a brupt loss of R wave in V2 followed by a resumption in R waves from V3 to V6. Unkown predictive value.")
44
7-Regional Q waves

45
Again….Remember Even with the presence of all of the above mentioned criteria, the ECG is not predictive for epicardial access and mapping . Endocardial mapping should be commenced at first for all cases The role of the above mentioned criteria in post MI patients has no strong evidence.

46
Post MI VTs from papillary muscles
When to suspect ?

47
ECG…nothing specific

48
Gadolinium enhanced MRI

49
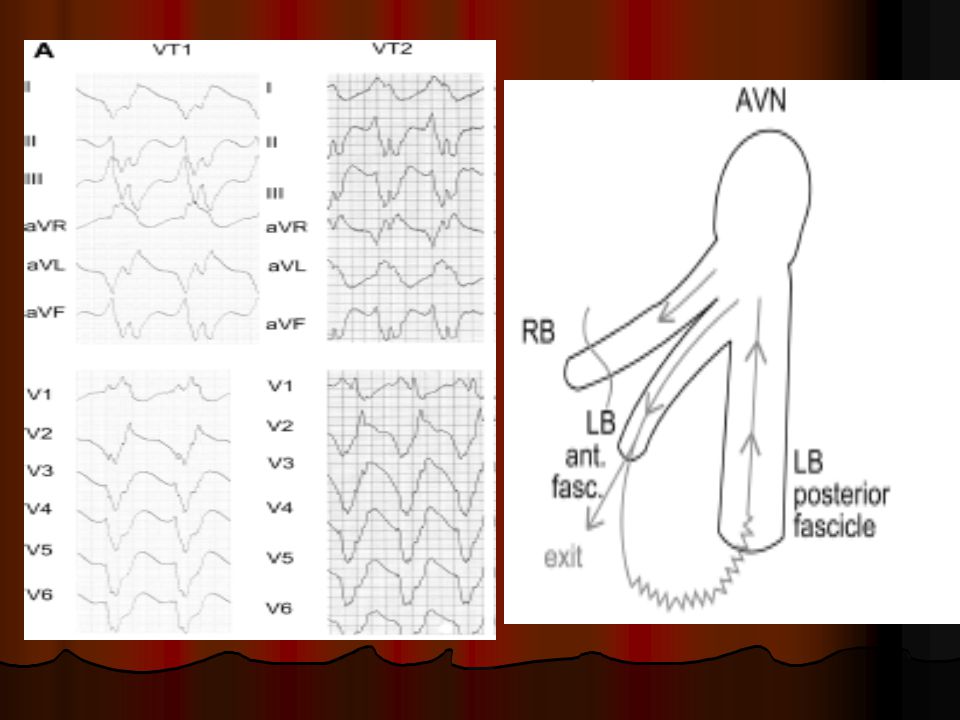
BBR VT More common in patients with NIDCM.
Its incidence is propably underestimated. Should be considered in DD specially if there is ECG evidence of His Purkinje disease

50
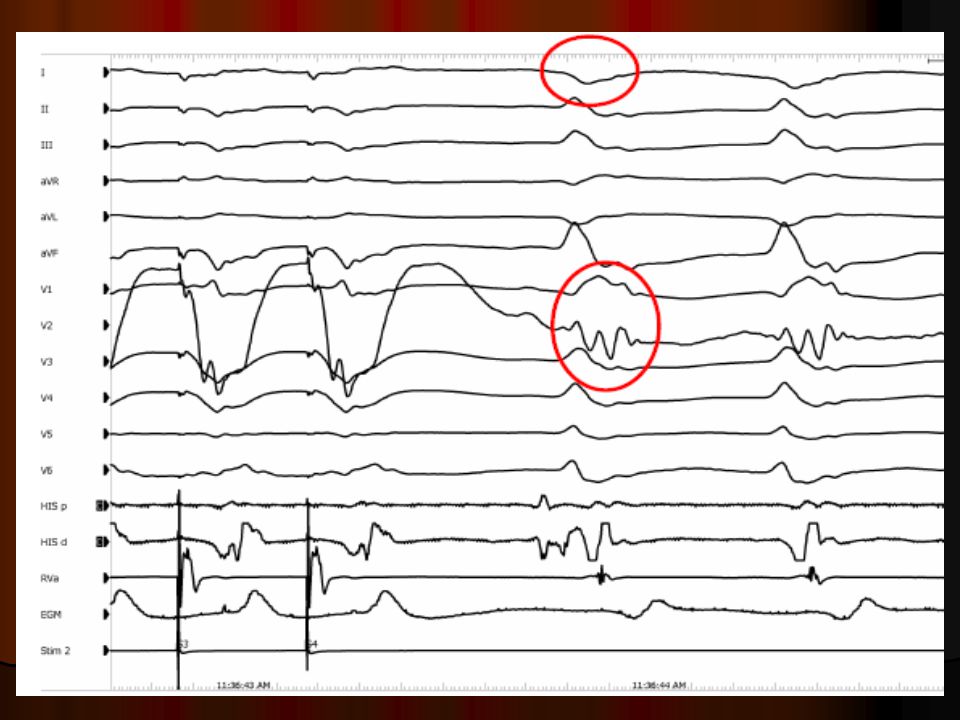
Typical and Atypical BBR VT.

51
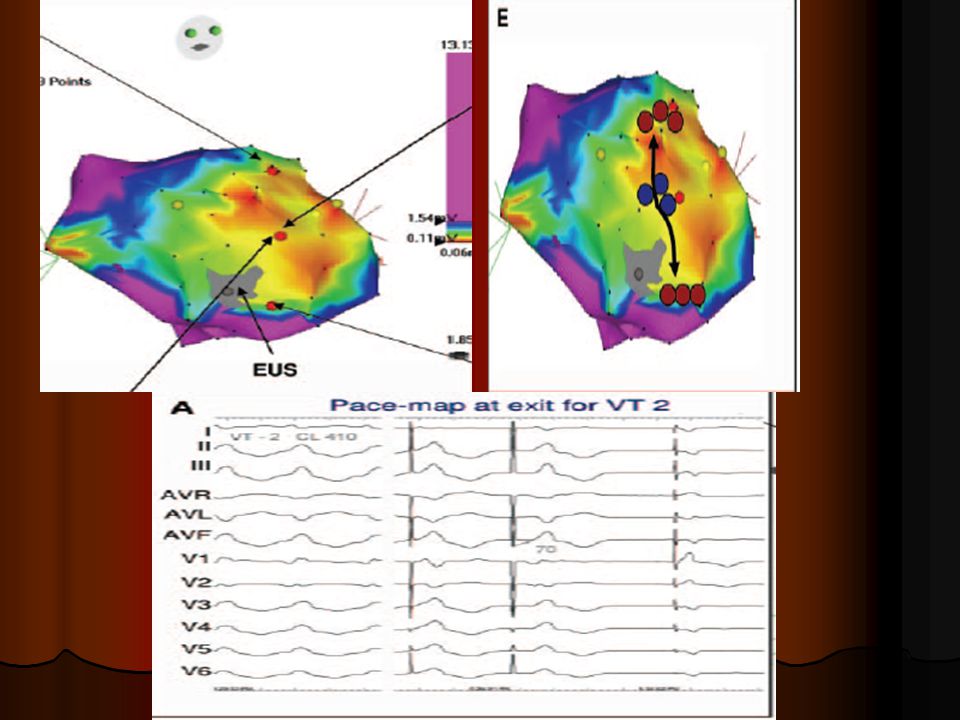
VT involving the left purkinje system
When to suspect ?

54
Conclusion Different VT mechanisms are involved in patients with IHD
ECG, inspite of limitations, is a useful tool in localizing or at least regionalizing the exit sites of VTs in post MI patients. ECG has poorer predictive value in patients with anterior infarction than those with inferior MI Different ECG criteria can support epicarial focus or exit site but this does not necessarily indicate the successful ablation site. Finally,it is mapping and not the ECG that determine where you have to ablate

55
THANK YOU

Similar presentations