Download presentation
Presentation is loading. Please wait.

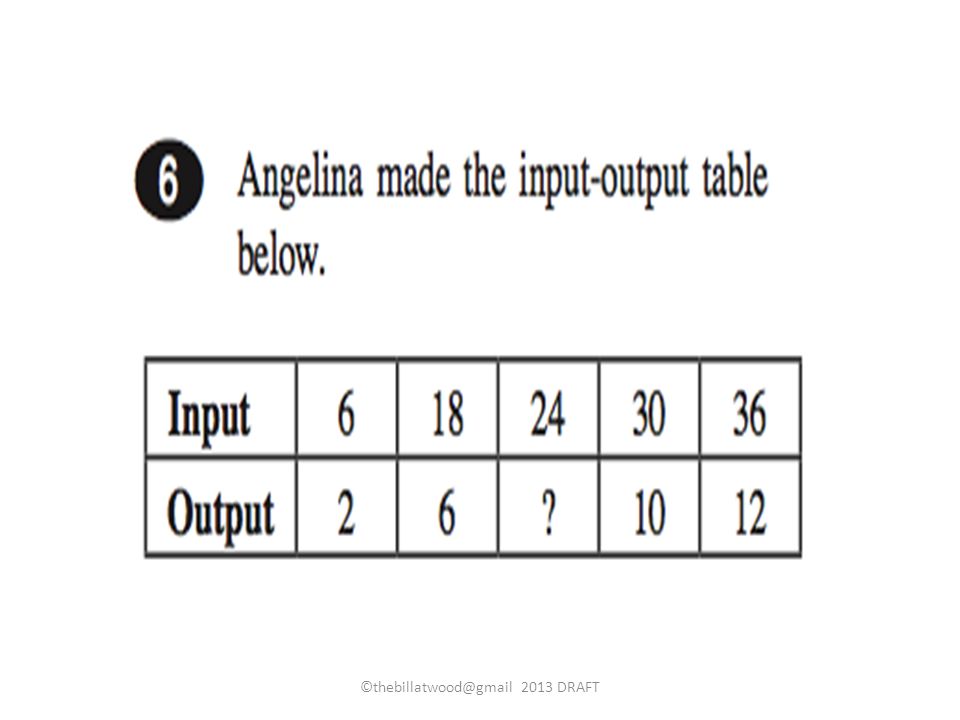
1
Using Graphics in the Math Classroom GRADE 8 ©thebillatwood@gmail 2013 DRAFT1

2
Problem solving often invokes an image of a chess player thinking for hours trying to find the right move, or inventors like the Wright brothers gazing at the birds and waiting for some spectacular, clarifying moment that will solve the problem of flight. In fact, problem solving does not usually involve some brilliant insight that arrives after hours of thinking. Most often, problem solving is a product of experience and memory. Problem Solving ©thebillatwood@gmail 2013 DRAFT2

3
Think of a problem you solved recently. Maybe you had to change a flat tire in a new car, book a reservation on an unfamiliar website, or set a new watch to daylight savings time. Chances are that you solved the problem by remembering a similar experience that would give you clues to how to solve the problem. ©thebillatwood@gmail 2013 DRAFT3

4
You might argue, if remembering is all you are doing then you are not facing a true problem. However, most problems we face arent true problems the likes of which we have never seen, but just a tweak of a problem weve seen before. The trick is to recognize the problem as similar to one youve seen before and remember the experience of solving it. ©thebillatwood@gmail 2013 DRAFT4

5
According to the Common Core State Standards in math, students are expected to be able to persevere in problem solving. Why dont students persevere? It may be that the problems seem too difficult. Students look at a problem and give up because they dont see the problem as similar to one they have solved before. These graphics are meant to address this issue by exposing students to a variety of problems. ©thebillatwood@gmail 2013 DRAFT5

6
You can use these graphics in a variety of ways (see slides 12 and 13). But, begin by showing a graphic and asking students simple questions like: 1.What do you notice or know about this graphic? What is this problem about? 2.What vocabulary is related? 3.What questions do you expect to be asked? 4.What kinds of errors should you watch out for? ©thebillatwood@gmail 2013 DRAFT6

7
Next, ask low and high level questions about the graphics that simulate the kinds of rich and complex problems students will be expected to solve. You can focus more on process than computation: Describe how would you solve this… ©thebillatwood@gmail 2013 DRAFT7

8
You are using these graphics as a tool to introduce and review concepts from previous study. Remember, the more times students have seen and solved problems like these, the greater their bank of experiences, the better they will be able to persevere in solving problems. ©thebillatwood@gmail 2013 DRAFT8

9
Six Benefits to Using the Graphics 1.Students become familiar with the common graphics in math and feel less intimidated and frustrated by them. 1.Students begin to see patterns among problems and recognize new problems as similar to ones they have solved before. 1.Students learn to focus on the key information in a problem before solving it. ©thebillatwood@gmail 2013 DRAFT9

10
10 Six Benefits Continued 4. Students review and recall key vocabulary and concepts from previous instruction. 5. Students learn to break down problems by focusing on a small part or important sub-step. 6. Students verbally rehearse describing the steps of problem solving: What do I know? What do I need to find? I must clearly describe and label my steps and my answer. I must check it.

11
Many graphics developed by Massachusetts Dept. of Education and/or Smarter Balanced and PARCC and have appeared on publically released tests or items. Concerning Alignment to the Common Core These graphics are not yet perfectly aligned to the new Common Core Standards. Since math, like any language, requires recall from earlier years, many concepts are repeated here. This may help student review critical ideas and allow you to build on them. ©thebillatwood@gmail 2013 DRAFT11

12
Five Ways to Use the Graphics 1.Flash graphics onto a screen and pepper students with questions. (See guidelines for pepper, slide 14) Use the sample slides (19-25) to give you an idea of the kinds of questions you might ask. 1. If students are nervous, allow them to quickly confer in two person groups before answering. 1. Have all students respond on white board. Or with a hand-signal for multiple choice, true false, or answers with a number. ©thebillatwood@gmail 2013 DRAFT12
 Use the sample slides (19-25) to give you an idea of the kinds of questions you might ask. 1. If students are nervous, allow them to quickly confer in two person groups before answering. 1. Have all students respond on white board. Or with a hand-signal for multiple choice, true false, or answers with a number DRAFT12.")
13
©thebillatwood@gmail 2013 DRAFT13 Five Ways to Use the Graphics Continued 4. Use the graphics as a quick written brainstorm (Type One) or quick quiz (Type Two). Ask: a. List 4+ pieces of information you know or notice. b. List 5+ vocabulary words related to this. c. List 3+ questions that will likely be asked. d. Describe 2+ mistakes to avoid. e.Describe the method to find the answer. 5.After practicing with these, use the Student-to- Student Pepper Cards (see www.collinsed.com) to have students practice by themselves or with partner.
 or quick quiz (Type Two). Ask: a. List 4+ pieces of information you know or notice. b. List 5+ vocabulary words related to this. c. List 3+ questions that will likely be asked. d. Describe 2+ mistakes to avoid. e.Describe the method to find the answer. 5.After practicing with these, use the Student-to- Student Pepper Cards (see to have students practice by themselves or with partner..")
14
©thebillatwood@gmail 2013 DRAFT Guidelines for Peppering Students The idea of peppering students comes from a baseball drill. A player stands a few feet away from a pitcher who tosses soft pitches. The batter repeatedly taps back to the pitcher. The goal is to get many hitting repetitions in a short amount of time. The academic game is explained in Teach Like Champion by Doug Lemov. (See the video on youtube http://www.youtube.com/watch?v=PARfIwF215k.) Here are 4 important points to remember: 1.Explain to students why you are playing. Explain that you are calling on everyone without hands raised. You are not not trying to embarrass, but only to get everyone a lot of at bats. 2.Remind students, there is no hand-raising. Students should be trying to answer every question in their heads. 3.Remember the format: Ask a question, pause, then call on a student. Mix your pace from quick to slow. Dont get too excited by correct answers. 4.If students dont know an answer they can say, I need help. This is not a big deal. Other students can now raise their hand and give the answer. Go back to the student and repeat the same question.
 Here are 4 important points to remember: 1.Explain to students why you are playing. Explain that you are calling on everyone without hands raised. You are not not trying to embarrass, but only to get everyone a lot of at bats. 2.Remind students, there is no hand-raising. Students should be trying to answer every question in their heads. 3.Remember the format: Ask a question, pause, then call on a student. Mix your pace from quick to slow. Dont get too excited by correct answers. 4.If students dont know an answer they can say, I need help. This is not a big deal. Other students can now raise their hand and give the answer. Go back to the student and repeat the same question..")
15
The following slides offer sample of the kinds of oral questions you might ask. Remember, you do not have to ask all of the questions These are just samples of question types. Mix up higher level and lower level questions. Remember, a geometry question can become a fraction question with a little skill. What fraction of these lines are parallel? My favorites question types include: 1.Who and what is it about? What do you know or notice? 2.What math words go with this? 3.What question might be asked? What might you need to find? 4.How do you solve this kind of problem? Describe the steps. 5.What mistakes will be made? How would you check it? 6.Ask a what if or a go backwards question. (What if you wanted to design a garden with double the area? With this area, what are the dimensions?) 7.Generalize or use variables. Can you describe a pattern to solve for any situation? Perimeter of a regular hexagon is 12x + 18, what are sides? 8.Try to mix math strands: Use geometry with algebra and percent with measurement. Always ask for units. 90 what? 90 degrees. ©thebillatwood@gmfail 2013 DRAFT15
 7.Generalize or use variables. Can you describe a pattern to solve for any situation. Perimeter of a regular hexagon is 12x + 18, what are sides. 8.Try to mix math strands: Use geometry with algebra and percent with measurement. Always ask for units. 90 what. 90 degrees DRAFT15.")
16
©thebillatwood@gmail 2013 DRAFT16 Elementary Examples

17
©thebillatwood@gmail 2013 DRAFT17

18
What are 5 math terms related to this picture? Which letters shows parallel lines ? What how would you describe the lines above letter L? What kind of an angle is formed at Letter O? How many degrees? If you wanted to make a parallelogram which lines would you push together? What fraction of these lines are intersecting? What is the ratio of parallel lines to perpendicular lines? What is an example of parallel lines in real life? ©thebillatwood@gmail 2013 DRAFT18

19
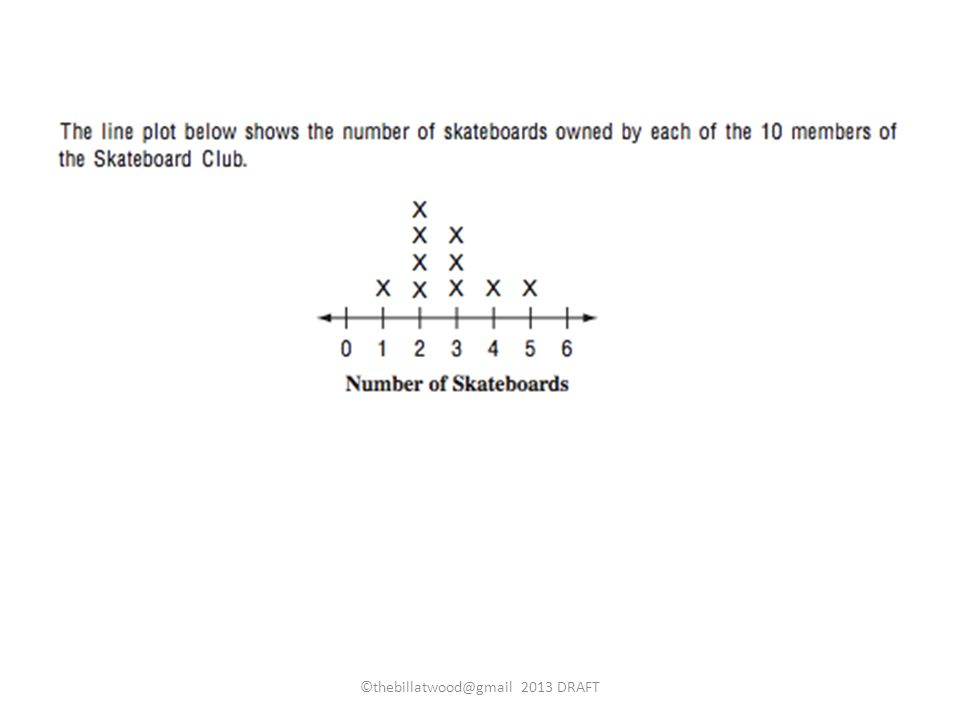
What kind of graph is this? What is this graph showing? How many plants were sold Week 2? On what day were 30 plants sold? How many more plants were on Week 2 and Week 1? A student said there were 21 plants sold on Week 3. What mistake is he making? What are three questions that will be asked? What if students wanted to sell 200 plants, how many would they need to sell in Week 5? How would you solve this problem? ©thebillatwood@gmail 2013 DRAFT19

20
4,305 Read this number in words. Express this number in expanded form. Round this number to nearest thousand? Explain. Odd? Even? Multiple of five? Divisible by three? Explain. What if you changed the 3 to a 6 how would the value change? Rearrange these digits and make the largest number possible. Smallest? How far away from 10,000 is this number? Use the distributive property to double this number. Triple it. Multiply this number 10. Divide it by 10.. ©thebillatwood@gmail 2013 DRAFT20

21
Middle and High School Examples ©thebillatwood@gmail 2013 DRAFT21

22
What is this showing? What are 4+ related vocabulary words? What 3+ questions will be asked? How do you find the slope? What is the slope of this line? What are coordinates of y-intercept? Estimate coordinates of x intercept… Slope of this line is 1/3. What is slope of a line perpendicular to this one? Why? Y = 3x + 4. Is this the correct equation? Why not? ©thebillatwood@gmail 2013 DRAFT22

23
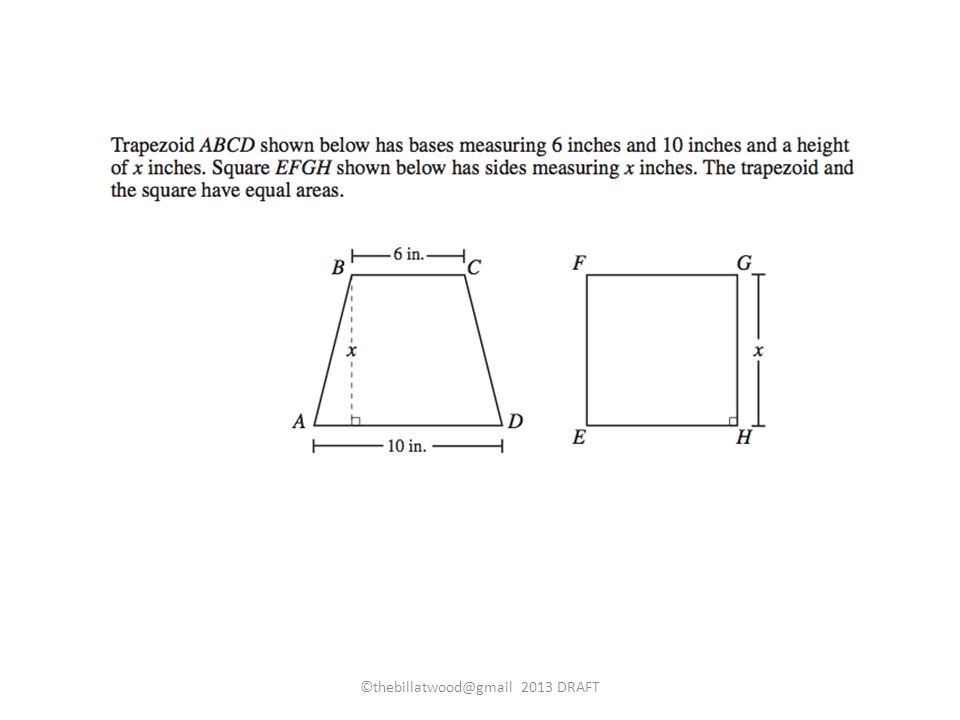
What does this show? Where on the state test can it be found? What does area mean? What kind of units are used to measure it? What does bh mean? Picture a parallelogram, thats not a rectangle, what should you be careful about when finding the area? How is the rectangle formula different from triangle? Why is it different? Explain how to use the trapezoid formula. What is a mistake people make when they use the area of triangle formula? How do you find the height? When finding the area of a circle with a diameter of 20 cm, what are 2 common mistakes? ©thebillatwood@gmail 2013 DRAFT23

24
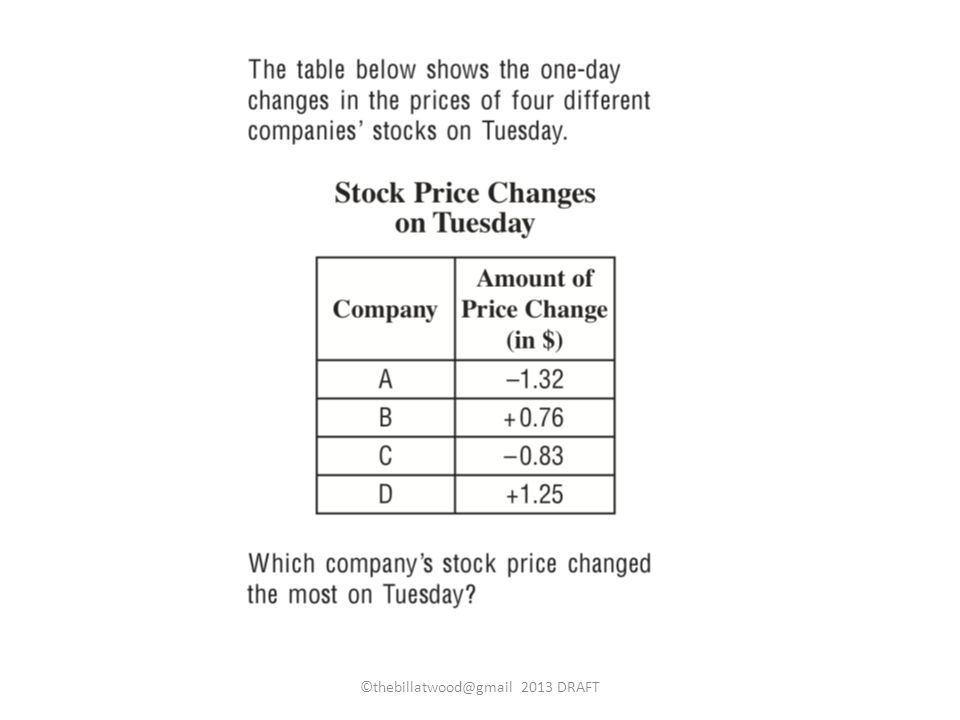
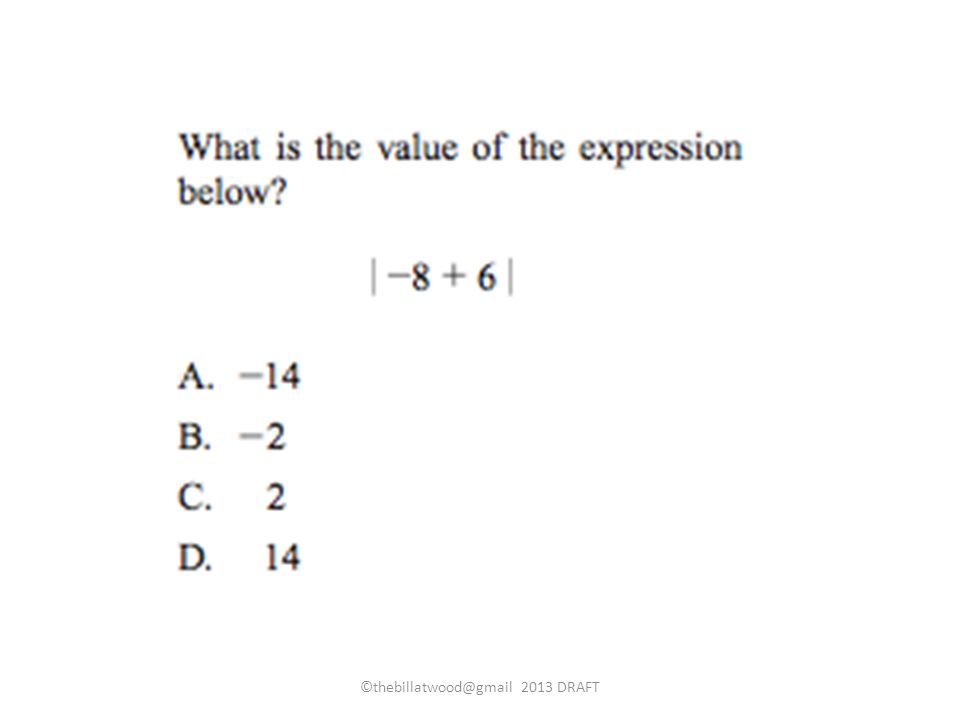
What is this problem about? To solve this problem, what you have to do first? What is absolute value? How do you find it? Which incorrect answer to you think many students will choose? Why? What if this problem asked Ι -8 Ι + Ι 6 Ι ? What would the answer be then? Explain. ©thebillatwood@gmail 2013 DRAFT24 What is a real world example of absolute value?

25
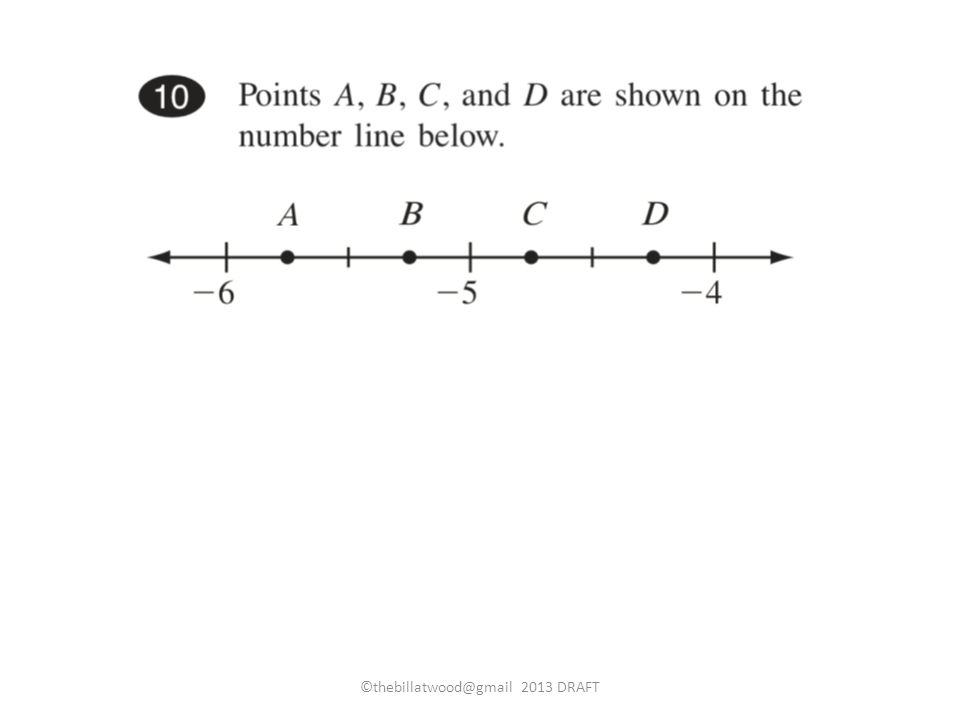
©thebillatwood@gmail 2013 DRAFT25 Who is in the problem and what is she doing? What are these whole numbers called? What is the additive inverse of 2? Where would you plot -1.5? Which integer shown has the least value? Three plus what is equal to zero? Describe a real world example of integers. Describe an addition problem with both negatives and positives that could be solved on this number line.

26
What follows is a recently released item from the Smarter Balanced Assessment for Grade 8. Notice how many problem solving skills are required. Imagine how you might use this graphic to develop student confidence by breaking it down in a series of questions. ©thebillatwood@gmail 2013 DRAFT26

27
©thebillatwood@gmail 2013 DRAFT27

28
I might ask: 1.Who and what is this problem about? 2.What are 5 things you notice about this problem? 3.What questions will likely be asked? 4.What are some key math ideas or vocabulary words related to this? 5.What is going to be tricky about this problem? 6.What might be your first steps? ©thebillatwood@gmail 2013 DRAFT28

29
Here is the actual problem, a sample answer, and the rubric used to score it. ©thebillatwood@gmail 2013 DRAFT29

30
©thebillatwood@gmail 2013 DRAFT30

31
©thebillatwood@gmail 2013 DRAFT31

32
Key Graphics Grade 8 ©thebillatwood@gmail 2013 DRAFT

33
Number System ©thebillatwood@gmail 2013 DRAFT

34
6 + 4 3 ÷ 2 ©thebillatwood@gmail 2013 DRAFT

35
63,000,000 ©thebillatwood@gmail 2013 DRAFT

40
5/8 5/6 2/3 3/4 5/9 2/5 ©thebillatwood@gmail 2013 DRAFT

41
2 1/3 1 5/6 7/4 10/3 ©thebillatwood@gmail 2013 DRAFT

46
18 – 12 ÷ 2 + 1 a.2 b.4 c.11 d.13 ©thebillatwood@gmail 2013 DRAFT

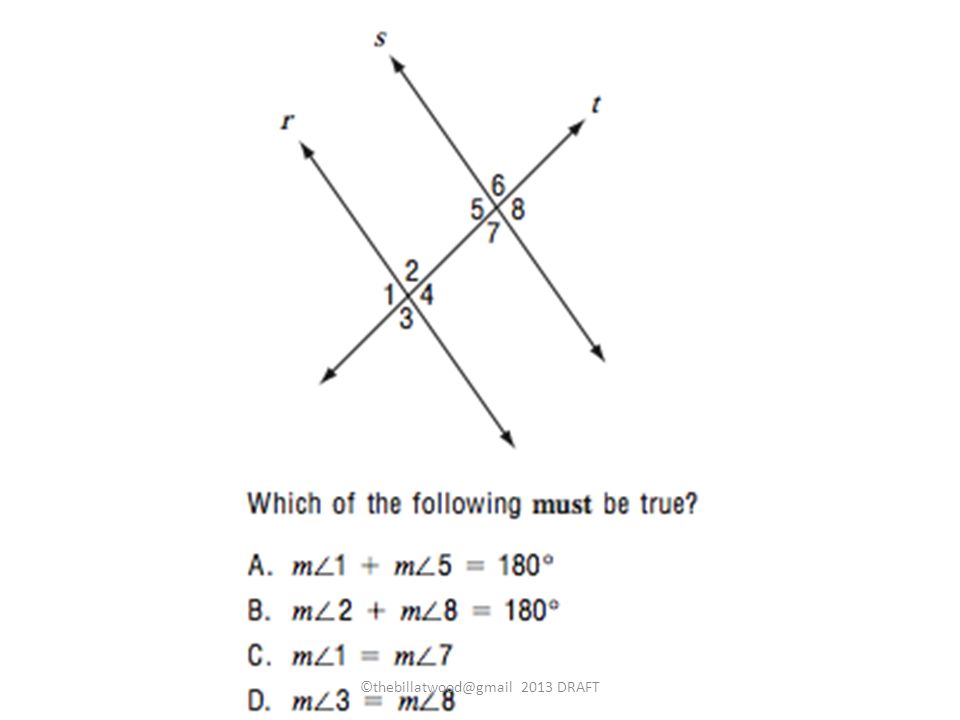
61
Expressions and Equations Functions ©thebillatwood@gmail 2013 DRAFT

64
8 – 2x – 2 = 10 ©thebillatwood@gmail 2013 DRAFT

67
ILOVEMATHILOVEMATHILOVEMATH… ©thebillatwood@gmail 2013 DRAFT

89
Geometry ©thebillatwood@gmail 2013 DRAFT

112
Geometry/Measurement ©thebillatwood@gmail 2013 DRAFT

124
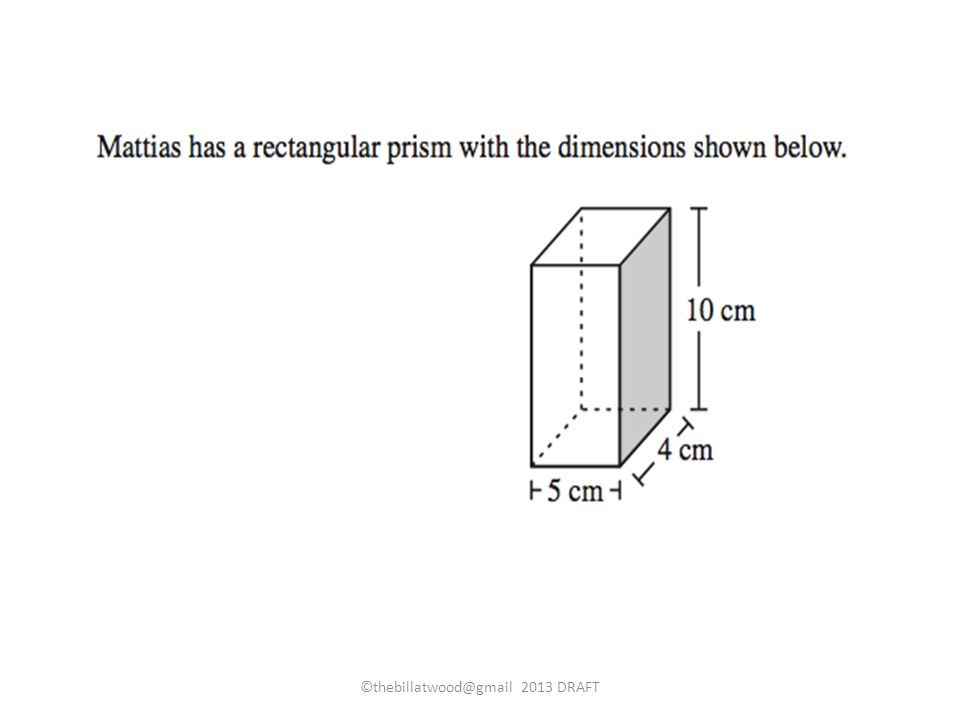
prism 3 dimensions: length width, height VolumeSurface area Edges, vertices, faces Length x width x height Area of base x height 2(l x w) + 2(l x h) + 2(w x h) = SA What are key words for this shape? ©thebillatwood@gmail 2013 DRAFT

138
Statistics and Probability ©thebillatwood@gmail 2013 DRAFT

Similar presentations


 Pertemuan 11-12 Matakuliah: G0454/Class Management & Education Media Tahun: 2006.>")


