Download presentation
Presentation is loading. Please wait.

1
Using Graphics in the Math Classroom

2
Benefits to using the Graphics 1.Students become familiar with the common pictures they will see 2.Students learn to to focus on all the information in graphics before starting the problems 3.Students review key concepts from previous instruction 4.Help students break down the problem by focusing on a small part or important sub-step 5.Students get frequent practice of key skills and vocabulary All graphics developed by Massachusetts Dept. of Education and have appeared on released tests

3
How to use the Graphics 1.Flash them onto screen and pepper (cold call) students with questions. (They answer out loud or after talking to a partner.) 2. Have all students respond on white board. 3.Use the graphics as a Type One or Type Two Writing. Ask: 1.What is the key information? 2.What do you think the questions will be? 3.What vocabulary is related to this? 4.What kind of mistakes should you avoid? 5.How would you find??? What if??? 4.After practicing with these, use the Pepper Cards (see attached) to have students practice by self or with partner. 5.Use the sample cards to give you an idea of the kinds of questions you can ask.
 2. Have all students respond on white board. 3.Use the graphics as a Type One or Type Two Writing. Ask: 1.What is the key information. 2.What do you think the questions will be. 3.What vocabulary is related to this. 4.What kind of mistakes should you avoid. 5.How would you find . What if . 4.After practicing with these, use the Pepper Cards (see attached) to have students practice by self or with partner. 5.Use the sample cards to give you an idea of the kinds of questions you can ask..")
4
The following slides offer sample of the kinds of oral questions you might ask. Remember, you do not have to ask all of the questions These are just samples of question types. Mix it up with higher level and low level questions. Remember, a geometry question can become a fraction question with a little skill. What fraction of these lines are parallel? My favorites question types include: Who and what is it about? What math words go with this? What might they ask? What mistakes will be made? Go backwards… (heres the area, what are the dimensions) What if…
 What if….")
5
Elementary Examples

7
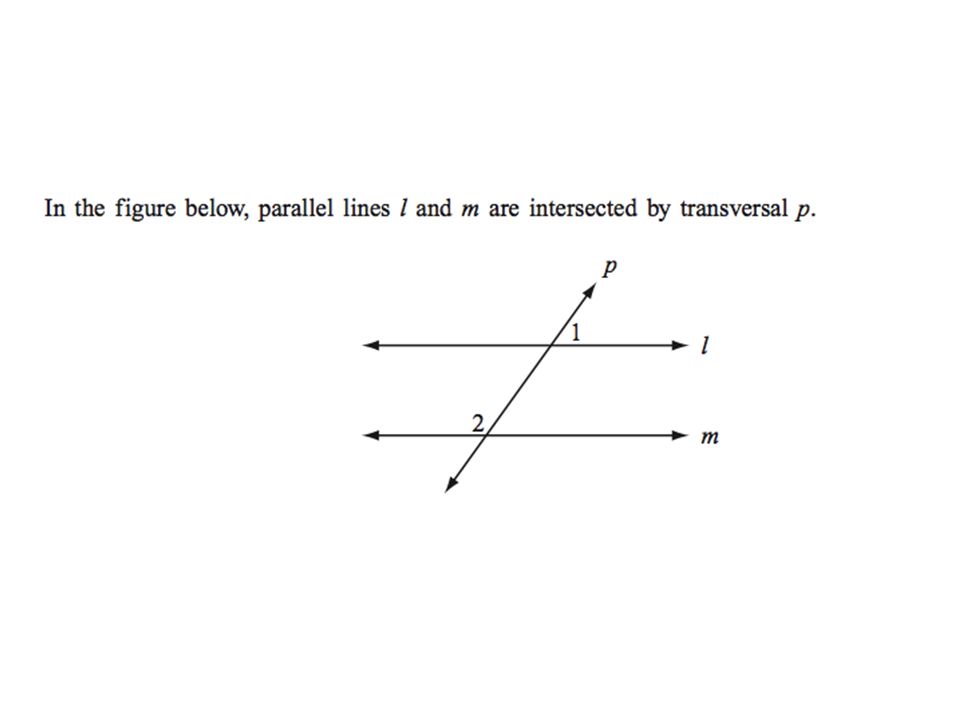
What are some math terms related to this picture? Which letters shows parallel lines ? What how would you describe the lines above letter L? What kind of an angle is formed at Letter O? How many degrees? If you wanted to make a parallelogram which lines would you use? What fraction of these lines are intersecting? What is the ratio of parallel lines to perpendicular lines? What is an example of parallel lines in real life?

8
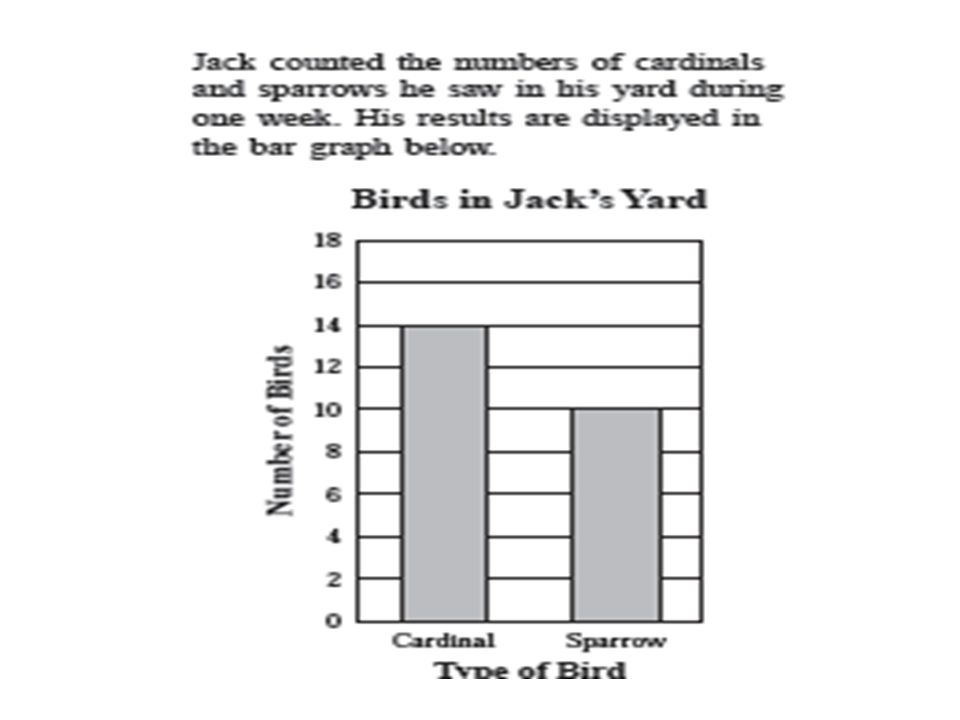
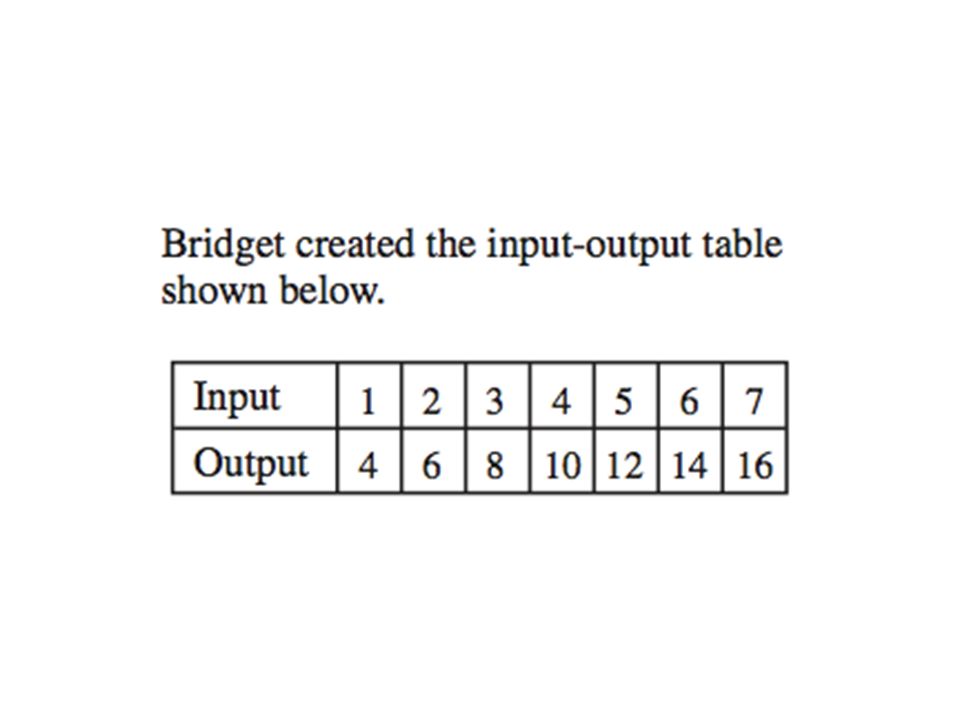
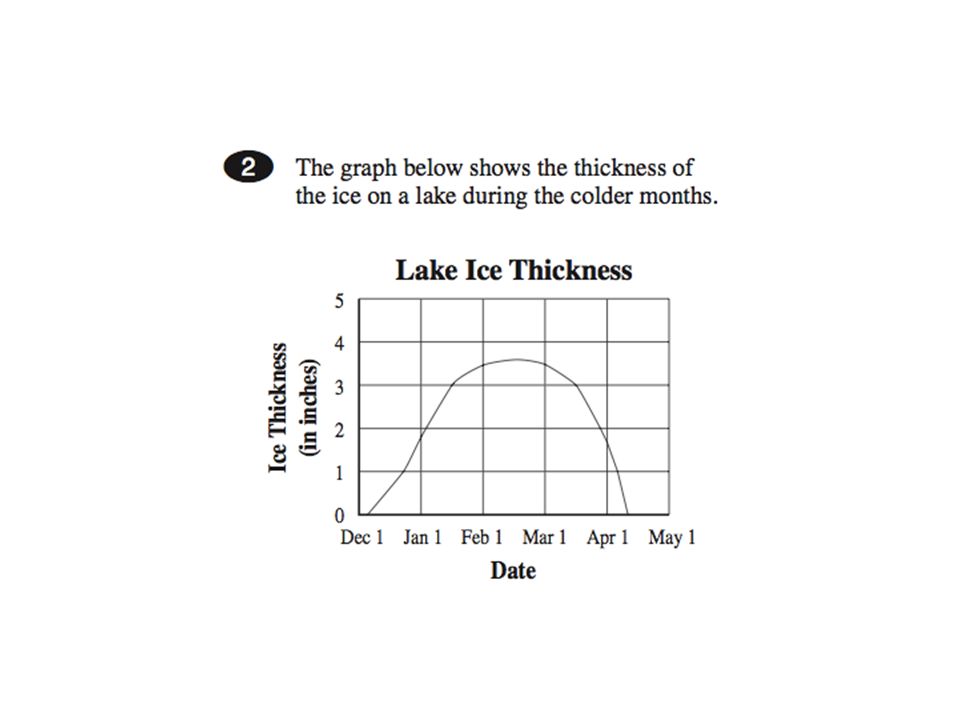
What is this graph called? What is this graph showing? How many plants sold Week 2? On what day were 30 plants sold? How many more on Week 2 and Week 1? A student said there were 21 plants sold on Week 3. What mistake is he making? What kinds of questions will be asked? What If they wanted to sell 200 plants, how many would they need to sell in Week 5?

9
4,305 What is this number? Tell me in expanded form Round to nearest thousand? Explain Odd Even? Multiple of 5? Divisible by three? Explain What if you changed the 3 to a 6 how would the value change? Rearrange these digits and make the largest number possible. Smallest? How far away from 10,000? Double this number. Multiply this number 10. divide by 10..

10
Middle and High School Examples

11
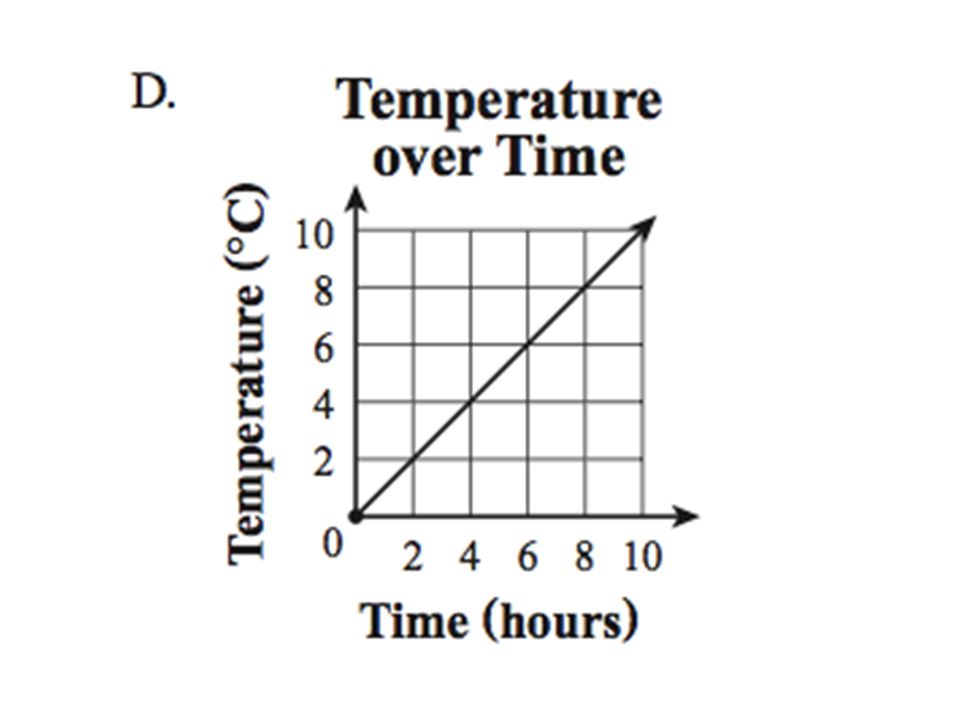
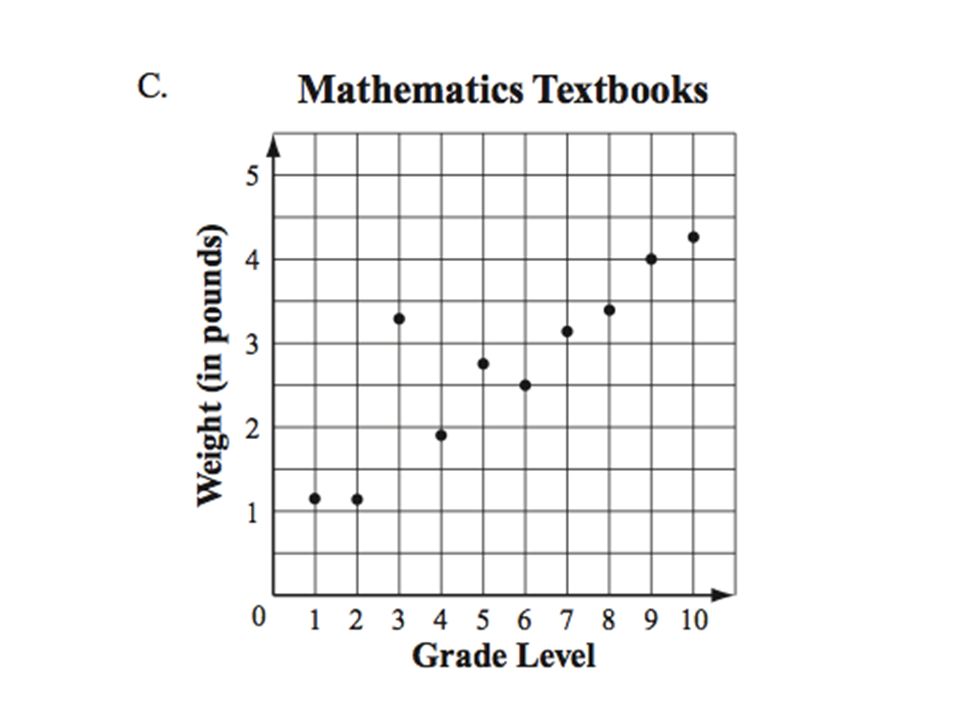
What does this show? What vocabulary words are related? What questions will be asked? How do you find the slope? What is the slope of this line? What are coordinates of y- intercept? Estimate coordinates of y intercept… If slope is 1/3. What is slope of a line perpendicular to this one? Why? Y = 3x + 4. Is this the correct equation? Why not?

12
What does this show? Where is it from? What does area mean? What kind of units to measure it? What does bh mean? When you have a parallelogram, thats not a rectangle, what should you be careful about when finding area? How is rectangle formula different from triangle? Why different? Explain how to use the trapezoid formula Whats a mistake people make when the formula calls for the height of a triangle? Whats the area of a circle with a diameter of 20 cm? What 2 mistakes to people make? (hint: they get an area of 40 cm.)
.")
13
What is this problem about? What you have to do first? What is absolute value? How do you find it? What incorrect answer to you think many students chose? Why? What if this problem asked for absolute value of -8 plus absolute value of 6? What would the answer be then?

14
Key Graphics from Middle and High School

15
Number Sense

16
6 + 4 3 ÷ 2

17
0.25 0.05 0.5 1.05 0.005

18
25% 5% 50% 105%.5%

23
5/8 5/6 2/33/4 5/9 2/5

24
2 1/3 1 5/6 7/410/3

40
18 – 12 ÷ 2 + 1 a.2 b.4 c.11 d.13

42
7 – (-7) = 7 + (-7) = -4 + -5 = -4 – 5= (-7) 2 (-7)(6) (-8)(-8)
 = 7 + (-7) = = -4 – 5= (-7) 2 (-7)(6) (-8)(-8)")
43
Patterns and Algebra

45
8 – 2x – 2 = 10

46
2a 2 – b Evaluate when a = 3 and b =4

49
ILOVEMATHILOVEMATHILOVEMATH…

79
Geometry Strand

95
Measurement Strand

106
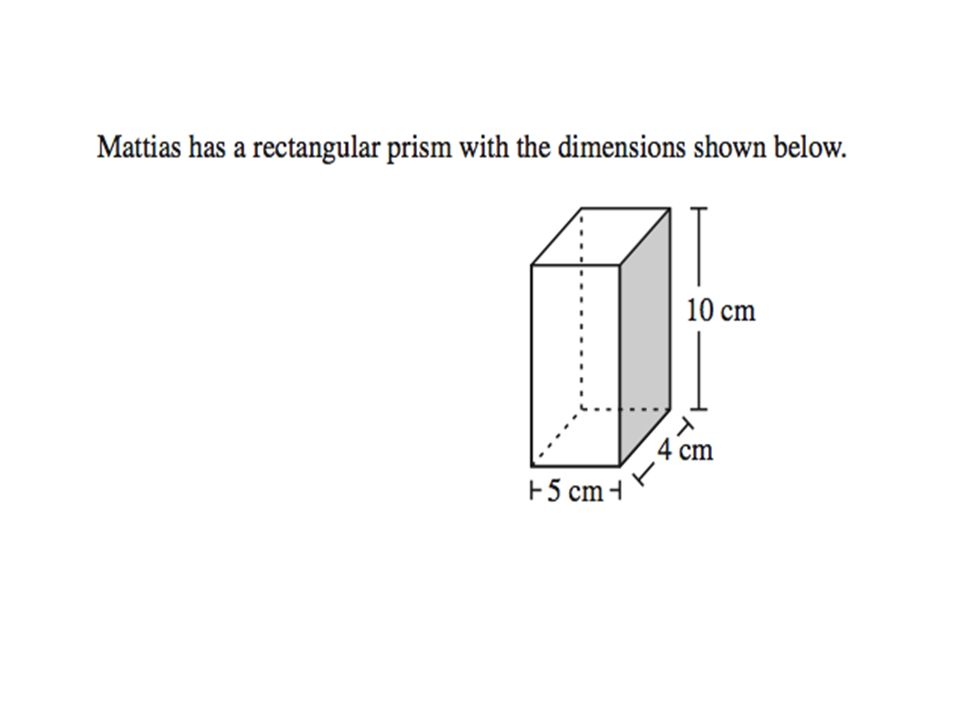
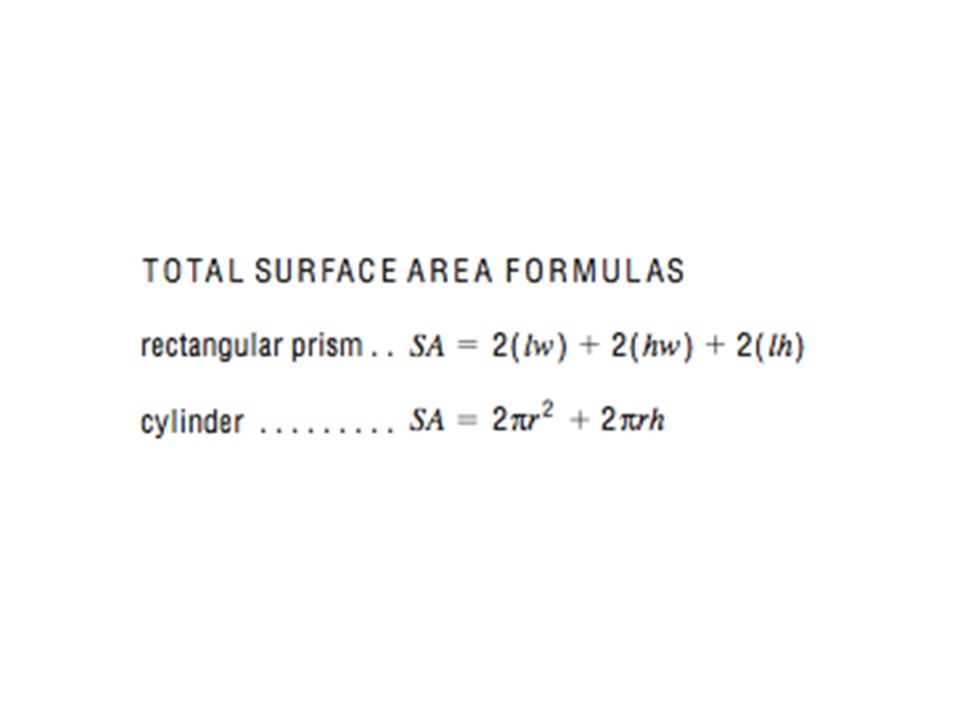
prism 3 dimensions: length width, height VolumeSurface area Edges, vertices, faces Length x width x height Area of base x height 2(l x w) + 2(l x h) + 2(w x h) = SA What are key words for this shape?
 + 2(l x h) + 2(w x h) = SA What are key words for this shape")
120
Data Strand

Similar presentations


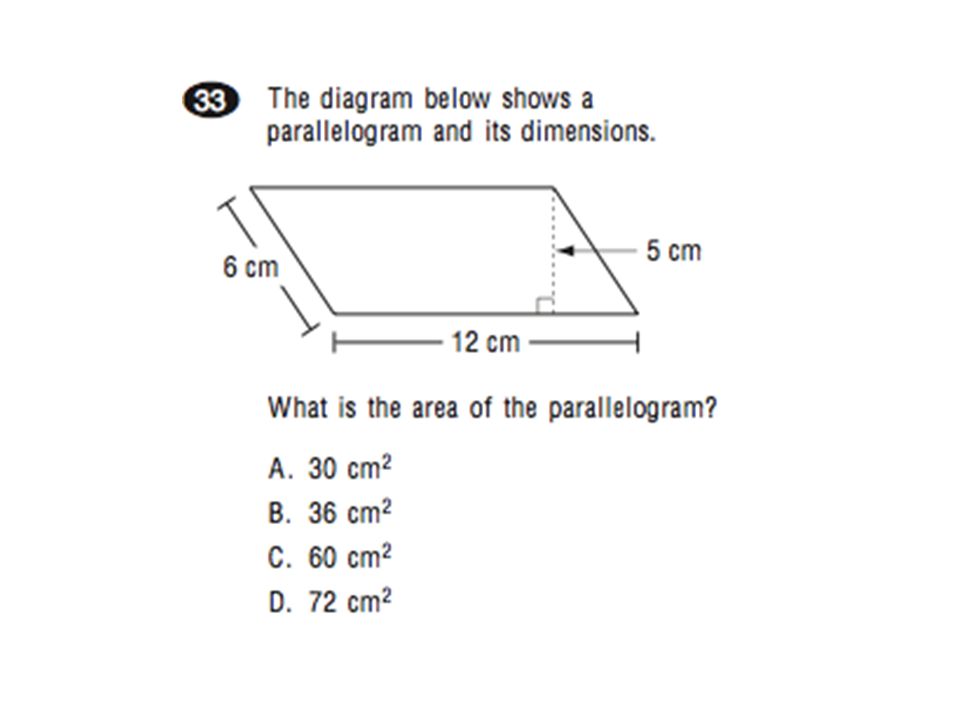


(6) = 60 square units.>")


