Download presentation
Presentation is loading. Please wait.

1
Biofuels: Think outside the Barrel
Vinod Khosla July 2006 Ver 3.2

2
Implausible Assertions ?
We don’t need oil for cars & light trucks We definitely don’t need hydrogen! We don’t need new car/engine designs/distribution Rapid changeover of automobiles is possible! Little cost to consumers, automakers, government

3
Not so Magic Answer: Ethanol
Cheaper Today in Denver (May’06)! Cheaper Today in Brazil!
! Cheaper Today in Brazil!")
4
Plausible? Brazil “Proof”: FFV’s 4% to ~80% of car sales in 3 yrs!
Petroleum use reduction of 40% for cars & light trucks Ethanol $0.75/gal vs $ /gal Rumor: VW to phase out of all gasoline cars in 2006? Brazil Ethanol ~ 60-80% reduction in GHG Brazil: $50b on oil imports “savings”!

5
Possible? 5-6m US FFV vehicles, 4b gals ethanol supply, blending
California: Almost as many FFV’s as diesel vehicles! US prod. costs: Ethanol $1.00/gal vs Gasoline $1.60-$2:20/gal Rapid (20%+) increase of US ethanol production in process Easy, low cost switchover for automobile manufacturers
 increase of US ethanol production in process. Easy, low cost switchover for automobile manufacturers.")
6
Why Ethanol? Today’s cars & fuel distribution (mostly)
Today’s liquid fuel infrastructure (mostly) Cheaper in produce (and sell?) Leverages current trends: FFV’s, Hybrids, Plug-ins,.. Part of fuel market via “blending” - just add E85 Leverages current trends Flex-fuel vehicles proven in millions! Hybrid drivetrain compatible Leverages Lightweighting & improved efficiency of cars Already part of fuel market through “blending” Just add E85 fuel category (third pump!) Existing ethanol market in the billions & growing! Incremental introduction possible & UNDERWAY! Ethanol is cheaper than gasoline at current prices
 Cheaper in produce (and sell ) Leverages current trends: FFV’s, Hybrids, Plug-ins,.. Part of fuel market via blending - just add E85. Leverages current trends. Flex-fuel vehicles proven in millions! Hybrid drivetrain compatible. Leverages Lightweighting & improved efficiency of cars. Already part of fuel market through blending Just add E85 fuel category (third pump!) Existing ethanol market in the billions & growing! Incremental introduction possible & UNDERWAY! Ethanol is cheaper than gasoline at current prices.")
7
What makes it Probable? Interest Groups Land Use Energy Balance
Emissions Kickstart?

8
Why Ethanol? The Interest Group Story
Multiple Issues, One Answer Cheaper fuel for consumers (Cheap Hawks) More energy security & diversified sources (Right wingers) Higher farm incomes & rural employment (Sodbusters) Significant carbon emission reduction (Greens) Faster GDP growth, Lower Imports & energy prices ….. farmers, automakers, evangelicals, retailers, consumers, conservatives, security hawks, greens are all on the same page … or as Jim Woolsey puts it “The coalition (for now) is of tree huggers, do-gooders, sod busters, cheap hawks, evangelicals, and Willie Nelson “
 More energy security & diversified sources (Right wingers) Higher farm incomes & rural employment (Sodbusters) Significant carbon emission reduction (Greens) Faster GDP growth, Lower Imports & energy prices. ….. farmers, automakers, evangelicals, retailers, consumers, conservatives, security hawks, greens are all on the same page. … or as Jim Woolsey puts it The coalition (for now) is of tree huggers, do-gooders, sod busters, cheap hawks, evangelicals, and Willie Nelson")
9
Land Use: Reality (20-50 years)
NRDC: 114m acres for our transportation needs Jim Woolsey/ George Shultz estim. 60m acres Khosla: m acres …. not including “the future” & “other sources” Ethanol from municipal & animal waste, forest Direct/new synthesis technologies

10
Energy Crops: Miscanthus
1 years growth without replanting! 20 tons/acre? ( 10-30 tons/acre (

11
Biomass Will Make a Difference
Turning South Dakota into… …a member of OPEC?! Today Tomorrow Thousand barrels/day Farm acres 44 Million 44 Million Saudi Arabia 9,400 5 15 Iran 3,900 Tons/acre South Dakota 3,429 Gallons/ton 60 80 Kuwait 2,600 Thousand barrels/day 857 3,429 Venezuela 2,500 UAE 2,500 Nigeria 2,200 Iraq 1,700 Libya 1,650 Algeria 1,380 Indonesia 925 Qatar 800 Source: Ceres Company Presentation

12
Export Crop Lands Can Supply ALL our Gasoline Needs
US Acreage Total = 2,300M acres U.S. Cropland Unused or Used for Export Crops In 2015, 78M export acres plus 39M CRP acres could produce 384M gallons of ethanol per day or ~75% of current U.S. gasoline demand Source: Ceres Company Presentation

13
Wrong Question: Energy Balance

14
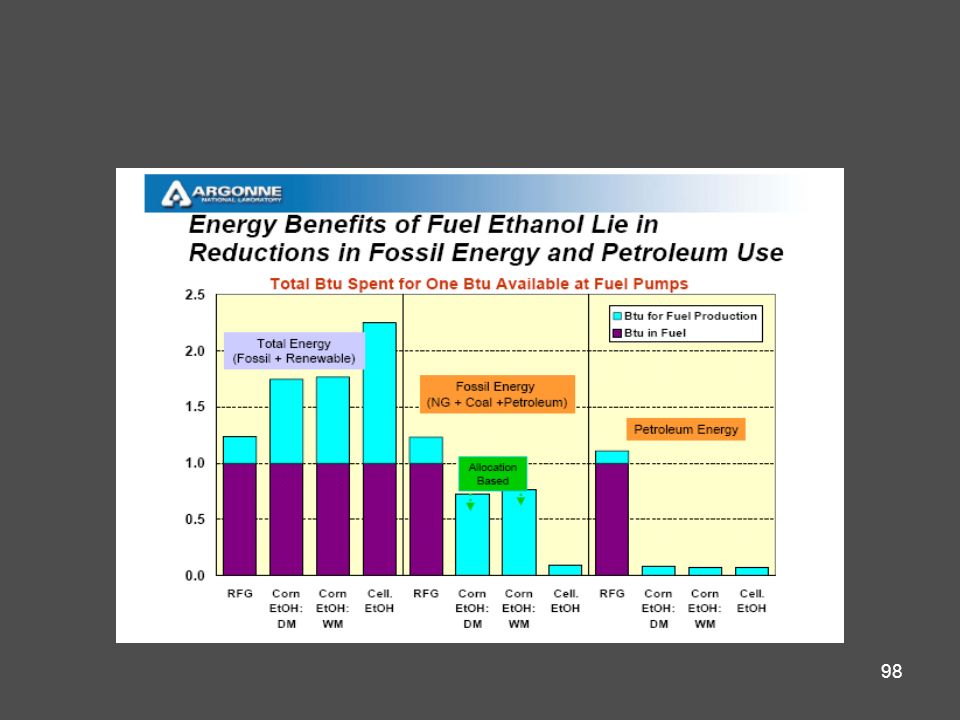
Fossil Fuel Use: Argonne Study Fossil Energy Balance of Electricity is 25% of Corn Ethanol
12X 2X 4X Legend EtoH = Ethanol Allo = Allocation Disp. = Displacement Red: Khosla Comments

15
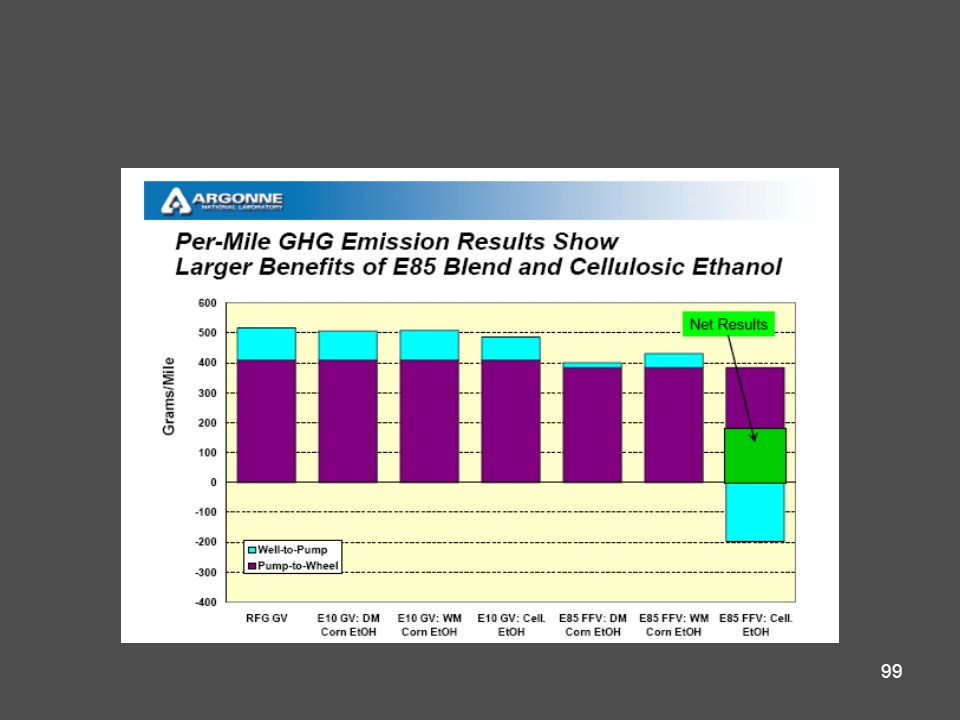
Right Question #1: GHG per Mile Driven
Corn Cellulosic

16
Right Question #2: Petroleum Use Reduction
Answer: Even corn ethanol has a 90% reduction in Petroleum Trick: Fossil Energy is not the same as Petroleum

17
Energy Balance: Not Your Father’s Ethanol
This chart compares the well-to-wheels (or full fuel cycle) emissions from alternative transportation fuels in pounds of CO2-equivalent per gallon of gasoline energy content equivalent. The basis for each bar is described briefly below: FT (Coal): Fischer-Tropsch fuel produced from coal. Based on a stand-alone plant (R. Williams, Princeton). Gasoline (Tar sands): Gasoline made from synthetic petroleum produced from Canadian tar sands. Based on Oil Sands Fever, Pembina Institute, November 2005. FT (Coal CCD): Fischer-Tropsch fuel produced from coal with carbon dioxide capture and disposal (CCD) from the production plant. Based on a stand-alone plant (R. Williams, Princeton). Gasoline: Conventional gasoline, including upstream emissions based on Argonne GREET model. Ethanol (Corn Coal): Ethanol produced from corn using coal for process energy at the ethanol plant and assuming energy intensive agriculture. Based on Farrell et al., Science 311:506. Ethanol (Today): Estimate of the national average emission rate from the current mix of fuel used for ethanol production and the current mix of dry and wet mills. Based on Farrell et al., Science 311:506. Ethanol (Corn NG): Ethanol produced from corn using natural gas for process energy at a dry mill ethanol plant. Based on Farrell et al., EBAMM model. Ethanol (Corn Biomass): Ethanol produced from corn using biomass for process energy at a dry mill ethanol plant. Based on Farrell et al., EBAMM model. Ethanol (Cellulosic): Ethanol produced from cellulosic biomass using biomass for process energy. Based on Farrell et al., EBAMM model. Ethanol (Corn Biomass CCD): Ethanol produced from corn using biomass for process energy at a dry mill ethanol plant with capture and disposal of the CO2 produced from the fermentation process. Based on Farrell et al., EBAMM model subtracting fermentation CO2 of 6.6 pounds of CO2 per gallon of ethanol ( Ethanol (Cellulosic CCD): Ethanol produced from cellulosic biomass using biomass for process energy with capture and disposal of the CO2 produced from the fermentation process. Based on Farrell et al., EBAMM model subtracting fermentation CO2 of 6.6 pounds of CO2 per gallon of ethanol ( Different Corn Ethanol Production Methods Have different Emissions Source: NRDC
 emissions from alternative transportation fuels in pounds of CO2-equivalent per gallon of gasoline energy content equivalent. The basis for each bar is described briefly below: FT (Coal): Fischer-Tropsch fuel produced from coal. Based on a stand-alone plant (R. Williams, Princeton). Gasoline (Tar sands): Gasoline made from synthetic petroleum produced from Canadian tar sands. Based on Oil Sands Fever, Pembina Institute, November FT (Coal CCD): Fischer-Tropsch fuel produced from coal with carbon dioxide capture and disposal (CCD) from the production plant. Based on a stand-alone plant (R. Williams, Princeton). Gasoline: Conventional gasoline, including upstream emissions based on Argonne GREET model. Ethanol (Corn Coal): Ethanol produced from corn using coal for process energy at the ethanol plant and assuming energy intensive agriculture. Based on Farrell et al., Science 311:506. Ethanol (Today): Estimate of the national average emission rate from the current mix of fuel used for ethanol production and the current mix of dry and wet mills. Based on Farrell et al., Science 311:506. Ethanol (Corn NG): Ethanol produced from corn using natural gas for process energy at a dry mill ethanol plant. Based on Farrell et al., EBAMM model. Ethanol (Corn Biomass): Ethanol produced from corn using biomass for process energy at a dry mill ethanol plant. Based on Farrell et al., EBAMM model. Ethanol (Cellulosic): Ethanol produced from cellulosic biomass using biomass for process energy. Based on Farrell et al., EBAMM model. Ethanol (Corn Biomass CCD): Ethanol produced from corn using biomass for process energy at a dry mill ethanol plant with capture and disposal of the CO2 produced from the fermentation process. Based on Farrell et al., EBAMM model subtracting fermentation CO2 of 6.6 pounds of CO2 per gallon of ethanol ( Ethanol (Cellulosic CCD): Ethanol produced from cellulosic biomass using biomass for process energy with capture and disposal of the CO2 produced from the fermentation process. Based on Farrell et al., EBAMM model subtracting fermentation CO2 of 6.6 pounds of CO2 per gallon of ethanol ( Different Corn Ethanol Production Methods Have different Emissions. Source: NRDC.")
18
Great (5X) Energy Balance for “E3 Biofuels” Corn Ethanol
The E3 BioSolution's a solid waste mangmt. facility an ethanol plant An animal feeding operation …. into a self-sustaining, closed loop system. E3 system virtually eliminates water, air and odor pollution produces ethanol using little or no fossil fuel,

19
NRDC Report - “Ethanol: Energy Well Spent”
“corn ethanol is providing important petroleum savings and greenhouse gas reductions” “very little petroleum is used in the production of ethanol …..shift from gasoline to ethanol will reduce our oil dependence” “cellulosic ethanol simply delivers profoundly more renewable energy than corn ethanol” Don’t let best be the enemy of the good

20
Emission Levels of Two 2005 FFVs (grams per mile @ 50,000 miles)
Vehicle Model Fuel NOx (CA std.=0.14) NMOG (CA std.=0.10) CO (CA std. =3.4) 2005 Ford Taurus E85 0.03 0.047 0.6 Gasoline 0.02 0.049 0.9 2005 Mercedes-Benz C 240 0.01 0.043 0.2 0.04 0.028 0.3 source: California Air Resources Board, On-Road New Vehicle and Engine Certification Program, Executive Orders;
 NMOG. (CA std.=0.10) CO. (CA std. =3.4) 2005 Ford Taurus. E Gasoline Mercedes-Benz C source: California Air Resources Board, On-Road New Vehicle and Engine Certification Program, Executive Orders;")
21
In Defense of Corn Ethanol TRAJECTORY, TRAJECTORY, TRAJECTORY
Ethanol: from 500 to 3000 gallows per acre Reduces market risk – Funds cellulsoic ethanol Primes Infrastructure for cellulosic ethanol, biohols Compatible with hybrids, plug-ins, light-weighting,… Alternatives Biodiesel trajectory from 500 gallons per acre to 700 gpc? Electric: higher technology risk on batteries, higher consumer cost Biohols compatible if electrics get better, cheaper, greener,.. Look Beyond “what is” to “what can be” Revolution thru Evolution is Easier

22
Technology Progression
Synthetic Biorefinery Gasification Other Synthesis? Corn Algae Cellulosic Bioethanol

23
Technology Improvements
Bioengineering Enzymes Plant engineering Process & Process Yields Process Cost Pre-treatment Co-production of chemicals Process Yield gals/ ton Consolidated bioprocessing Energy crops Miscanthus Switch grass Poplar Willow “Out of the Box” Thermochemical Synthetic Biology Better Fuels !!! Better Chemistries ????????

24
Companies & Technologies
Novozyme Genencor Diversa Iogen Ceres BRI Xenothol Corn Ethanol Cos Dupont/BP (Butanol) MSW to Ethanol Big guys…. Celunol Clearfuels Canavialis Edenspace Agrivada Mascoma Synthetic Genomics Alellyx Syntec Choren Unannounced….
 MSW to Ethanol. Big guys…. Celunol. Clearfuels. Canavialis. Edenspace. Agrivada. Mascoma. Synthetic Genomics. Alellyx. Syntec. Choren. Unannounced….")
25
Brazil sugar-cane/ethanol learning curve Liters of ethanol produced per hectare since between 1975 to 2004 30,000??

26
Large Improvements Are Not Just For Silicon
Conservative Cellulosic Brazil Energy Cane (27tpy/108gpt) Sugar Cane + Baggasse (11 tpy/102gpt) Corn, Cellulose, Cane Today Cellulosic (10tpy/100gpt)
 Sugar Cane + Baggasse. (11 tpy/102gpt) Corn, Cellulose, Cane Today. Cellulosic (10tpy/100gpt)")
27
Three Simple Action Items
Require 70% new cars to be Flex Fuel Vehicles … require yellow gas caps on all FFV’s & provide incentives to automakers Require E85 ethanol distribution at 10% of gas stations …. for owners or branders with more than 25 stations; Make VEETC credit variable with oil price ($ ) …. providing protection against price manipulation by oil interests ....ensuring investors long term demand and oil price stability
 …. providing protection against price manipulation by oil interests. ....ensuring investors long term demand and oil price stability.")
28
Other “Helpful” Action Items
Switch ethanol credit from blenders to “producers” (for 5yrs only for new plants) Allow imports of foreign ethanol tax free for E85 only; extend RFS Provide “cellulosic” credits above “ethanol” credits; monetize energy act credit Institute RFS for E85 & cellulosic ethanol Switch CAFÉ mileage to “petroleum CAFÉ mileage”; reform & strengthen CAFE Loan guarantees for first few plants built with any “new technology” Institute a carbon cap and trade system Switch subsidies (same $/acre) to energy crops
 Allow imports of foreign ethanol tax free for E85 only; extend RFS. Provide cellulosic credits above ethanol credits; monetize energy act credit. Institute RFS for E85 & cellulosic ethanol. Switch CAFÉ mileage to petroleum CAFÉ mileage ; reform & strengthen CAFE. Loan guarantees for first few plants built with any new technology Institute a carbon cap and trade system. Switch subsidies (same $/acre) to energy crops.")
29
Why Now? Projected World Oil Prices (EIA)
Alternative Technology Viability Zone Source: EIA Reports

30
RISK: Oil vs. Hydrogen vs. Ethanol
Biofuels Energy Security Risk High Low Cost per Mile Med Med-High Infrastructure Cost Very Low Very High Technology Risk Environmental Cost Med-Low Implementation Risk Interest Group Opposition Political Difficulty ? Time to Impact - Very high Source: Khosla

31
A Darwinian IQ Test? Feed mid-east terrorism or mid-west farmers?
Import expensive gasoline or use cheaper ethanol? Create farm jobs or mid-east oil tycoons? Fossil fuels or green fuels? ANWR oil rigs or “prairie grass” fields? Gasoline cars or cars with fuel choices?

32
What Could Happen! Demand/Supply Projections

33
We Must Kick Start the E85 Market!!
Additive Market Projected supply of 173B gallons ethanol for FFV’s by 2030 We Must Kick Start the E85 Market!!

34
What is Happening… Problem Zone Source: JJ&A Fuel Blendstock Report

35
US Ethanol Capacity Build-up
? 4.0 bgpy (263 kbd) …and rising! Energy Bill statutory 2012 level: 7.5 billion gallons per year Billion Gallons Per Year Thousand Barrels Per Day 2.6 bgpy (171 kbd) 4.5 bgpy (293 kbd) Source: Cambridge Energy Research Associates, Renewable Fuels Association
 …and rising! Energy Bill statutory 2012 level: 7.5 billion gallons per year. Billion. Gallons. Per. Year. Thousand. Barrels. Per. Day. 2.6 bgpy. (171 kbd) 4.5 bgpy. (293 kbd) Source: Cambridge Energy Research Associates, Renewable Fuels Association.")
36
Short Term Demand/Supply Forecast
Price Source: JJ&A Fuel Blendstock Report ; Price trend estimates by Vinod Khosla

37
My Favorite FFV . . . SAAB 9-5 Launched May’05 with +25hp with E85
In Europe, the turbo charged SAAB Bio-Power has been very successful. Like all FFVs, the engine control system adjusts the rate of fuel delivery and spark advance depending upon the amount of ethanol present in the fuel tank . . . . . . But additionally, the SAAB Bio-power adjusts the turbo boost level, increasing the effective Compression Ratio based again on the amount of ethanol present in the fuel. This has the effect of recovering through increased thermal efficiency the volumetric fuel economy loss observed in normally aspirated FFVs. SAAB 9-5 Launched May’05 with +25hp with E85 25% mileage reduction going to 18% Another big ethanol mileage increase when hp held to gasoline hp

38
Bad Questions, Bad Data, Wrong Questions, Wrong Answers, and more…
The False Hope of Biofuels ( James Jordan & James Powell, Washington Post, July 2, 2006) Wrong questions: Not energy balance but balance versus gasoline or electricity Wrong data: bushels per acre, gallons per bushel, Use energy content not mileage- who cares about energy balance? Upside? “some researchers even claim that…” – what about many others? Moralizing about food – what about oil excesses? Is President Lulu wrong? Selective facts – quote impractical corn stover but ignore DOE Report Judgment calls – gallons per acre …and more!
 Wrong questions: Not energy balance but balance versus gasoline or electricity. Wrong data: bushels per acre, gallons per bushel, Use energy content not mileage- who cares about energy balance Upside some researchers even claim that… – what about many others Moralizing about food – what about oil excesses Is President Lulu wrong Selective facts – quote impractical corn stover but ignore DOE Report. Judgment calls – gallons per acre. …and more!")
39
WSJ Oped: Myths & Bad Data Abound!!
2/3G oil energy = ½ unit of gasoline. Thus, today’s corn ethanol is 2X better than gasoline Conservatively we will reach 27tpa &110 gallons per dry ton or about 3000 gallons per acre in the US within 25 years. Error by 5-7X!!! A $0.10 gasohol credit would imply 20% ethanol blend… NO! Average <10% Optimistically, we could achieve 5,000 gallons/acre by 2030! Off by 10X? $30-40 per barrel oil price seems like the likely breakeven within 5-7 years for cellulosic ethanol NOT $50-70 WSJ Oped: Myths & Bad Data Abound!!

40
Myths Galore! Energy Balance – Not your father’s ethanol
Not enough cropland – only if you try to make pigs fly! Food prices or the best thing for poverty? Lower energy content, lower mileage – in which engine? More expensive or poorly managed? US oil or Saudi oil? Existing infrastructure – for E85 or additive? Some or all pumps? Dubious environmental benefits – as additive E20 or E85? Cellulosic ethanol – real or not? Free marketeers hell or level playing field?

41
Positive Energy Balance
Only the Negative Studies are Cited! Positive Energy Balance Lorenz & Morris (1995) Wang et al. (1999) Agri Canada (1999) Shapouri et al (1995,2002, 2004) Kim & Dale (2002, 2004) Graboski (2002) Delucchi (2003) NR Canada (2005) Negative Energy Balance Pimentel & Patzek White House Memo (2005): “It is notable that only one study in the last ten years shows a negative energy balance”
 Wang et al. (1999) Agri Canada (1999) Shapouri et al (1995,2002, 2004) Kim & Dale (2002, 2004) Graboski (2002) Delucchi (2003) NR Canada (2005) Negative Energy Balance. Pimentel & Patzek. White House Memo (2005): It is notable that only one study in the last ten years shows a negative energy balance")
42
Developing Oil vs Ethanol
Chevron’s Tahiti field will cost $5.5 billion be expensive to operate being in 24,000 feet of deep ocean. It will generate 125,000 barrels of oil a day or about a billion gallons of gasoline and similar amounts of other products. The same capital investment could produce 4 billion gallons of ethanol capacity (and other animal feed products) at little risk.
 at little risk.")
43
“Free Markets?”: GAO List of Oil Subsidies
Excess of Percentage over cost depletion” worth $82 billion dollar subsidy Expensing of exploration and development cost - $42 billion subsidy. Add on alternative fuel production credit (read oil shales, tar sands etc). Oil and gas exception from passive loss limitation Credit for enhanced oil recovery costs Expensing of tertiary injectants …and other esoteric tools the oil lobby has inserted into various legislation …and the indirect costs Katrina royalty relief to the tune of $7b Health-care costs of the air pollution they generate, Environmental cleanup costs when they have a spill, Cost of defense in the Mideast to stabilize the supply of crude oil, Cost of global warming and related damage ….indirect subsidies have been variously estimated at from a few tens of cents to many dollars per gallon
. Oil and gas exception from passive loss limitation. Credit for enhanced oil recovery costs. Expensing of tertiary injectants. …and other esoteric tools the oil lobby has inserted into various legislation. …and the indirect costs. Katrina royalty relief to the tune of $7b. Health-care costs of the air pollution they generate, Environmental cleanup costs when they have a spill, Cost of defense in the Mideast to stabilize the supply of crude oil, Cost of global warming and related damage. ….indirect subsidies have been variously estimated at from a few tens of cents to many dollars per gallon.")
44
The Possible at “NORMAL” Margins! June 2006, Aberdeen , South Dakota

45
Biomass, Geopolitics & Poverty
Biomass & Poverty Belt See what we are talking about: the area between the lines shows the tropical region, the potential it represents for less developed countries, and the positive impacts on their economies, as well as the global economy, which are extremely relevant to a balanced world scenario and, specifically, create effective conditions for peace. That is a global effort that calls for positive actions on the part of global institutions. It is a great chance to establish more balanced relationships, while fostering development and reducing geographic disparities

46
Comments?

47
Side Bars

48
Flex Fuel Vehicles (FFV)
Little incremental cost to produce & low risk Consumer choice: use EITHER ethanol or gasoline Easy switchover for automobile manufacturers Fully compatible with Hybrid cars

49
Incremental Cost of FFV
Sensor $70 (needed anyway in modern cars; not an additional cost) “Other” costs $30 Amortized Certification & Calib. $10 (volume cars)
 Other costs $30. Amortized Certification & Calib. $10 (volume cars)")
50
Automakers adopting FFV’s!
2006 Ford K GM 250K Chrysler 100K+ 2007 GM 400K Chrysler 250K 2008 GM 600K Chrysler 500K Data from Chrysler PR, GM slides and Ford handout

51
Petroleum Displacement
Annual Gasoline Savings of 477 Gallons/Year (Assumes 11,000 miles/year*) E85 FFV on E85 12 mpg (EPA Adjusted Combined) A consumer who fuels a light truck FFV with E85 instead of gasoline will save about 477 gallons of gasoline per year. While the light truck clearly uses more energy overall, the larger petroleum displacement potential is very real. This example shows how powerful bio-fuels can be as a tool for reducing petroleum dependence. E85 FFV on Gasoline 16 mpg (EPA Adjusted Combined) * Personal Transportation Study - Oak Ridge Nat. Lab Data Book
 E85 FFV on E85 12 mpg (EPA Adjusted Combined) A consumer who fuels a light truck FFV with E85 instead of gasoline will save about 477 gallons of gasoline per year. While the light truck clearly uses more energy overall, the larger petroleum displacement potential is very real. This example shows how powerful bio-fuels can be as a tool for reducing petroleum dependence. E85 FFV on Gasoline 16 mpg (EPA Adjusted Combined) * Personal Transportation Study - Oak Ridge Nat. Lab Data Book.")
52
Hybrid or FFV? Hybrid FFV Cost $3000 $30 Gasoline Savings 157 477
(11000 m/yr; 14mpg) 157 477
")
53
Oil Companies Discouraging Use!

54
More Resistance!!! Misinformation about need for
periodic gasoline refills in Brazil

55
Land Use

56
Land Use Possibilities
Dedicated intensive energy crop plantations “Export crop” lands Crop rotate row crops & “prairie grass” energy crops CRP lands planted with “prairie grasses” or equivalent Co-production of ethanol feedstocks & animal protein Waste from currently managed Lands

57
Potential for Billion Tons of Biomass
“In the context of the time required to scale up to a large-scale biorefinery industry, an annual biomass supply of more than 1.3 billion dry tons can be accomplished with relatively modest changes in land use and agricultural and forestry practices” Technical Feasibility of a Billion-Ton Annual Supply US Department of Energy Report , April 2005. …. Or a 130billion++ gallons per year!

58
Miscanthus vs. Corn/Soy
Lower fertilizer & water needs Strong photosynthesis, perennial Stores carbon & nutrients in soil Great field characteristics, longer canopy season Economics: +$3000 vs -$300 (10yr profit per U Illinois)
")
59
Energy Crops: Switch Grass
Natural prairie grass in the US; enriches soil Less water; less fertilizer; less pesticide Reduced green house gases More biodiversity in switchgrass fields (vs. corn) Dramatically less topsoil loss High potential for co-production of animal feed
 Dramatically less topsoil loss. High potential for co-production of animal feed.")
60
Farmers Are Driven By Economics
Per acre economics of dedicated biomass crops vs. traditional row crops Biomass Corn Wheat Grain yield (bushel) N/A 162 46 Grain price ($/bushel) $2 $3 Biomass yield (tons) 15 2 Biomass price ($/ton) $20 Total revenue $300 $364 $178 Variable costs $84 $168 $75 Amortized fixed costs $36 $66 Net return $180 $120 $57 Source: Ceres Company Presentation
 N/A Grain price ($/bushel) $2. $3. Biomass yield (tons) Biomass price ($/ton) $20. Total revenue. $300. $364. $178. Variable costs. $84. $168. $75. Amortized fixed costs. $36. $66. Net return. $180. $120. $57. Source: Ceres Company Presentation.")
61
Biomass as Reserves: One Exxon every 10 yrs!!
1 acre 100M acres = 209 barrels of oil* 20.9 billion barrels Proven Reserves (billion barrels) Exxon Mobil 22.20 BP 18.50 Royal Dutch Shell 12.98 Chevron 9.95 Conoco Phillips 7.60 * Assumes 10 yr contract Source: Energy Intelligence (data as of end of 2004);Ceres presentation
 Exxon Mobil BP Royal Dutch Shell Chevron Conoco Phillips * Assumes 10 yr contract. Source: Energy Intelligence (data as of end of 2004);Ceres presentation.")
62
Energy Balance & Fossil Fuel Use Reductions

63
NRDC Report - “Ethanol: Energy Well Spent”
Gasoline “It is notable that Pimental is the only study in the last ten years to show a negative balance” – White House Memo, 2005 Red: Khosla Comments

64
NRDC Report - “Ethanol: Energy Well Spent”
Gasoline Red: Khosla Comments

65
Ceres: What one company is doing…

66
Expanding Usable Acreage…
Drought tolerance Heat tolerance Cold germination Drought Inducible Promoters Salt tolerance Drought recovery Source: Ceres Company Presentations

67
Increasing Tons per Acre…
CO2 uptake Light density Photosynthetic Efficiency Flowering time Increased biomass Shade tolerance Herbicide tolerance Stature control Source: Ceres Company Presentations

68
Reducing Dollars per Acre…
Nitrate Content in Shoots 0.5 1 1.5 2 2.5 3 3.5 4 Time Point N (ng/ mg DW) Control Transgenic * p < 0.001 Nitrogen partitioning Nitrogen uptake Photosynthetic efficiency under low nitrogen Increased root biomass Source: Ceres Company Presentations
 Control. Transgenic. * p < Nitrogen partitioning. Nitrogen uptake. Photosynthetic efficiency under low nitrogen. Increased root biomass. Source: Ceres Company Presentations.")
69
Increasing Gallons per Ton…
Gallons of ethanol per dry ton of feedstock* Composition (How much carbohydrate is there?) Plant structure (How easy is it to access and digest?) *Data represents theoretical yields as reported by Iogen Source: Ceres Company Presentations
 Plant structure. (How easy is it to access and digest ) *Data represents theoretical yields as reported by Iogen. Source: Ceres Company Presentations.")
70
Reducing Cost Through Enzyme Production…
Target Line Activation Line UASn Trait UASx Sterility X UAS Marker T P1 Promoter Protein Sterility Factor Fluorescent marker Transcription factor Ceres’ proprietary gene expression system Root Leaf Stem Seed Flower Ceres promoter Industry standard promoter Tissue-specific promoters Source:Ceres Company Presentations

71
Ceres : Developing Commercial Energy Crops
Generating Plant Material for DNA Libraries to be Used in Molecular Assisted Breeding Transformation with Ceres’ Traits Embryogenic callus 1 day after trimming Shoot regenerated from callus Plant regeneration Re-growth after 15 days Ceres expects to have proprietary commercial varieties ready for market in 2-3 years and transgenic varieties in 5-7 Source: Ceres Company Presentations

72
Strategy & Tactics Choice: Oil imports or ethanol imports?
GDP – “beyond food to food & energy “ rural economy Add $5-50B to rural GDP Better use for subsidies through “energy crops” Rely on entrepreneurs to increase capacity Biotechnology & process technology to increase yields

73
Status: United States

74
E85 Availability and Appeal September 2005
As I mentioned, the availability of high concentration blends of ethanol is pretty limited, about 600 stations in the U.S. today. In this unscientific sampling of stations in the United States in September 2005, E85 was priced an average of 35 cents below unleaded regular gasoline. Obviously, this price differential is subject to many factors and changes constantly Not the least of which is demand for ethanol to replace MTBE in low concentration blends like E6 or E10.

75
Ethanol Capacity Expansion is Underway

76
Ethanol FFVs Are Here! California’s Motor Vehicle Population
Vehicle Type Gasoline Diesel Ethanol FFV Hybrid gas/elec CNG Electric LPG/ other H2 Light-Duty 24,785,578 391,950 257,698 45,263 21,269 14,425 538 13 Heavy-Duty 372,849 471,340 -- 5,401 806 1,172 source: California Energy Commission joint-agency data project with California Department of Motor Vehicles. Ethanol FFV data as of April 2005; all other data as of October 2004.

77
Source: Encyclopedia of Energy (Ethanol Fuels , Charlie Wyman)
Costs Wet Mills Dry Mills Overall Weighted Average Electricity & Fuel $0.112/gallon $0.131/gallon $1.118/gallon Operating Labor, $0.124/gallon $0.109/gallon Repairs and Maintenance Yeast, Enzymes, Chemicals and Other $0.114/gallon $0.090/gallon Administration, Insurance and Taxes $0.038/gallon $0.037/gallon All Other Costs $0.072/gallon $0.051/gallon Total Cash Costs $0.46/gallon $0.42/gallon Combined with Net $0.48/gallon $0.53/gallon $0.94/gallon “NET” cost of corn Depreciation (plant & Equip) $0.10-$0.20 $0.10-$0.20 Note: Capital costs of ethanol production are estimated to be between $1.07/gallon to $2.39/gallon, varying with facility type, size, and technology. Source: Encyclopedia of Energy (Ethanol Fuels , Charlie Wyman)
 $0.10-$0.20. $0.10-$0.20. Note: Capital costs of ethanol production are estimated to be between. $1.07/gallon to $2.39/gallon, varying with facility type, size, and technology. Source: Encyclopedia of Energy (Ethanol Fuels , Charlie Wyman)")
78
NY Times Poll (3/2/2006) Washington mandate more efficient cars – 89%
No on Gasoline tax -87% No on Tax to reduce dependence on foreign oil -37% No on gas tax to reduce global warming – 34%

79
References NRDC Report: “Growing Energy” (Dec 2004)
George Schultz & Jim Woolsey white paper “Oil & Security” Rocky Mountain Institute: “Winning the Oil Endgame” The Future of the Hydrogen Economy ( ) Fuel Ethanol: Background & Public Policy Issues (CRS Report for Congress, Dec. 2004)
 Fuel Ethanol: Background & Public Policy Issues (CRS Report for Congress, Dec. 2004)")
80
ETHANOL: MARKET PERSPECTIVE
Luiz Carlos Corrêa Carvalho Sugar and Alcohol Sectorial Chamber, Ministry of Agriculture, Brazil Assessing the Biofuels Option Joint Seminar of the International Energy Agency, the Brazilian Government and the United Nations Foundation Paris, 20 – 21 June 2005

81
Brazil: A Role Model

82
Nearly 8x increase in sales in only 2 years
Can Rapid Adoption of FFV Happen? New Car FFV Sales % 4% in Mar’03 50% in May’05 80% in Mar’06 Nearly 8x increase in sales in only 2 years

83
Consumer Price Ratio * São Paulo (SP) Source: Honorable Roberto Rodrigues, Minister of Agriculture, Brazil (Assessing Biofuels Conf., June 2005) SOURCE: MAPA
 SOURCE: MAPA.")
84
Ethanol: LEARNING CURVE
(producers BR) Gasoline (Rotterdam) (J Goldemberg, 2004)
 Gasoline. (Rotterdam) (J Goldemberg, 2004)")
85
Brazil sugar-cane/ethanol learning curve Liters of ethanol produced per hectare since between 1975 to 2004 30,000??

86
Ethanol Cost vs. Production Experience

87
The Ethanol application as vehicular fuel in Brazil.
Brazilian Automotive Industry Association - ANFAVEA Energy & Environment Commission Henry Joseph Jr.

88
LIFE CYCLE GHC EMISSIONS IN ETHANOL
PRODUCTION AND USE Kg CO2 equiv./ t cane Average Best Values Emissions 34,5 33,0 Avoided Emissions 255,0 282,3 Net Avoided Emissions 220,5 249,3 Anhydrous Ethanol 2,6 to 2,7 t CO2 equiv./m3 ethanol As a result, when emissions are compared upon replacement of gasoline and fuel oil with ethanol and sugar-cane bagasse, there is a saving or uptake of 2.6 tons of CO2 equivalent for anhydrous ethanol, and of 1.9 ton of CO2 equivalent for hydrous ethanol. This is the key to the success of biofuels! Source: Leal, Regis, CO2 Life Cycle Analysis of Ethanol Production and Use, LAMNET, Rome, may 2004

89
Comparative Energy Balance
Raw Material Total Energy Ratio Corn 1,21 Switchgrass 4,43 Sugarcane 8,32 The new world of biofuels has specific rules: there must be clearly positive life-cycle energy and life-cycle GHG emissions. Concerning raw materials, the first case shows sugar-cane with a great advantage. For every input energy unit, the production is 8.2 times bigger, on average. You can see results around 10,2 times! Source: Leal, Regis, CO2 Life Cycle Analysis of Ethanol Production and Use, LAMNET, Rome, may 2004

90
21,87 6,01 1 ETHANOL AND EMPLOYMENT ETHANOL “C” GASOLINE “A” GASOLINE
( IN THE PRODUCTION OF THE VEHICLE AND OF FUEL) VEHICLES RATIO OF EMPLOYMENTS ETHANOL 21,87 “C” GASOLINE 6,01 “A” GASOLINE 1 Another both interesting and appealing impact is the logic of the relation between the jobs created in the gasoline supply chain and those created in the ethanol supply chain when a vehicle is produced. The difference, which is several times more favorable to ethanol, is a decisive factor in the option to fuel FFVs with ethanol. It is always important to analyze the entire supply chain. The vehicle is the back-end of the analysis and the indication of the differences. Considering that an ethanol driven vehicle consumes, on average, 2.600 litres of ethanol per year ( one million litres of ethanol, per year, generates 38 direct jobs );for gasoline, spends 20% less fuel ( one million litres of gasoline, per year, generates 0,6 direct jobs); “C” gasoline contains 25% ethanol. Source: Copersucar/Unica/ANFAVEA/PETROBRAS
 VEHICLES. RATIO OF EMPLOYMENTS. ETHANOL. 21,87. C GASOLINE. 6,01. A GASOLINE. 1. Another both interesting and appealing impact is the logic of the relation between the jobs created in the gasoline supply chain and those created in the ethanol supply chain when a vehicle is produced. The difference, which is several times more favorable to ethanol, is a decisive factor in the option to fuel FFVs with ethanol. It is always important to analyze the entire supply chain. The vehicle is the back-end of the analysis and the indication of the differences. Considering that an ethanol driven vehicle consumes, on average, litres of ethanol per year ( one million litres of ethanol, per. year, generates 38 direct jobs );for gasoline, spends 20% less fuel. ( one million litres of gasoline, per year, generates 0,6 direct jobs); C gasoline contains 25% ethanol. Source: Copersucar/Unica/ANFAVEA/PETROBRAS.")
91
8. Relative Performance of Ethanol Engines

92
10. Comparative Raw Exhaust Emission

93
15. Comparative Aldehyde Emission

94
16. Comparative Evaporative Emission

101
Characteristics of an Ideal Crop: Miscanthus
Source :

102
Economics of Miscanthus Farming
Source:

103
Hydrogen vs. Ethanol Economics
Raw Material Costs: cost per Giga Joule (gj) = $11.2/gj (Lower cost than natural gas) = $2.3/gj (with 70% conversion efficiency) Hydrogen from electricity costly vs. Ethanol from Biomass Hydrogen from Natural Gas no better than Natural Gas Cost multiplier on hydrogen: distribution, delivery, storage Higher fuel cell efficiency compared to hybrids not enough! Hydrogen cars have fewer moving parts but more sensitive, less tested systems and capital cost disadvantage Reference: The Future of the Hydrogen Economy ( )
 = $11.2/gj (Lower cost than natural gas) = $2.3/gj (with 70% conversion efficiency) Hydrogen from electricity costly vs. Ethanol from Biomass. Hydrogen from Natural Gas no better than Natural Gas. Cost multiplier on hydrogen: distribution, delivery, storage. Higher fuel cell efficiency compared to hybrids not enough! Hydrogen cars have fewer moving parts but more sensitive, less tested systems and capital cost disadvantage. Reference: The Future of the Hydrogen Economy ( )")
104
Hydrogen vs. Ethanol Ethanol: US automakers balance sheets ill-equipped for hydrogen switchover Ethanol: No change in infrastructure in liquid fuels vs. gaseous fuels Ethanol: Current engine manufacturing/maintenance infrastructure Ethanol: switchover requires little capital Ethanol: Agricultural Subsidies are leveraged for social good Ethanol: Faster switchover- 3-5 years vs 15-25yrs Ethanol: Low technology risk Ethanol: Incremental introduction of new fuel Ethanol: Early carbon emission reductions

105
Three of Ten Important Sources
Stovers: 250m tons Winter Crops: 300m tons Soybeans: 350m tons Production of corn stover and stalks from other grains (wheats, oats) totals well over 250 million dry tons. A combination of different crop rotations and agricultural practices (e.g. reduced tillage) would appear to have potential for a large fraction of these residues to be removed. For example, although complete removal of corn stover would result in a loss of about 0.26 tons of soil carbon per year, cultivation of perennial crops (e.g. switchgrass, Miscanthus) adds soil carbon at a substantially higher rate. Thus, a rotation of switchgrass and corn might maintain or even increase soil fertility even with 100% stover removal. This, however, brings up questions about the length of time land might be grown in each crop, since switchgrass would benefit from longer times to distribute the cost of establishment while corn would benefit from short times to maintain productivity and decrease losses due to pests. It is likely that some crop other than switchgrass as it exists today would be best for incorporation into a relatively high frequency rotation with corn. Targets for crop development could be identified and their feasibility evaluated. Winter cover crops grown on 150 million acres = 300 million tons of cellulosic biomass. In recent years, U.S. soybean production has averaged about 1.2 tons of dry beans per acre annually. Given an average bean protein mass fraction of about 0.4, the annual protein productivity of soybean production is about 0.5 tons protein per acre. Perennial grass (e.g. switchgrass) could likely achieve comparable protein productivity on land used to grow soybeans while producing lignocellulosic biomass at about a rate of about 7 dry tons per acre annually. The limited data available suggest that the quality of switchgrass protein is comparable to soy protein, and technology for protein extraction from leafy plants is rather well-established. The 74 million acres currently planted in soybeans in the U.S. could, in principle, produce the same amount of feed protein we obtain from this land now while also producing over 520 million tons of lignocellulosic biomass. Alternatively, if new soy varieties were developed with increased above-ground biomass (option 4, Table 1), this could provide on the order of 350 million tons of lignocellulosic biomass – although soil carbon implications would have to be addressed. Source: Lee R. Lynd, “Producing Cellulosic Bioenergy Feedstocks from Currnently Managed Lands,” Source: Lee R. Lynd, Dartmouth; “Producing Cellulosic Bioenergy Feedstocks from Currently Managed Lands;” Draft-work-in-progress; October 7, 2005
 totals well over 250 million dry tons. A combination of different crop rotations and agricultural practices (e.g. reduced tillage) would appear to have potential for a large fraction of these residues to be removed. For example, although complete removal of corn stover would result in a loss of about 0.26 tons of soil carbon per year, cultivation of perennial crops (e.g. switchgrass, Miscanthus) adds soil carbon at a substantially higher rate. Thus, a rotation of switchgrass and corn might maintain or even increase soil fertility even with 100% stover removal. This, however, brings up questions about the length of time land might be grown in each crop, since switchgrass would benefit from longer times to distribute the cost of establishment while corn would benefit from short times to maintain productivity and decrease losses due to pests. It is likely that some crop other than switchgrass as it exists today would be best for incorporation into a relatively high frequency rotation with corn. Targets for crop development could be identified and their feasibility evaluated. Winter cover crops grown on 150 million acres = 300 million tons of cellulosic biomass. In recent years, U.S. soybean production has averaged about 1.2 tons of dry beans per acre annually. Given an average bean protein mass fraction of about 0.4, the annual protein productivity of soybean production is about 0.5 tons protein per acre. Perennial grass (e.g. switchgrass) could likely achieve comparable protein productivity on land used to grow soybeans while producing lignocellulosic biomass at about a rate of about 7 dry tons per acre annually. The limited data available suggest that the quality of switchgrass protein is comparable to soy protein, and technology for protein extraction from leafy plants is rather well-established. The 74 million acres currently planted in soybeans in the U.S. could, in principle, produce the same amount of feed protein we obtain from this land now while also producing over 520 million tons of lignocellulosic biomass. Alternatively, if new soy varieties were developed with increased above-ground biomass (option 4, Table 1), this could provide on the order of 350 million tons of lignocellulosic biomass – although soil carbon implications would have to be addressed. Source: Lee R. Lynd, Producing Cellulosic Bioenergy Feedstocks from Currnently Managed Lands, Source: Lee R. Lynd, Dartmouth; Producing Cellulosic Bioenergy Feedstocks from Currently Managed Lands; Draft-work-in-progress; October 7,")
106
Ethanol: LEARNING CURVE
(producers BR) Gasoline (Rotterdam) (J Goldemberg, 2004)
 Gasoline. (Rotterdam) (J Goldemberg, 2004)")
107
Tutorial

108
11. The Fossil Fuels Carbon Dioxide at Atmosphere Photosynthesis
lakes Oceans, Roots Breathing Fossil Fuels: Coal, Natural Gas, Oil Vegetable Garbage Soil and Organisms Breathing Animal Breathing Plants Breathing Photosynthesis Plants Photosynthesis of Algas Aquatic Life Breathing

Similar presentations


 Swap (slides 7-17)>")


 is a Washington based non-profit public educational organization dedicated to research and public.>")
