Download presentation
Presentation is loading. Please wait.

1
Airport & Airline Economics
Jeff Borowiec, Ph.D. Texas Transportation Institute If you want to be a millionaire, start with a billion dollars and open an airline. Soon enough you will be a millionaire. – Sir Richard Branson, Founder Virgin Atlantic Airlines

2
Outline Air Transportation Industry Airports Airlines
Background Significance Structure Cost/revenue framework Airports Where do airports get their money Who pays to operate/improve them How/where do they spend it Airlines Varied and complicated beasts Legacy vs. Low Cost Carriers Economic Characteristics Airspace (time permitting) Its impacts on airport and airlines and their economics Questions
 Its impacts on airport and airlines and their economics. Questions.")
3
State of the Industry Airline Bankruptcies

4
State of the Industry Mergers and Acquisitions

5
State of the Industry New Fees

6
The Airport System Airside vs. Landside

7
Airport Design Primary Design Elements Drive Economics
Runways Taxiways Terminal Area/Apron Pavements Airport Site Selection Navigational Aids Airspace Primary Design Guidance: AC Change 15 Passenger Terminals Landside Access Cargo Terminals Security Emergency Services

11
l

14
National Economic Benefits
Civil aviation contributed over $1.315 Trillion 11.5 million jobs $400 Billion in earnings. 5.6 percent of the total U.S. GDP Source FAA/The Economic Impact of Civil Aviation on the U.S. Economy December 2009

15
Importance of the Texas Airport System
Link to national transportation system Connects rural & urban populations Provides 784,000 jobs Generates $49 billion annually

16
Current Status of Industry
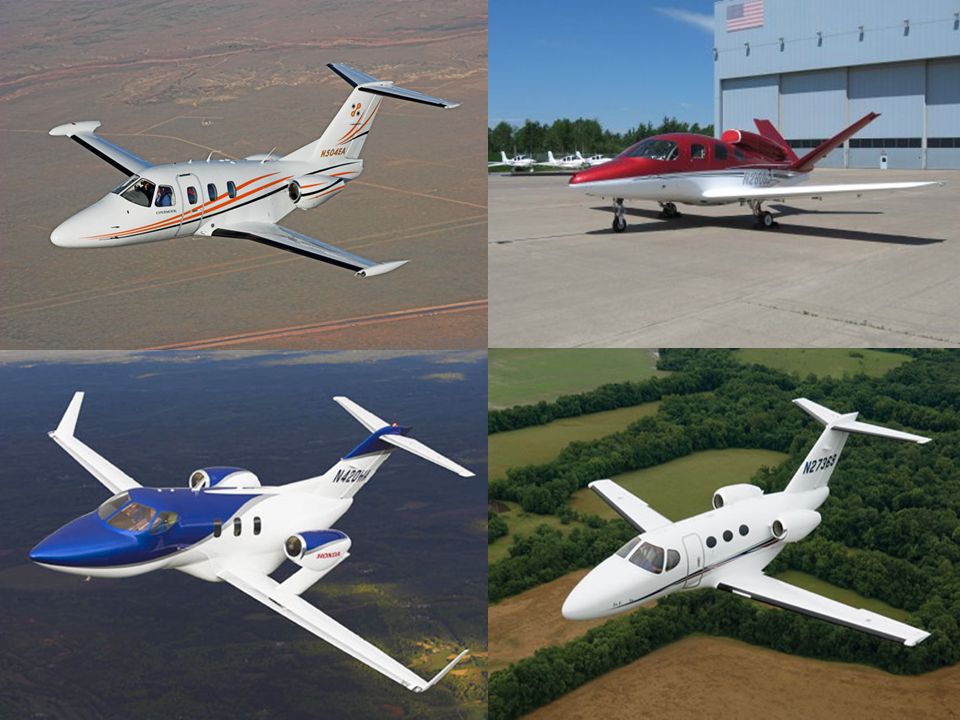
New Large Aircraft Very Light Jets – Increased Mobility/Air Taxi services SATS – Small Aircraft Transportation System Recovering Economy Growth in Air Cargo Dependent on Air Transportation System Fractional Ownership

17
Current Status of Industry
Industry consolidation Lower margins Increased Break-Even Load Factors Emerging Aircraft with better costs per seat (Larger RJs and Mainline aircraft) Fewer Small Communities with Air Service
 Fewer Small Communities with Air Service.")
18
Current Status of Industry
Half of U.S. airports depend on only one or two destinations to connect them with the air transportation system 44 percent of U.S. airports with at least 5 weekly departures are served by one carrier 39 percent of U.S. airports are served exclusively by turboprop aircraft which are in sharp decline

20
Air Transportation Network
AIRports + AIRplanes + AIRways = AIR Transportation Network Air traffic management is important because of the costs associated with delay

21
Air Transportation Network
Airports are usually locally owned Airlines are publicly held Airplanes are privately owned Airways are controlled by the federal government

22
Aviation Legislation Federal Government’s Role Dates to 1933 and the Civil Works Administration Federal Airport Act of 1946 Airport and Airway Development Act of 1970 Airport Development Aid Program Airport and Airway Improvement Act of 1982 Airport Improvement Program NPIAS airports only Airway Safety and Capacity Expansion Act of 1990 Passenger Facility Charges (PFCs)
")
23
Aviation Legislation U.S. Airline Deregulation Act of 1978
Fly where they want (route choice) Charge what they want (pricing) Resulted in: Hub and spoke network New entrants Increased competition Discount fares Growth in air travel Loyalty programs Certificate of public convenience and necessity/US DOT FAR Part 121 Operating certificate/FAA
 Charge what they want (pricing) Resulted in: Hub and spoke network. New entrants. Increased competition. Discount fares. Growth in air travel. Loyalty programs. Certificate of public convenience and necessity/US DOT. FAR Part 121 Operating certificate/FAA.")
24
Regulated…… International Aviation Essential Air Service Safety
Open Skies agreements Essential Air Service DOT/Subsidies to carriers serving domestic locations that are economically challenging Safety FAA

25
Air Transportation Network
Governmental Entities FAA Primarily a SAFETY agency Airport Improvement Program Air Traffic Management NTSB Accident Investigation State Aviation Agencies Block Grant Program

26
Airports Commercial Service Reliever General Aviation

27
Airports Commercial Service Primary: >10,000 enplaned passengers
Non-primary: 2500->10,000 enplaned passengers Hub classification: Large hub: 1% or more of total national enplanements Medium hub: 0.25% to 0.99% Small hub: 0.05% to 0.24% Non-hub: less than 0.05% 2009 National Enplanements = 700 million

28
Airports General Aviation
Everything that is not scheduled passenger service or military Relievers Metropolitan airports that reduce congestion at commercial service airports in the area General aviation airports Airport role Functional class Design standard

29
Airport Ownership Local Governments Private Corporations
Cities Counties Airport Authorities Private Corporations State Governments

30
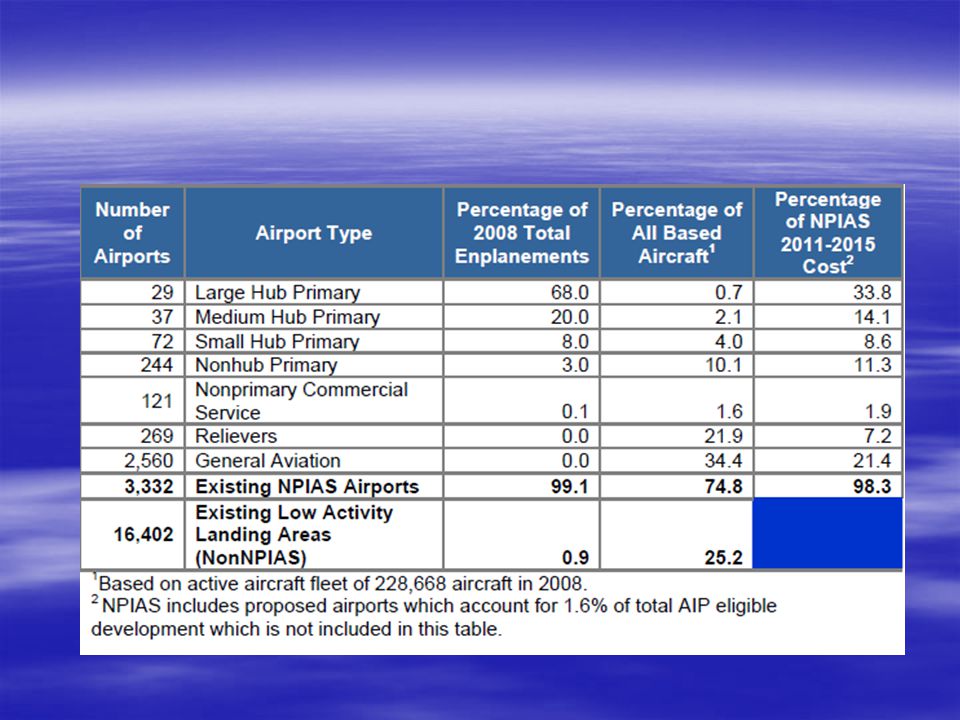
NPIAS National Plan of Integrated Airport Systems
The plan identifies 3,332 existing and 48 proposed public-use airports that are significant to national air transportation and therefore, eligible to receive grants under the Federal Aviation Administration Airport Improvement Program (AIP). The report estimates that over the next 5 years, there will be $52.2 billion of AIP eligible infrastructure development for all segments of civil aviation.
. The report estimates that over the next 5 years, there will be $52.2 billion of AIP eligible infrastructure development for all segments of civil aviation.")
31
NPIAS

32
Airport Finance – Revenues

33
Airport Finance - Expenses
NPIAS Cost by Type of Development – $49.7 B

34
Airport Finance - Expenses
NPIAS Cost by Airport Type

35
Airport Finance: Revenue and Expenses

38
Major U.S. Airport Concentration

39
Texas is BIG!

40
What is the Texas Airport System?
300 Airports & 3 Heliports 26 Primary Commercial Service 1 Non-Primary Commercial Service 25 Relievers 248 General Aviation Non-Relievers 3 Heliports

41
Texas Airport System

42
Airport Finance Who Pays? FAA Commercial Airports
Airport Improvement Program Must meet eligibility requirements Aviation user taxes (i.e., passenger ticket taxes) Commercial Airports Passenger Facility Charges (reduces AIP $) Revenue from advertising, parking, concessions, access fees State Aviation Agencies Airport Sponsors (owners) Local governments
 Commercial Airports. Passenger Facility Charges (reduces AIP $) Revenue from advertising, parking, concessions, access fees. State Aviation Agencies. Airport Sponsors (owners) Local governments.")
43
Who Pays…You Do!

44
Ticket Tax Example

45
Airport Finance Airport funding comes from several sources:
Airport bonds 59% AIP grants 21% Passenger Facility Charge 13% State and local funding 4% Airport revenue 4% Source: ASCE/FAA

46
Airline Economics Characteristics Activity Metrics
Impacts of Rising Fuel Prices

47
Airline Economics Industry Characteristics Service Industry
Capital-Intensive Labor-Intensive

48
Airline Structure Operations and Maintenance Sales and Marketing
Reservations and Ticketing Management and Administrative Staff

49
Airline Metrics available seat mile (ASM) One seat transported one mile; the most common measure of airline seating capacity or supply. For example, an aircraft with 100 passenger seats, flown a distance of 100 miles, produces 10,000 ASMs. Sometimes measured in available seat kilometers (ASKs). revenue passenger mile (RPM) One fare-paying passenger transported one mile; the most common measure of demand for air travel. Sometimes measured in revenue passenger kilometers (RPKs).
 One seat transported one mile; the most common measure of airline seating capacity or supply. For example, an aircraft with 100 passenger seats, flown a distance of 100 miles, produces 10,000 ASMs. Sometimes measured in available seat kilometers (ASKs). revenue passenger mile (RPM) One fare-paying passenger transported one mile; the most common measure of demand for air travel. Sometimes measured in revenue passenger kilometers (RPKs).")
50
Airline Metrics unit revenue The average amount of revenue received by the airline per unit of capacity available for sale. Most often used to measure the effectiveness with which revenue management activity balances price and volume to generate passenger revenue per ASM, known as PRASM or RASM. yield The average amount of revenue received per revenue passenger mile (RPM) or revenue ton mile (RTM), net of taxes.
 or revenue ton mile (RTM), net of taxes.")
51
Airlines Majors Nationals Regionals revenue > $1B
revenue between $100M and $1B Regionals limited service/specific markets/city-pairs fastest growing since deregulation

52
Airlines by Category

53
Top 25 U.S. Airlines

54
Determinants of Demand
Demand = Revenue Passenger Miles (RPMs) Ticket price Competitor’s ticket price Passenger income State of the economy Availability of other modes Customer loyalty In-flight amenities Frequency of service Safety Random factors – SARS, 9/11, terrorism threat
 Ticket price. Competitor’s ticket price. Passenger income. State of the economy. Availability of other modes. Customer loyalty. In-flight amenities. Frequency of service. Safety. Random factors – SARS, 9/11, terrorism threat.")
55
Characteristic of Demand
Constant fluctuation Cyclicality Seasonality and peaking Directional flow Perishability Schedule wait time Airport access time Flight time Hub connection time Denied boarding time

56
Factors Affecting Supply
Supply = available seat miles (ASMs) Ticket price Price of resources – aircraft, fuel, labor, maintenance Technological improvements Behavior of the competition Random factors Government regulation
 Ticket price. Price of resources – aircraft, fuel, labor, maintenance. Technological improvements. Behavior of the competition. Random factors. Government regulation.")
57
Characteristics of Supply
Two characteristics that shape the industry are: Seasonality Pull existing capacity off of other routes Have excess/idle capacity somewhere in system Rigidity Can be difficult to reduce/increase supply dramatically Schedules are created six months in advance

58
Airline Markets Market Continuum

59
Evolution of U.S. Airline Industry

60
Major U.S. Airline Concentration

61
Recent Airline Mergers Airlines/Announced/Closed/Resulting Entity

62
Airline Costs

63
Airline Cost Trends

64
Airline Cost Index

65
Airlines Keeping Pace?

66
Airline Load Factors

68
Airline Costs by Function

69
Airline Costs by Category

70
Airline Fuel Costs

71
U.S. Air Carrier Traffic Statistics Through November 2010
Twelve Months - System December November 2010 December November 2009 Scheduled Non-Scheduled Total Revenue Passenger Enplanements (000) 718,719 5,845 724,564 704,253 5,390 709,643 Revenue Passenger Miles (000) 795,432,424 11,031,526 806,463,950 769,711,680 10,536,280 780,247,960 Available Seat Miles (000) 969,734,233 19,390,318 989,124,551 959,327,054 18,125,515 977,452,569 Passenger Load Factor (%) 82.03 56.89 81.53 80.23 58.13 79.82 Revenue Freight Ton Miles (000) 7,127,210 66,012 7,193,222 5,615,056 53,199 5,668,255 Total Revenue Ton Miles (000) 87,359,300 1,169,172 88,528,472 83,316,104 1,106,845 84,422,949 Available Ton Miles (000) 140,489,207 3,136,906 143,626,113 138,450,289 2,909,910 141,360,199 Ton Mile Load Factor (%) 62.18 37.27 61.64 60.18 38.04 59.72 Revenue Departures Performed 9,500,010 170,465 9,670,475 9,567,245 153,963 9,721,208 Revenue Aircraft Miles Flown (000) 6,927,463 98,244 7,025,707 6,862,290 89,339 6,951,629 Revenue Aircraft Hours (Airborne) 16,436,281 262,510 16,698,791 16,426,716 238,801 16,665,517 SOURCE: Bureau of Transportation Statistics, T-100 Market and Segment (Excludes all-cargo services. Includes domestic and international)
 718,719. 5, , ,253. 5, ,643. Revenue Passenger Miles (000) 795,432, ,031, ,463, ,711, ,536, ,247,960. Available Seat Miles (000) 969,734, ,390, ,124, ,327, ,125, ,452,569. Passenger Load Factor (%) Revenue Freight Ton Miles (000) 7,127, ,012. 7,193,222. 5,615, ,199. 5,668,255. Total Revenue Ton Miles (000) 87,359,300. 1,169, ,528, ,316,104. 1,106, ,422,949. Available Ton Miles (000) 140,489,207. 3,136, ,626, ,450,289. 2,909, ,360,199. Ton Mile Load Factor (%) Revenue Departures Performed. 9,500, ,465. 9,670,475. 9,567, ,963. 9,721,208. Revenue Aircraft Miles Flown (000) 6,927, ,244. 7,025,707. 6,862, ,339. 6,951,629. Revenue Aircraft Hours (Airborne) 16,436, , ,698, ,426, , ,665,517. SOURCE: Bureau of Transportation Statistics, T-100 Market and Segment (Excludes all-cargo services. Includes domestic and international)")
72
U.S. Airlines Annual Pre-Tax Earnings

73
Airline Revenues

78
Low Cost Carriers Carry 1/3 of all US Passengers
LCC Presence in Largest 1,000 Domestic City Pairs Has Increased by More Than 30% Since 2000 Low Cost Carriers Compete In Markets Accounting For 80% Of All Domestic Air Travelers Legacy Carrier Operating Costs Have Gone Down and LCC Costs Have Gone Up

79
Fuel Price Impact

80
Cyclical?

81
Airline Operating Statistics

82
Top 25 Airlines

83
Top U.S. City Pairs

84
Top U.S. Travel Markets

85
Airline Operating Trends

86
Texas Aviation Activity Passenger Enplanements

87
Texas Commercial Service Enplanements

88
Texas Aviation Activity Texas Air Carrier Enplanements (% of U.S.)
")
89
Growth Going Forward U.S. Commercial Air Carriers 2011-2031
Supply (Domestic ASMs annual percentage growth) Mainline 2.8 Regionals 4.1 Demand (Domestic RPMs annual percentage growth) Mainline 2.9 Regionals 4.2 Profitability tied to operating costs Oil
 Mainline 2.8. Regionals 4.1. Demand (Domestic RPMs annual percentage growth) Mainline 2.9. Regionals 4.2. Profitability tied to operating costs Oil.")
90
Compelling Issues Influencing/Affecting Air Transportation
Future of airline industry/consolidation Future funding/authorization User fees Other Fees Security Alternative fuels Workforce development Land use/development/encroachment Privatization – efficiency, capital infusion, conversion to tax paying entity NextGen – advanced technologies/air space management/ADS-B

91
Jeff Borowiec

92
Air Traffic Management
Air Traffic Control VFR / IFR Instrument Approaches Landing Non-precision approach/Precision approach Terminal Airspace

93
Delay Costs

94
Air Traffic Management
Phases of Flight ATC Tower TRACON ARTCC RVSM Area of greatest potential for efficiency gains

95
Instrument Approaches

96
Air Traffic Management

97
Air Traffic Management

98
GPS and WAAS The Global Positioning System (GPS) is a system of 24 satellites operated by the Department of Defense (DOD) under joint DOD/Department of Transportation (DOT) management. Wide Area Augmentation System uses a series of ground stations to augment or enhance the GPS signal increasing its accuracy. Allowed for new instrument approaches and reduced minimums.
 is a system of 24 satellites operated by the Department of Defense (DOD) under joint DOD/Department of Transportation (DOT) management. Wide Area Augmentation System uses a series of ground stations to augment or enhance the GPS signal increasing its accuracy. Allowed for new instrument approaches and reduced minimums.")
99
Glass Cockpits B-777 Garmin 1000 Cirrus S-22 G550

100
ADS-B An air traffic system that will provide more precise surveillance data to air traffic controllers and to ADS-B equipped aircraft at the same time. This information will significantly enhance pilots’ situational awareness.

101
ADS-B ADS-B uses Global Navigation Satellite System (GNSS) position information processed by aircraft avionics to transmit the aircraft’s location to ground receivers for presentation to air traffic controllers. Pilots with ADS-B avionics will receive traffic and weather information on their cockpit displays. Controllers will see the information on automation displays they are already using, so little additional training will be needed. ADS-B signals are transmitted once per second, providing a more accurate tracking system for pilots and controllers.
 position information processed by aircraft avionics to transmit the aircraft’s location to ground receivers for presentation to air traffic controllers. Pilots with ADS-B avionics will receive traffic and weather information on their cockpit displays. Controllers will see the information on automation displays they are already using, so little additional training will be needed. ADS-B signals are transmitted once per second, providing a more accurate tracking system for pilots and controllers.")
102
ADS-B Improved efficiency Improved situational awareness
Improved safety Greater ATC predictability Cost savings

103
Air Traffic Management

104
FAA Part 77 Imaginary Surfaces
Physical Obstacles Ensure and preserve safety of operations in the airspace in the immediate vicinity of airports Surfaces protect approaches to runways, takeoffs, and missed approaches from obstructions Objects can be man-made or natural They impact height-hazard zoning restrictions and could affect construction costs/airport viability

105
FAA Part 77 Imaginary Surfaces

107
Compelling Issues Affecting Air Transportation
Future of airline industry Future funding/authorization User fees Alternative fuels Workforce development Land use/development/encroachment Privatization – efficiency, capital infusion, conversion to tax paying entity NextGen – advanced technologies/air space management

108
Jeff Borowiec

Similar presentations


 was an analysis designed to help the Commonwealth identify a.>")


 for Aviation United Nations International Committee on GNSS 1 - 2 December, 2005 Ken Alexander United States.>")

 Saulo Da Silva>")

