Download presentation
Presentation is loading. Please wait.

2
MODIFY THIS SLIDE FOR ACTUAL PRESENTER, DELETE THIS BAR AFTER MODIFICATION

3
MODIFY THIS SLIDE FOR COMMUNITY PRESENTER / AND UPDATE CONTACT DETAILS / CERTIFICATION LOGO MOVE THE SLIDE RIGHT TO THE DEMO, HAVE PRESENTER INTRODUCE THE COMMUNITY OPERATIVE

4
Analysis Services Reporting Services Integration Services Master Data Services SharePoint Collaboration Excel Workbooks PowerPivot Applications SharePoint Dashboards & Scorecards Most widely deployed EIM & BI Platform Most Broadly adopted Productivity & Collaboration Tools Odata Feeds LOB Apps

5
Familiar Excel Experience Powerful Data Mashups In-Memory Performance Highly Visual Design Experience Rich Metadata-Driven Interactivity Presentation-Ready at All Times Easily Access Reports & Dashboards Create Alerts From Published Reports Collaborate on BI Insights

7
change data and layout Easily change data and layout with quick clicks CollaborateCollaborate with full interactivity Share dynamic Share dynamic reports quickly and easily From Authoring to Presentation in Clicks Powered by Silverlight Managed & Discoverable

8
Office Ribbon Familiar Office Ribbon drag and drop Simply drag and drop objects to see data come to life semantic model Access to semantic model Shapes and data Customize Shapes and data

9
DESIGNED FOR A NEW WAVE OF INFORMATION WORKERS VISUAL EMBELLISHMENTS SUPPORT & ENRICH DATA STORY TELLING 1-way 1-way to do things 2 clicks 2 clicks to Return on Investment (ROI) done in contextAll tasks done in context happens on the canvasEverything happens on the canvas, with the data Less is more right defaultChoose the right default, by default Easy for the userEasy for the user, hard on us Highly performing Highly performing and efficient Power View UI Design Principles change data and layout Easily change data and layout with quick clicks CollaborateCollaborate with full interactivity Share dynamicShare dynamic reports quickly and easily
 done in contextAll tasks done in context happens on the canvasEverything happens on the canvas, with the data Less is more right defaultChoose the right default, by default Easy for the userEasy for the user, hard on us Highly performing Highly performing and efficient Power View UI Design Principles change data and layout Easily change data and layout with quick clicks CollaborateCollaborate with full interactivity Share dynamicShare dynamic reports quickly and easily")
10
PowerPivot Analyzing Massive Data Volumes in Excel With a few mouse clicks, a user can create and publish intuitive and interactive self-service analysis solutions. PowerPivot for Excel PowerPivot for SharePoint

12
SQL Server Analysis Services Future Roadmap BI Semantic Model Analysis Services: SQL Server 2012 Goal #1 Continue to provide best-in-class tools for BI specialists Goal #2 Extend the reach of BI tools to a broader base of IT professionals and developers Goal #3 Provide a single model for creating BI solutions that is transparent to client tools Goal #4 Support the full spectrum of BI solutions, including personal, team, and corporate contexts

13
ANALYSIS SERVICES ARCHITECTURE Excel Services PowerPivot for SharePoint (Analysis Services) PowerPivot for SharePoint (Analysis Services) Excel Internet Explorer Analysis Services BI Semantic Model SharePoint Reporting Services Third Party Apps PowerPivot for Excel xlsx SQL Server Data Tools (Formertly BIDS) Power View
 PowerPivot for SharePoint (Analysis Services) Excel Internet Explorer Analysis Services BI Semantic Model SharePoint Reporting Services Third Party Apps PowerPivot for Excel xlsx SQL Server Data Tools (Formertly BIDS) Power View")
15
SophisticatedSophisticated Design Environment Report Viewer Controls Rich Design Capabilities Productive Authoring Re-use of insightsRe-use of insights Flexible layout VisualdataVisual data representation Highly InteractiveHighly Interactive Rich PresentationRich Presentation EmbeddedOperationalBusiness Report DesignerReport BuilderPower View

16
Increase IT efficiency: Familiar Technologies for Authoring, Sharing, Security and Compliance Visualize system performance and usage Find out what data sources are being used!!! PowerPivot is great for IT: Track the usage of PowerPivot Objects Discover mission- critical applications

17
PowerPivot Summary Integrate data from multiple sources Analyze large volumes of data Powerful BI capabilities within familiar tool Thin client collaboration Manage rogue BI

18
SQL Server Hands-on- Labs SQLSERVERLAUNCH.COM

20
Interactive, web-based authoring and sharing of information Familiar Microsoft Office design patterns Powerful data layout with banding, callout and small multiples visualizations Fully integrated with PowerPivot Drive greater insight through smart and powerful querying Zero configuration highlighting and filtering Animated trending and comparisons Interactive Presentation turns pervasive information into persuasive information Deliver and collaborate through SharePoint Full screen presentation mode for interactive boardroom session

21
SharePoint FarmSharePoint Farm Web Front EndApp Server Data sources SQL Server BISM ModelPower View client Excel PowerPivot Model

22
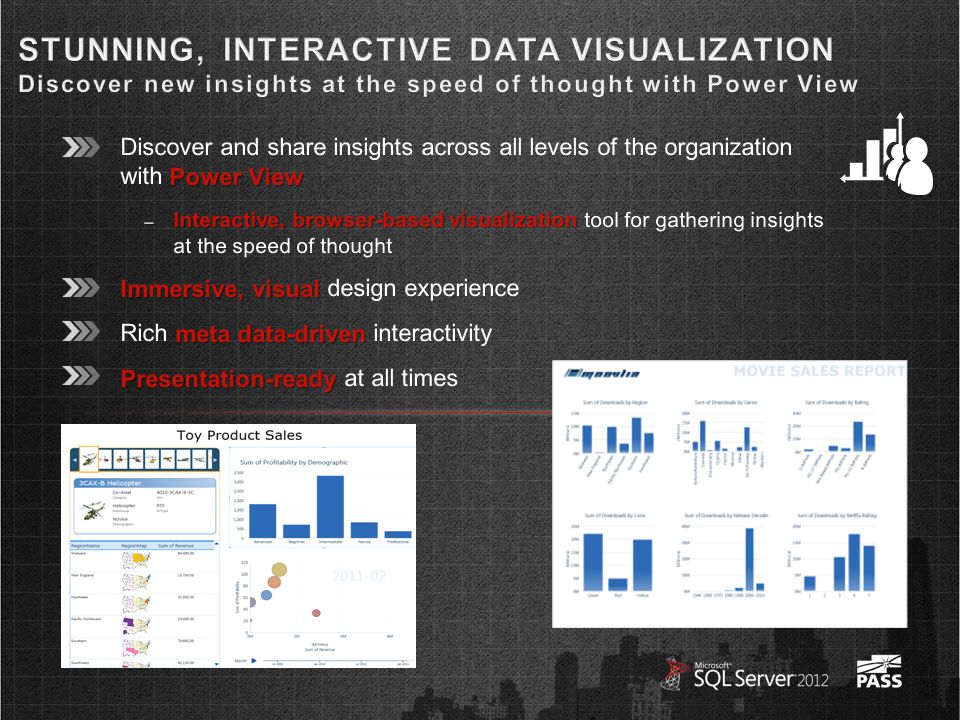
POWER VIEW Highly visual Highly visual design experience metadata-drivenRich metadata-driven interactivity Presentation-readyPresentation-ready at all times END USER ALERTING operational or ad-hoc Defined from within operational or ad-hoc reports AlertIntuitive Alert rules self-managedAlerts self-managed through SharePoint XLS/WORD 2007/2010 ENABLED AS SHAREPOINT SHARED SERVICE Built-in scale-out Built-in scale-out for RS Service Apps Cross-farmSharePoint Cross-farm reporting backup & recover Integrated backup & recovery, ULS logging, PowerShell etc. Managed Self Service BI – Corporate BIManaged Self Service BI – Corporate BI

Similar presentations