Download presentation
Presentation is loading. Please wait.

1
The challenge: Asset pricing:bubbles fire sales liquidity spirals segmented markets Corporate/macro: financing/capital constraints

2
Investor Security class Investor Intermediary DebtEquity Intermediary ? ? Other assets Segmented markets Intermediated markets Security class Investor DebtEquity Other assets

3
Bubbles: Definitions and facts

10
Home Price-to-Rent: First American, Case-Shiller, FHFA http://www.deptofnumbers.com/affordability/us/

12
1. Consumption Habits are one model of time-varying risk premium Frictionless macro asset pricing: A useful benchmark or a hopeless anachronism? 2. Investment I/k=f(Q)
.")
16
AA nonfinancial fine. dysfunctional market or credit risk premium

19
Arbitrage The cake, or the frosting?

20
Source: Fontana (2010)
")
21
Source: Fontana 2010

22
Source: Baba and Packer 2008

25
Banks, credit channel, financial frictions

26
Interest rate Supply (savings) Demand (investment, mortgages) A credit crunch: Banking system cannot make new loans. System Doesnt Work Loans Capital requirement

27
Interest rate Loans Supply Of risky debt Demand A fall in loans need not mean a credit crunch View 3: Investor Fear + Recession

28
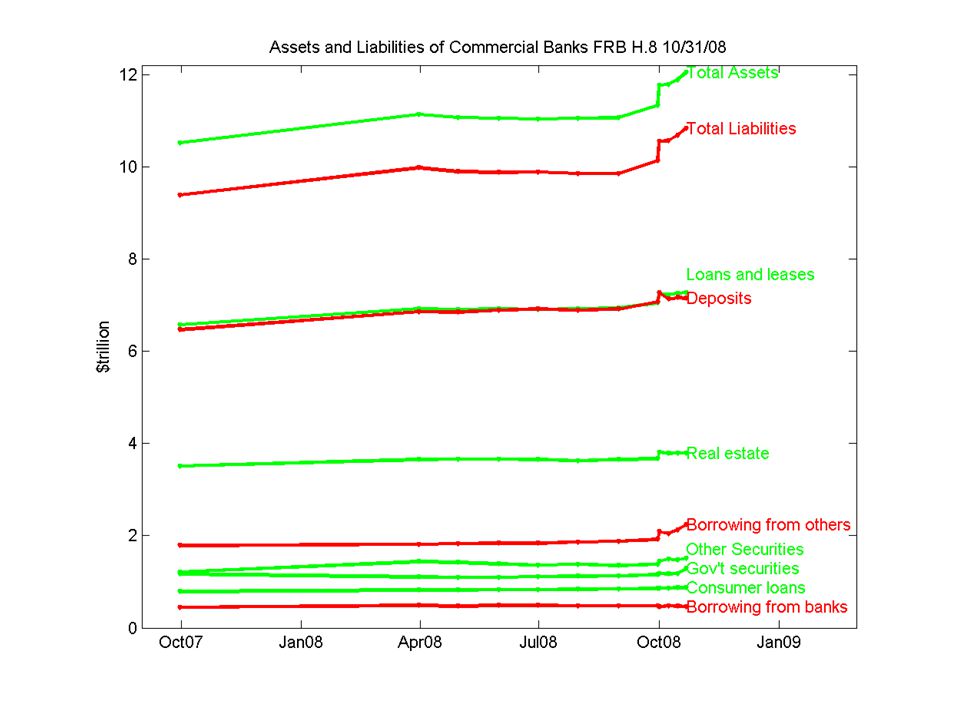
r Loan r MortgageConsumerBusinessFederalFinancial 06/Q11184658623101379 07/Q17691209832671493 08/Q1251120763412872 08/Q2-32101628310941 08/Q3-2413845120781126 08/Q4-163-8318521551222 Flow of new lending Broken intermediary system? Banks or securitized debt markets? Higher risk aversion, less demand? Banks or securitized debt markets? Borrowing Does Decline, a lot! Flow of funds ($billion)
.")
36
Firm Writedown & Loss Capital Raised Citigroup Inc.*60.871.1 Wachovia Corporation*52.711 Merrill Lynch & Co.52.229.9 Washington Mutual Inc.45.612.1 UBS AG44.228 HSBC Holdings Plc27.45.1 Bank of America Corp.21.220.7 JPMorgan Chase & Co.18.819.7 Morgan Stanley*15.714.6 IKB Deutsche Industriebank AG14.812.2 Royal Bank of Scotland Group Plc14.123.1 Lehman Brothers Holdings Inc.13.813.9 Credit Suisse Group AG10.43 Deutsche Bank AG10.46.1 Wells Fargo & Company105.8 Credit Agricole S.A.8.88.5 Barclays Plc7.617.9 Canadian Imperial Bank of Commerce7.22.8 Fortis*7.123.1 Bayerische Landesbank6.90 HBOS Plc6.87.2 ING Groep N.V.6.74.6 Societe Generale6.69.4 Mizuho Financial Group Inc.6.10 National City Corp.5.48.9 Natixis5.311.8 Indymac Bancorp Inc4.90 Goldman Sachs Group Inc.4.910.6 ………… TOTAL590.8434.2 Banks Can And Do Raise Capital! (source: Bloomberg.com)
.")
37
Banks Can and Do Raise Capital Source :Anil Kashyap Includes Treasury Purchase

38
Want to lend but cant? Vs. no good borrowers, higher r? Little decline in banking system lending. Banks can and do raise equity. Banks can and do fail / get taken over. Treasury purchase/debt guarantee did not stop it in tracks. Recapitalized banks pay dividends, buy other banks. High risk premiums in nonfinancial, non-intermediated assets. So…why is borrowing so much lower? Summary: Bank constraint vs. Credit market Or risk premium view r Loan r

39
US Non-Agency MBS Issuance

42
. 1930 2006: 2008

Similar presentations


 Households Firms Government Foreigners Financial Markets.>")


 Goldman Sachs (Bank Holding) JP Morgan Chase (Bear Stearns and Wa.Mutual) Morgan.>")


