Download presentation
Presentation is loading. Please wait.

1
Racism and Health: Collecting Evidence to address root causes of disparities

2
Camara Phyllis Jones, MD, MPH, PhD Research Director on Social Determinants of Health Emerging Investigations and Analytic Methods Branch Division of Adult and Community Health National Center for Chronic Disease Prevention and Health Promotion Coordinating Center for Health Promotion Centers for Disease Control and Prevention The findings and conclusions in this presentation are those of the author and do not necessarily represent the views of the Centers for Disease Control and Prevention

3
Acknowledgments Benedict Truman, MD, MPH Associate Director for Science Office of Minority Health and Health Disparities Centers for Disease Control and Prevention Susan Rumisha Project Imhotep Intern, Summer 2005 Public Health Sciences Institute, Morehouse College and National Institute for Medical Research, Dar es Salaam, Tanzania

4
What is racism?

5
A system

6
A system of structuring opportunity and assigning value What is racism?

7
A system of structuring opportunity and assigning value based on the social interpretation of phenotype (race) What is racism?
 What is racism")
8
A system of structuring opportunity and assigning value based on the social interpretation of phenotype (race) Unfairly disadvantages some individuals and communities What is racism?
 Unfairly disadvantages some individuals and communities What is racism")
9
A system of structuring opportunity and assigning value based on the social interpretation of phenotype (race) Unfairly disadvantages some individuals and communities Unfairly advantages other individuals and communities What is racism?
 Unfairly disadvantages some individuals and communities Unfairly advantages other individuals and communities What is racism")
10
A system of structuring opportunity and assigning value based on the social interpretation of phenotype (race) Unfairly disadvantages some individuals and communities Unfairly advantages other individuals and communities Saps the strength of the whole society through the waste of human resources What is racism? Source: Jones CP, Phylon 2003

11
Reactions to Race module Six-question optional module on the Behavioral Risk Factor Surveillance System Piloted in 2002 Now available to all states

12
States using Reactions to Race Arkansas2004 California2002 Colorado2004 Delaware200220042005 District of Columbia2004 Florida2002 Mississippi2004 New Hampshire2002 New Mexico2002 North Carolina2002 Ohio20032005 Rhode Island2004 South Carolina20032004 Wisconsin20042005

13
Arkansas, Colorado, Delaware, District of Columbia, Mississippi, Rhode Island, South Carolina, Wisconsin States using Reactions to Race module on 2004 BRFSS

14
General health status Would you say that in general your health is: Excellent Very good Good Fair Poor

15
Socially-assigned race How do other people usually classify you in this country? Would you say: White Black or African-American Hispanic or Latino Asian Native Hawaiian or Other Pacific Islander American Indian or Alaska Native Some other group

19
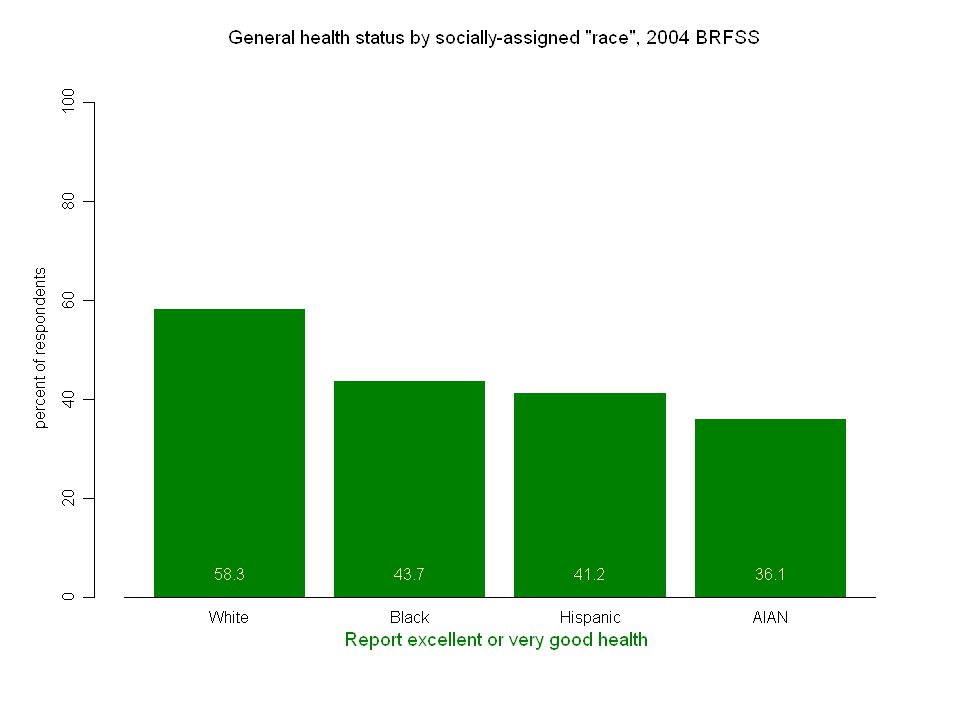
General health status and race White social experience associated with better health

20
Self-identified ethnicity Are you Hispanic or Latino? Yes No

21
Self-identified race Which one or more of the following would you say is your race? White Black or African-American Asian Native Hawaiian or Other Pacific Islander American Indian or Alaska Native Other Which one of these groups would you say best represents your race?

22
Self-identified race/ethnicity White No to Hispanic/Latino ethnicity question Only one response to race question, White Black No to Hispanic/Latino ethnicity question Only one response to race question, Black Hispanic Yes to Hispanic/Latino ethnicity question Any response to race question American Indian/Alaska Native No to Hispanic/Latino ethnicity question Only one response to race question, AI/AN

23
White 27,034 Black 5,333 Hispanic 1,138 AIAN 191 White96.0 0.5 7.116.2 Black 0.193.7 4.2 7.3 Hispanic 1.5 1.482.2 7.9 AIAN 0.5 0.4 1.856.5... 1.9 4.0 4.612.0 How self-identify Two measures of race How usually classified by others

24
WhiteBlackHispanicAIAN... White 26,373 98.4 0.1 0.3 0.1 1.1 How self-identify Two measures of race How usually classified by others

25
WhiteBlackHispanicAIAN... White 26,373 98.4 0.1 0.3 0.1 1.1 Black 5,246 0.595.3 0.9 0.3 3.0 How self-identify Two measures of race How usually classified by others

26
WhiteBlackHispanicAIAN... White 26,373 98.4 0.1 0.3 0.1 1.1 Black 5,246 0.595.3 0.9 0.3 3.0 Hispanic 1,528 26.4 4.761.3 1.0 6.6 How self-identify Two measures of race How usually classified by others

27
WhiteBlackHispanicAIAN... White 26,373 98.4 0.1 0.3 0.1 1.1 Black 5,246 0.595.3 0.9 0.3 3.0 Hispanic 1,528 26.4 4.761.3 1.0 6.6 How self-identify Two measures of race How usually classified by others

28
0 20 40 60 80 100 39.8 53.7 58.6 percent of respondents Report excellent or very good health Hispanic-HispanicHispanic-WhiteWhite-White General health status, by self-identified and socially-assigned "race", 2004

29
0 20 40 60 80 100 39.8 58.6 percent of respondents Report excellent or very good health Hispanic-HispanicWhite-White General health status, by self-identified and socially-assigned "race", 2004 Test of H 0 : No difference in proportions reporting excellent or very good health Hispanic-Hispanic versus White-White p < 0.0001

30
0 20 40 60 80 100 39.8 53.7 percent of respondents Report excellent or very good health Hispanic-HispanicHispanic-White General health status, by self-identified and socially-assigned "race", 2004 Test of H 0 : No difference in proportions reporting excellent or very good health Hispanic-Hispanic versus Hispanic-White p = 0.0019

31
0 20 40 60 80 100 53.7 58.6 percent of respondents Report excellent or very good health Hispanic-WhiteWhite-White General health status, by self-identified and socially-assigned "race", 2004 Test of H 0 : No difference in proportions reporting excellent or very good health Hispanic-White versus White-White p = 0.1895

32
0 20 40 60 80 100 39.8 53.7 58.6 percent of respondents Report excellent or very good health Hispanic-HispanicHispanic-WhiteWhite-White General health status, by self-identified and socially-assigned "race", 2004 20.8 17 13.6 percent of respondents Report fair or poor health

33
WhiteBlackHispanicAIAN... White 26,373 98.4 0.1 0.3 0.1 1.1 Black 5,246 0.595.3 0.9 0.3 3.0 Hispanic 1,528 26.4 4.761.3 1.0 6.6 AIAN 321 45.5 6.9 6.533.6 7.5 How self-identify Two measures of race How usually classified by others

34
WhiteBlackHispanicAIAN... White 26,373 98.4 0.1 0.3 0.1 1.1 Black 5,246 0.595.3 0.9 0.3 3.0 Hispanic 1,528 26.4 4.761.3 1.0 6.6 AIAN 321 45.5 6.9 6.533.6 7.5 How self-identify Two measures of race How usually classified by others

35
0 20 40 60 80 100 32 52.6 58.6 percent of respondents Report excellent or very good health AIAN-AIANAIAN-WhiteWhite-White General health status, by self-identified and socially-assigned "race", 2004

36
0 20 40 60 80 100 32 58.6 percent of respondents Report excellent or very good health AIAN-AIANWhite-White General health status, by self-identified and socially-assigned "race", 2004 Test of H 0 : No difference in proportions reporting excellent or very good health AIAN-AIAN versus White-White p < 0.0001

37
0 20 40 60 80 100 32 52.6 percent of respondents Report excellent or very good health AIAN-AIANAIAN-White General health status, by self-identified and socially-assigned "race", 2004 Test of H 0 : No difference in proportions reporting excellent or very good health AIAN-AIAN versus AIAN-White p = 0.0122

38
0 20 40 60 80 100 52.6 58.6 percent of respondents Report excellent or very good health AIAN-WhiteWhite-White General health status, by self-identified and socially-assigned "race", 2004 Test of H 0 : No difference in proportions reporting excellent or very good health AIAN-White versus White-White p = 0.3070

39
0 20 40 60 80 100 32 52.6 58.6 percent of respondents Report excellent or very good health AIAN-AIANAIAN-WhiteWhite-White General health status, by self-identified and socially-assigned "race", 2004 20.6 19.2 13.6 percent of respondents Report fair or poor health

40
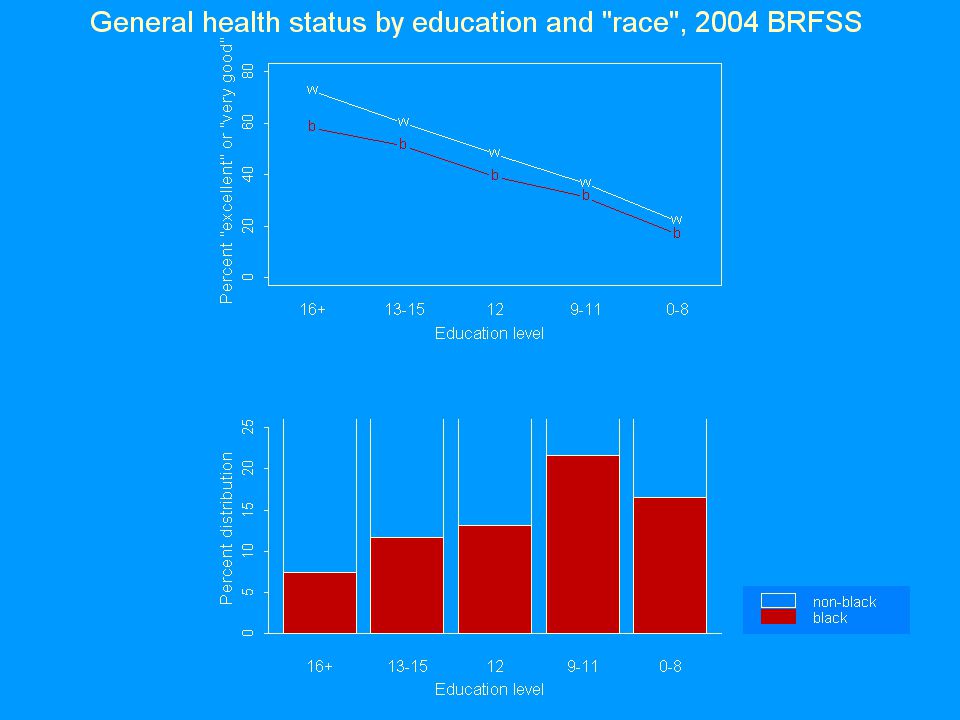
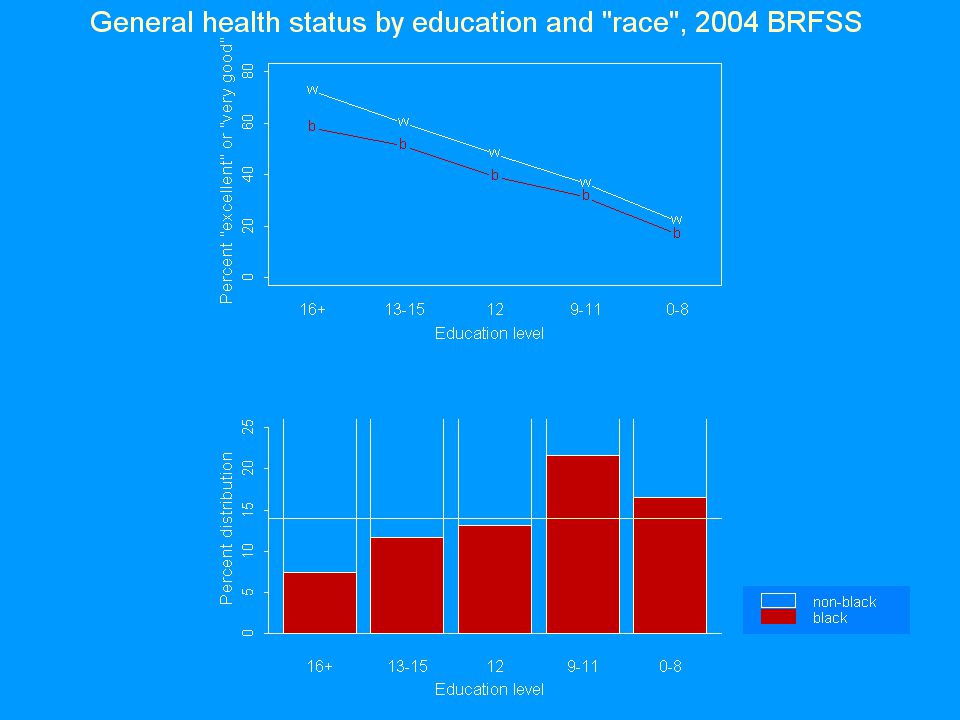
General health status and race White social experience associated with better health Even within the same self-identified race/ethnic group

45
General health status and race White social experience associated with better health Even within the same self-identified race/ethnic group Even within the same educational level

49
General health status and race White social experience associated with better health Even within the same self-identified race/ethnic group Even within the same educational level White social experience associated with higher education

50
Key questions Why is socially-assigned race associated with self-reported general health status? Even within the same self-identified race/ethnic group Even within the same educational level Why is socially-assigned race associated with educational level?

51
A system of structuring opportunity and assigning value based on the social interpretation of phenotype (race) What is racism? Source: Jones CP, Phylon 2003

52
A system of structuring opportunity and assigning value based on the social interpretation of phenotype (race) Unfairly disadvantages some individuals and communities Unfairly advantages other individuals and communities What is racism? Source: Jones CP, Phylon 2003

53
A system of structuring opportunity and assigning value based on the social interpretation of phenotype (race) Unfairly disadvantages some individuals and communities Unfairly advantages other individuals and communities Saps the strength of the whole society through the waste of human resources What is racism? Source: Jones CP, Phylon 2003

54
Our tasks Name racism Ask, How is racism operating here? Organize and strategize to act

55
BRFSS coordinators ArkansasNeha Thakkar ColoradoJason Gannon DelawareFred Breukelman District of ColumbiaJohn Davies-Cole MississippiRon McAnally Rhode IslandJana Hesser South CarolinaBeili Dong WisconsinAnne Ziege

56
Limitations BRFSS is a telephone survey Some households do not have land-line phones, and the distribution of land-line phones is differential by race Increased screening of telemarketers may impact response rates Health status data are self-reported, without examination data

Similar presentations


 Notes: Black and white refer to black.>")

