Download presentation
Presentation is loading. Please wait.

1
What is racism?

2
A system

3
A system of structuring opportunity and assigning value What is racism?

4
A system of structuring opportunity and assigning value based on the social interpretation of how we look (“race”) What is racism?
 What is racism")
5
A system of structuring opportunity and assigning value based on the social interpretation of how we look (“race”) Unfairly disadvantages some individuals and communities What is racism?
 Unfairly disadvantages some individuals and communities What is racism")
6
A system of structuring opportunity and assigning value based on the social interpretation of how we look (“race”) Unfairly disadvantages some individuals and communities Unfairly advantages other individuals and communities What is racism?
 Unfairly disadvantages some individuals and communities Unfairly advantages other individuals and communities What is racism")
7
A system of structuring opportunity and assigning value based on the social interpretation of how we look (“race”) Unfairly disadvantages some individuals and communities Unfairly advantages other individuals and communities Saps the strength of the whole society through the waste of human resources What is racism? Source: Jones CP, Phylon 2003

8
“Reactions to Race” module Six-question optional module on the Behavioral Risk Factor Surveillance System Piloted by six states in 2002 Now available to all states

9
States using “Reactions to Race” Arkansas2004 California2002 Colorado2004 Delaware200220042005 District of Columbia2004 Florida2002 Michigan2006 Mississippi2004 New Hampshire2002 New Mexico2002 North Carolina2002 Ohio20032005 Rhode Island2004 South Carolina20032004 Washington2004 Wisconsin200420052006

10
Arkansas, Colorado, Delaware, District of Columbia, Mississippi, Rhode Island, South Carolina, Wisconsin States using “Reactions to Race” module on 2004 BRFSS

11
Socially-assigned “race” How do other people usually classify you in this country? Would you say: White Black or African-American Hispanic or Latino Asian Native Hawaiian or Other Pacific Islander American Indian or Alaska Native Some other group

12
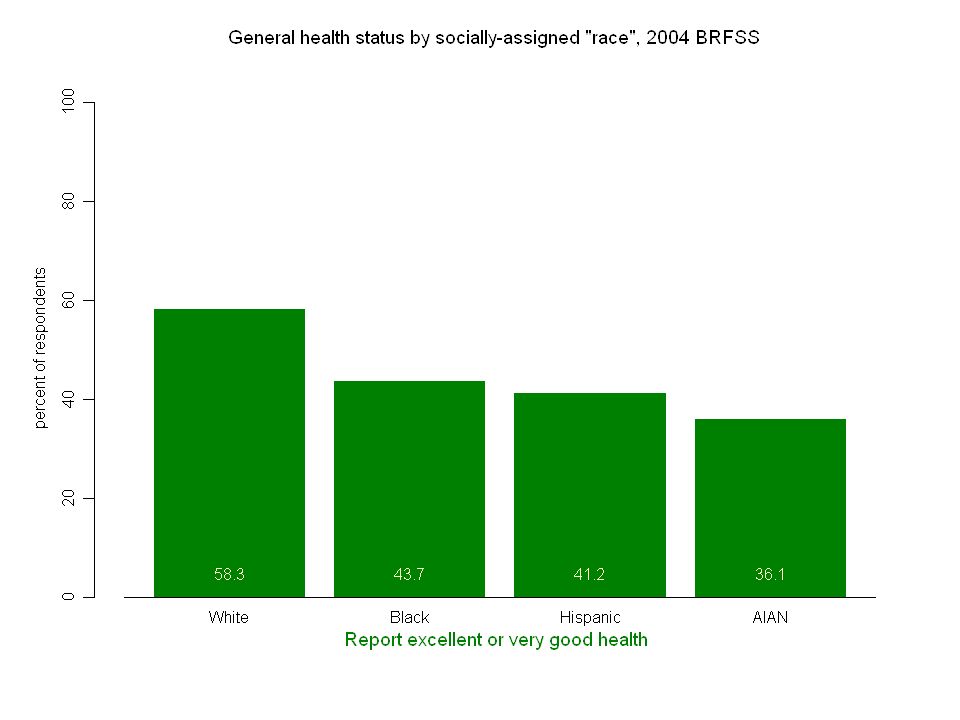
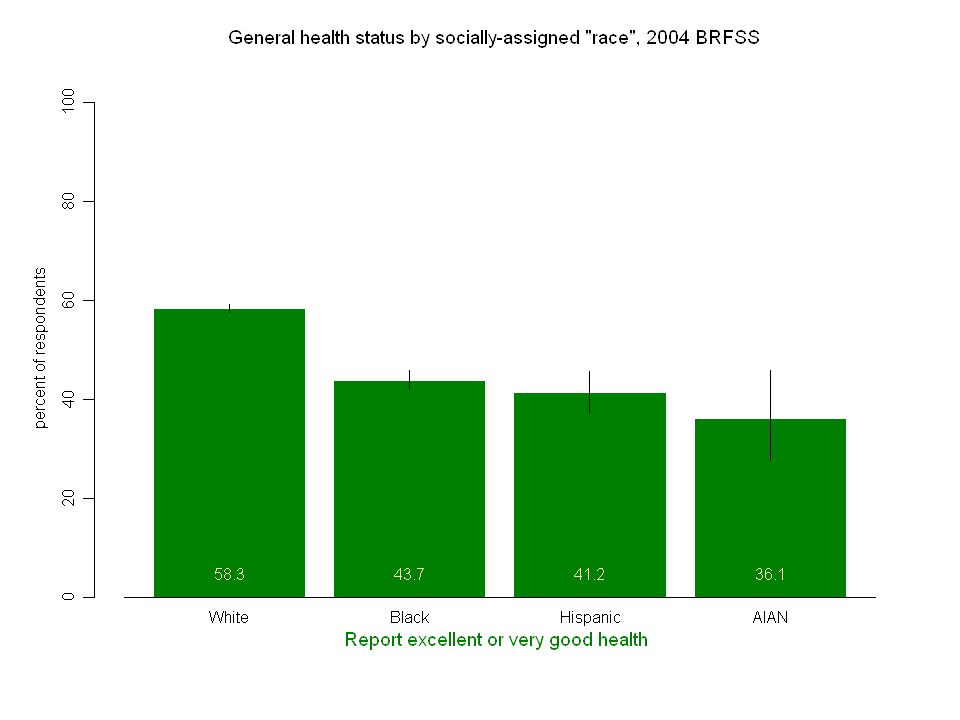
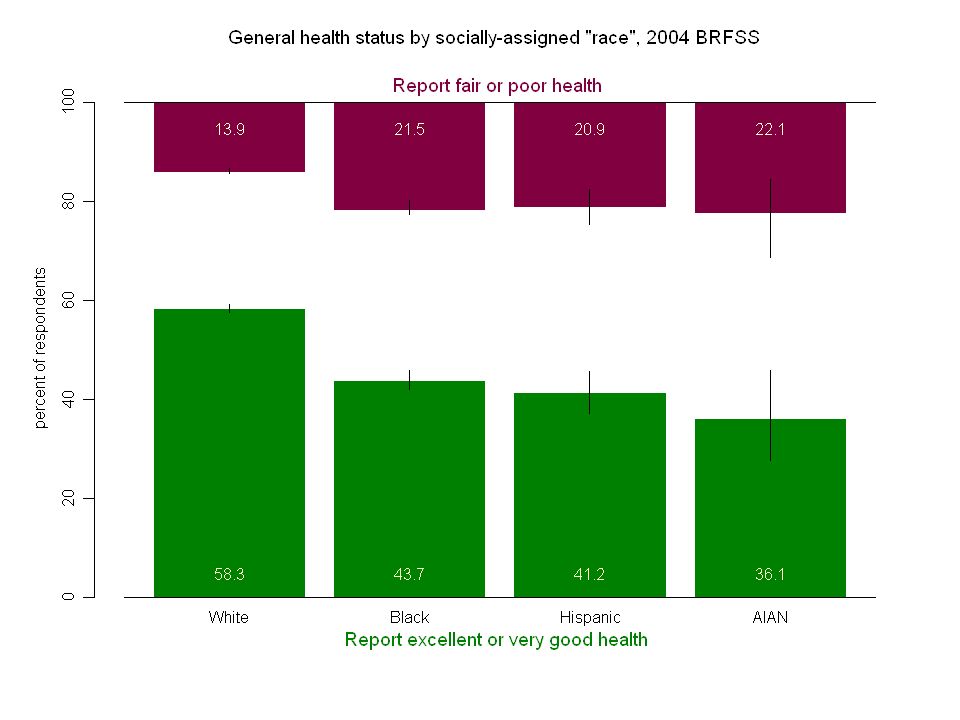
General health status Would you say that in general your health is: Excellent Very good Good Fair Poor

16
General health status and “race” “White” social experience associated with better health

17
Self-identified ethnicity Are you Hispanic or Latino? Yes No

18
Self-identified “race” Which one or more of the following would you say is your race? White Black or African-American Asian Native Hawaiian or Other Pacific Islander American Indian or Alaska Native Other Which one of these groups would you say best represents your race?

19
Self-identified “race”/ethnicity Hispanic “Yes” to Hispanic/Latino ethnicity question Any response to race question White “No” to Hispanic/Latino ethnicity question Only one response to race question, “White” Black “No” to Hispanic/Latino ethnicity question Only one response to race question, “Black” American Indian/Alaska Native “No” to Hispanic/Latino ethnicity question Only one response to race question, “AI/AN”

20
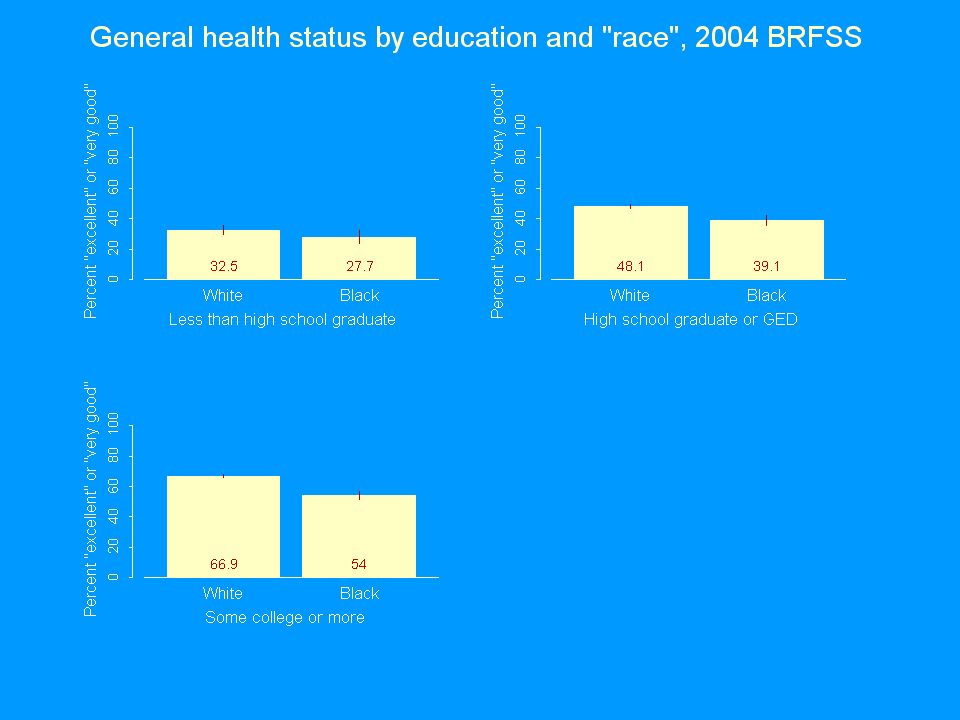
WhiteBlackHispanicAIAN... White 26,373 98.4 0.1 0.3 0.1 1.1 Black 5,246 0.595.3 0.9 0.3 3.0 How self-identify Two measures of “race” How usually classified by others

21
WhiteBlackHispanicAIAN... White 26,373 98.4 0.1 0.3 0.1 1.1 Black 5,246 0.595.3 0.9 0.3 3.0 Hispanic 1,528 26.4 4.761.3 1.0 6.6 How self-identify Two measures of “race” How usually classified by others

22
WhiteBlackHispanicAIAN... White 26,373 98.4 0.1 0.3 0.1 1.1 Black 5,246 0.595.3 0.9 0.3 3.0 Hispanic 1,528 26.4 4.761.3 1.0 6.6 How self-identify Two measures of “race” How usually classified by others

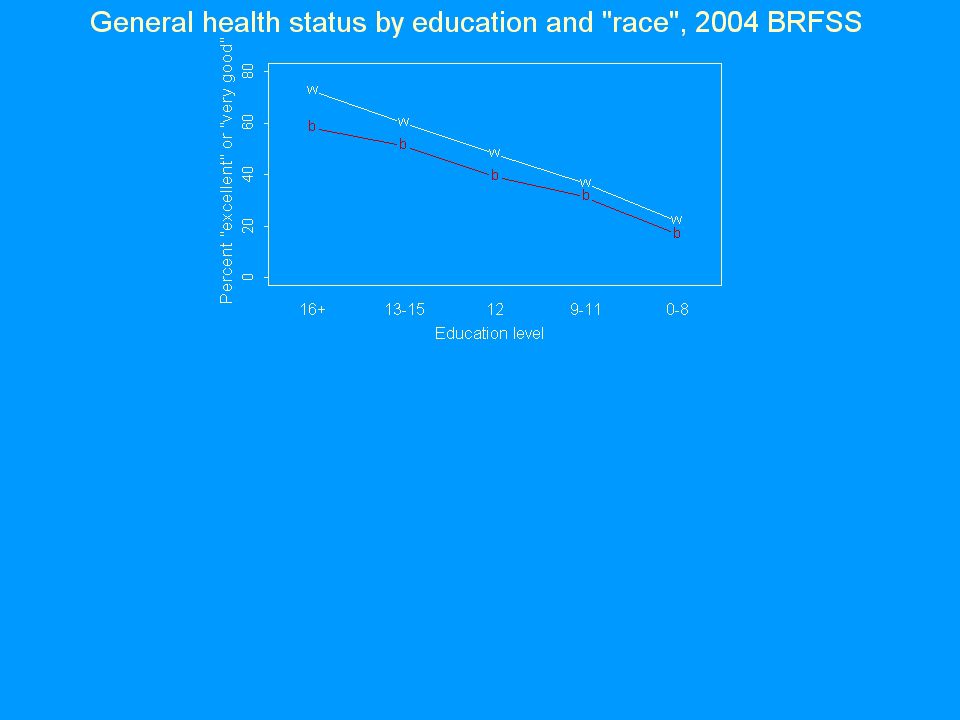
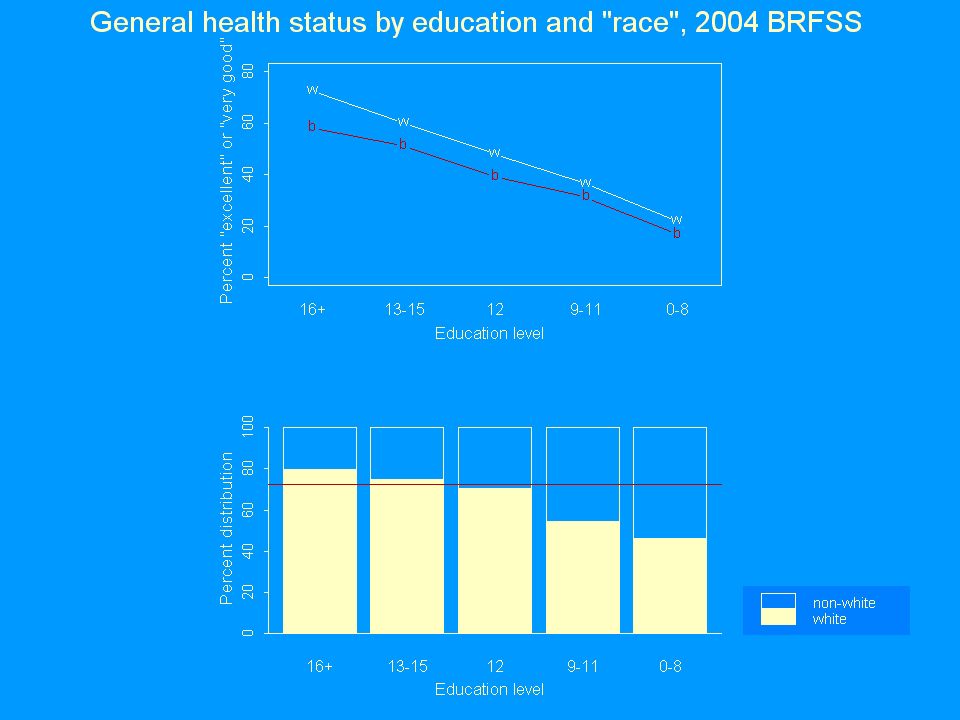
23
0 20 40 60 80 100 39.8 53.7 58.6 percent of respondents Report excellent or very good health Hispanic-HispanicHispanic-WhiteWhite-White General health status, by self-identified and socially-assigned "race", 2004

24
0 20 40 60 80 100 39.8 58.6 percent of respondents Report excellent or very good health Hispanic-HispanicWhite-White General health status, by self-identified and socially-assigned "race", 2004 Test of H 0 : No difference in proportions reporting excellent or very good health Hispanic-Hispanic versus White-White p < 0.0001

25
0 20 40 60 80 100 39.8 53.7 percent of respondents Report excellent or very good health Hispanic-HispanicHispanic-White General health status, by self-identified and socially-assigned "race", 2004 Test of H 0 : No difference in proportions reporting excellent or very good health Hispanic-Hispanic versus Hispanic-White p = 0.0019

26
0 20 40 60 80 100 53.7 58.6 percent of respondents Report excellent or very good health Hispanic-WhiteWhite-White General health status, by self-identified and socially-assigned "race", 2004 Test of H 0 : No difference in proportions reporting excellent or very good health Hispanic-White versus White-White p = 0.1895

27
WhiteBlackHispanicAIAN... White 26,373 98.4 0.1 0.3 0.1 1.1 Black 5,246 0.595.3 0.9 0.3 3.0 Hispanic 1,528 26.4 4.761.3 1.0 6.6 AIAN 321 45.5 6.9 6.533.6 7.5 How self-identify Two measures of “race” How usually classified by others

28
WhiteBlackHispanicAIAN... White 26,373 98.4 0.1 0.3 0.1 1.1 Black 5,246 0.595.3 0.9 0.3 3.0 Hispanic 1,528 26.4 4.761.3 1.0 6.6 AIAN 321 45.5 6.9 6.533.6 7.5 How self-identify Two measures of “race” How usually classified by others

29
0 20 40 60 80 100 32 52.6 58.6 percent of respondents Report excellent or very good health AIAN-AIANAIAN-WhiteWhite-White General health status, by self-identified and socially-assigned "race", 2004

30
0 20 40 60 80 100 32 58.6 percent of respondents Report excellent or very good health AIAN-AIANWhite-White General health status, by self-identified and socially-assigned "race", 2004 Test of H 0 : No difference in proportions reporting excellent or very good health AIAN-AIAN versus White-White p < 0.0001

31
0 20 40 60 80 100 32 52.6 percent of respondents Report excellent or very good health AIAN-AIANAIAN-White General health status, by self-identified and socially-assigned "race", 2004 Test of H 0 : No difference in proportions reporting excellent or very good health AIAN-AIAN versus AIAN-White p = 0.0122

32
0 20 40 60 80 100 52.6 58.6 percent of respondents Report excellent or very good health AIAN-WhiteWhite-White General health status, by self-identified and socially-assigned "race", 2004 Test of H 0 : No difference in proportions reporting excellent or very good health AIAN-White versus White-White p = 0.3070

33
General health status and “race” “White” social experience associated with better health Even within the same self-identified “race”/ethnic group

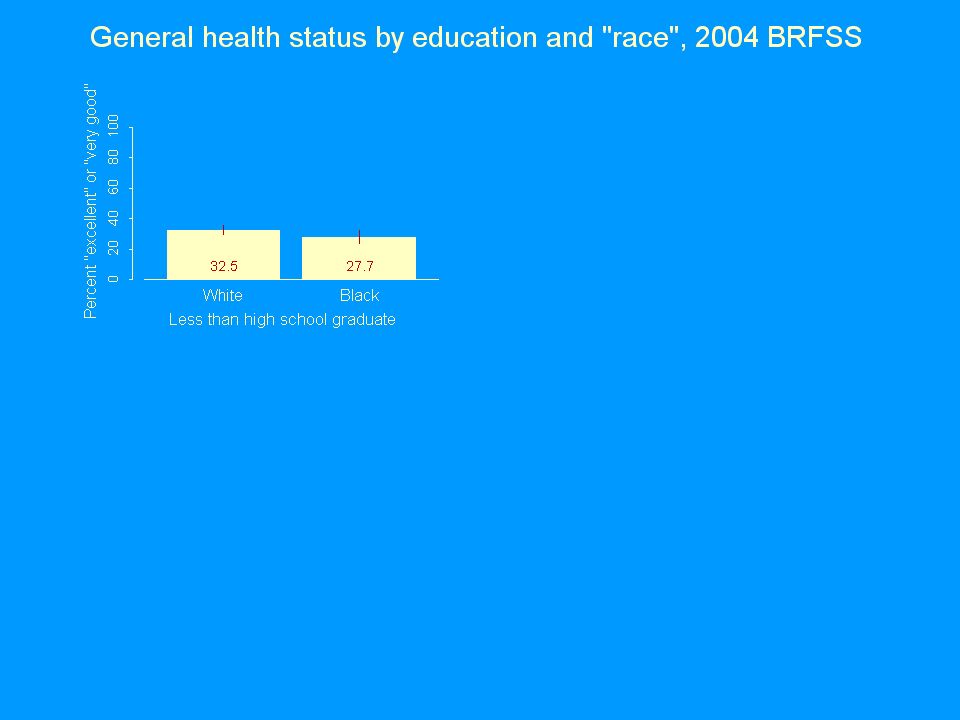
38
General health status and “race” “White” social experience associated with better health Even within the same self-identified “race”/ethnic group Even within the same educational level

43
General health status and “race” “White” social experience associated with better health Even within the same self-identified “race”/ethnic group Even within the same educational level “White” social experience associated with higher education

44
Key questions WHY is socially-assigned “race” associated with self-reported general health status? Even within the same self-identified “race”/ethnic group Even within the same educational level WHY is socially-assigned “race” associated with educational level?

45
A system of structuring opportunity and assigning value based on the social interpretation of how we look (“race”) Unfairly disadvantages some individuals and communities Unfairly advantages other individuals and communities Saps the strength of the whole society through the waste of human resources Racism Source: Jones CP, Phylon 2003
 Unfairly disadvantages some individuals and communities Unfairly advantages other individuals and communities Saps the strength of the whole society through the waste of human resources Racism Source: Jones CP, Phylon 2003")
Similar presentations


 of 30 or higher. Body Mass Index (BMI): A measure of an.>")
 of 30 or higher.>")

>")
 Study Cards The East (12) New Hampshire New York Massachusetts Delaware Connecticut New Jersey Rhode Island Rhode Island Maryland.>")
 Alaska GeoCurrents Customizable Base Map text.>")


