Download presentation
Presentation is loading. Please wait.

1
Droughts, Markets, Fuel, & Food
Agronomy Seminar Ames, Iowa Oct. 4, 2012 Chad Hart Associate Professor/Grain Markets Specialist 1 1

2
U.S. Corn Supply and Use ? ? ? ? 2008 2009 2010 2011 2012 Area Planted
(mil. acres) 86.0 86.4 88.2 91.9 96.4 Yield (bu./acre) 153.9 164.7 152.8 147.2 122.8 Production (mil. bu.) 12,092 13,092 12,447 12,358 10,727 Beg. Stocks 1,624 1,673 1,708 1,128 988 Imports 14 8 28 25 75 Total Supply 13,729 14,774 14,182 13,511 11,790 Feed & Residual 5,182 5,125 4,793 4,400 4,150 Ethanol 3,709 4,591 5,021 5,000 4,500 Food, Seed, & Other 1,316 1,370 1,407 1,390 1,350 Exports 1,849 1,980 1,835 1,540 1,250 Total Use 12,056 13,066 13,055 12,330 11,250 Ending Stocks 540 Season-Average Price ($/bu.) 4.06 3.55 5.18 6.25 7.90 ? ? ? These are the latest numbers from USDA. Record production and demand is gone and was replaced by record prices. All sectors of demand took major cuts. Ending stocks are projected to be at pipeline levels. ? Source: USDA-WAOB 2 2
 Yield. (bu./acre) Production. (mil. bu.) 12, , , , ,727. Beg. Stocks. 1,624. 1,673. 1,708. 1, Imports Total Supply. 13, , , , ,790. Feed & Residual. 5,182. 5,125. 4,793. 4,400. 4,150. Ethanol. 3,709. 4,591. 5,021. 5,000. 4,500. Food, Seed, & Other. 1,316. 1,370. 1,407. 1,390. 1,350. Exports. 1,849. 1,980. 1,835. 1,540. 1,250. Total Use. 12, , , , ,250. Ending Stocks Season-Average Price. ($/bu.) These are the latest numbers from USDA. Record production and demand is gone and was replaced by record prices. All sectors of demand took major cuts. Ending stocks are projected to be at pipeline levels. Source: USDA-WAOB")
3
U.S. Soybean Supply and Use
2008 2009 2010 2011 2012 Area Planted (mil. acres) 75.7 77.5 77.4 75.0 76.1 Yield (bu./acre) 39.7 44.0 43.5 41.9 35.3 Production (mil. bu.) 2,967 3,359 3,329 3,094 2,634 Beg. Stocks 205 138 151 215 169 Imports 13 15 14 16 20 Total Supply 3,185 3,512 3,495 3,325 2,824 Crush 1,662 1,752 1,648 1,705 1,500 Seed & Residual 106 110 130 90 114 Exports 1,279 1,499 1,501 1,360 1,055 Total Use 3,047 3,361 3,280 3,156 2,670 Ending Stocks 154 Season-Average Price ($/bu.) 9.97 9.59 11.30 12.45 16.00 For soybeans, a tight market continues to get tighter. USDA ratcheted down demand for the new crop to hold 2012/13 ending stocks at 115 million bushels. As with corn, all sectors of demand took a big cut. Source: USDA-WAOB 3 3
 Yield. (bu./acre) Production. (mil. bu.) 2,967. 3,359. 3,329. 3,094. 2,634. Beg. Stocks Imports Total Supply. 3,185. 3,512. 3,495. 3,325. 2,824. Crush. 1,662. 1,752. 1,648. 1,705. 1,500. Seed & Residual Exports. 1,279. 1,499. 1,501. 1,360. 1,055. Total Use. 3,047. 3,361. 3,280. 3,156. 2,670. Ending Stocks Season-Average Price. ($/bu.) For soybeans, a tight market continues to get tighter. USDA ratcheted down demand for the new crop to hold 2012/13 ending stocks at 115 million bushels. As with corn, all sectors of demand took a big cut. Source: USDA-WAOB")
4
Prices Prices have risen and fallen with the temperatures.

5
Crop Conditions Source: USDA-NASS
But dry conditions have weakened the crops, as the crop conditions show. The USDA update reflects the scale of yield loss as they have taken over 40 bushels from corn and nearly 8 bushels from soybeans. Source: USDA-NASS

6
World Corn Production Source: USDA-WAOB
Global corn production took a hit last month, with Canada and Europe seeing reductions in potential corn production. Source: USDA-WAOB 6 6

7
World Soybean Production
Soybean prices have spurred on increased soybean plantings worldwide. South America will lead the charge. Source: USDA-WAOB 7 7

8
U.S. Meat Production & Prices
Higher feed costs have led to lower meat production projections. Source: USDA-WAOB 8 8

9
U.S. Pork Projections Source: FAPRI-MO

10
U.S. Beef Projections Source: FAPRI-MO

11
U.S. Per-Capita Meat Consumption
Source: FAPRI-MO

12
Food Price Projections
Source: FAPRI-MO

13
Food Dollar Source: USDA-ERS

14
Corn Export Sales Source: USDA-FAS
Corn exports for the 2012 crop have started even slower than 2011, only China buying more. Source: USDA-FAS

15
Soy Export Sales Source: USDA-FAS
2012 soybean exports have rebounded to around 2010 levels. The key market here is China and they have purchased a lot of soybeans recently. Source: USDA-FAS

16
Population 2010 2020 2050 (billion) World 6.831 7.558 9.202 China
2020 2050 (billion) World 6.831 7.558 9.202 China 1.330 1.385 India 1.657 1.173 1.326 1.304 U.S. 0.310 0.341 0.439 Indonesia 0.243 0.268 0.313 Brazil 0.201 0.223 Ethiopia 0.278 Pakistan 0.177 0.204 0.276 Bangladesh 0.158 Nigeria 0.182 0.264 0.152 0.181 0.260 Russia 0.139 0.132 0.234 Japan 0.127 Mexico 0.125 Congo 0.189 Source: U.S. Census Bureau, International Data Base
 World China India U.S Indonesia Brazil Ethiopia Pakistan Bangladesh Nigeria Russia Japan Mexico Congo Source: U.S. Census Bureau, International Data Base.")
17
10 Largest Economies (GDP Rank)
2020 2030 2040 2050 US China Japan India Germany Brazil France Russia UK Mexico Italy Indonesia Canada Source: PwC, The World in 2050, January 2011

18
Corn Grind for Ethanol Negative margins at some ethanol plants have dragged down production.

19
Ethanol Stocks Source: DOE-EIA
And stocks have built up in recent weeks, weakening price projections. Source: DOE-EIA

20
U.S. Blended Gasoline Consumption
7.6 bil. gal. But the industry still faces blend wall issues as fuel consumption has dropped with the economy and the E-10 market is basically full. 7.4 bil. gal. Source: DOE-EIA, via USDA-ERS

21
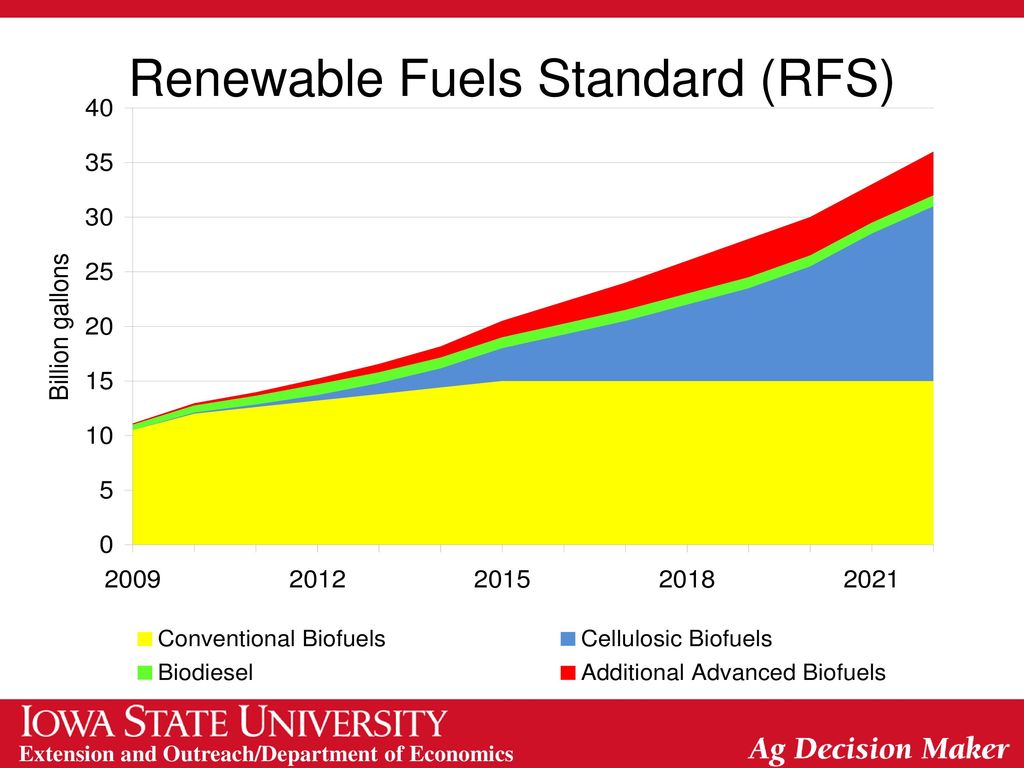
Renewable Fuels Standard (RFS)
21 21
22
Projected 2012 Season-Average Corn Price
The drought has brought in some very strong and profitable prices, but harvest rolls along and the yield story seems to be improving, prices have fallen.

23
Projected 2012 Season-Average Soy Price
The same is true for soybeans.

24
Current Corn Futures 7.06 5.91 5.57 Source: CME Group, 10/4/2012
Based on current futures prices, national season-average cash price estimates for corn are $7.06 for the 2012 crop, $5.91 for 2013, and $5.57 for 2014. 5.57 Source: CME Group, 10/4/2012

25
Current Soybean Futures
14.63 For soybeans, the estimates are $14.63 for the 2012 crop, $12.70 for 2013, and $12.20 for 2014. 12.70 12.20 Source: CME Group, 10/4/2012

26
Total Acreage Shift Source: USDA-NASS
We brought back a lot of acres in Can we hold them in 2013? Source: USDA-NASS

27
Acreage Shift by State Top: Planted in 2012 Bottom: Change from 2011
Weather was great for planting in 2012 (just not for producing). To hold acreage we will need great planting weather again. Top: Planted in 2012 Bottom: Change from 2011 Units: 1,000 acres Source: USDA-NASS
. To hold acreage we will need great planting weather again. Top: Planted in Bottom: Change from Units: 1,000 acres. Source: USDA-NASS.")
28
Acreage Shift by Crop Acreage change from 2011 Units: 1,000 acres
Cotton will likely give up acreage again. But with crop prices strong across the board, the acreage battle could be interesting in 2013. Source: USDA-NASS

29
Thank you for your time. Any questions. My web site: http://www. econ
Thank you for your time! Any questions? My web site: Iowa Farm Outlook: Ag Decision Maker:

Similar presentations


