Download presentation
Presentation is loading. Please wait.

1
Google Meningitis Modeling Tom Hopson October 12 - 13, 2010

2
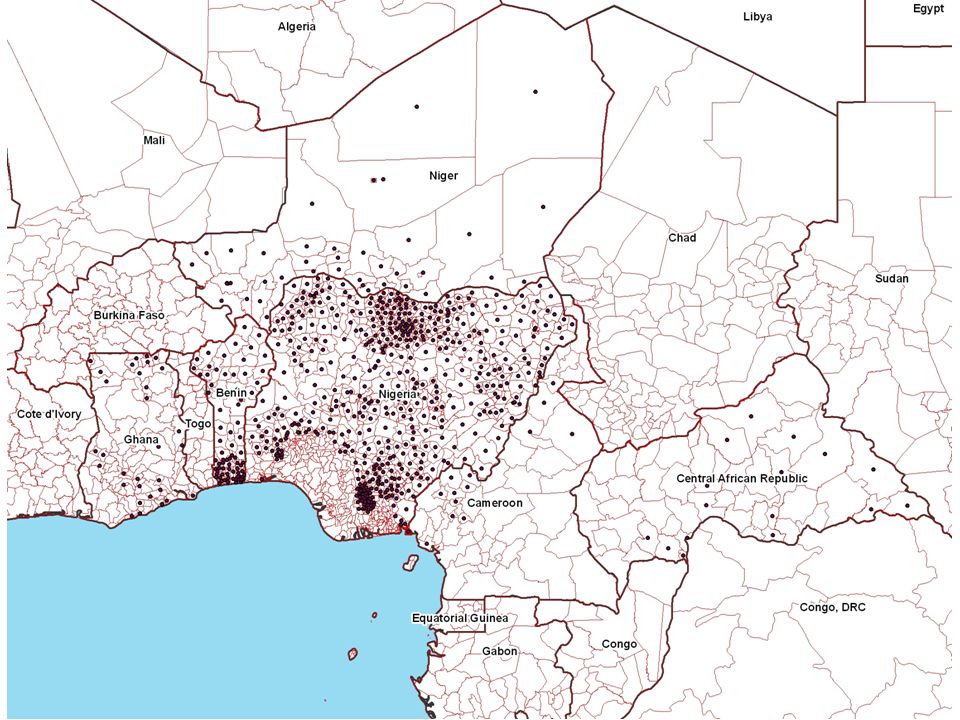
A role for weather forecasts Meningitis epidemics are observed to occur in the dust season and end with the onset of the rains –Can we predict the onset of the rains with enough spatial resolution ad enough lead time so that decision makers can prioritize allocation of vaccines to those districts likely to remain dry. 2

4
More on relevant weather variables … Consensus?: irritation of the pharynx that allows the bacteria (which may already be there) to enter the body. Dryness? Diffusion equation (number density): => Diffusion ~ number density, or perhaps more accurately, ~ Tn A In terms of what we can forecast (measure), look at ideal gas law: or Look at terms ~ e and terms ~ (e / T K ) (air at body temperature) => e ~ e sat (T) RH
: => Diffusion ~ number density, or perhaps more accurately, ~ Tn A In terms of what we can forecast (measure), look at ideal gas law: or Look at terms ~ e and terms ~ (e / T K ) (air at body temperature) => e ~ e sat (T) RH.")
5
Possible simple model (MRSA) – Susceptible-Colonized-Infected reservoirs (over?-) simplifications: assume can develop a meningitis model that applies for all assume homogenous mixing over whole district same model applied to all available districts S t, C t, I t represent numbers of people in each district β coefficients depend on many factors Thanks to Vanja Dukic
 – Susceptible-Colonized-Infected reservoirs (over -) simplifications: assume can develop a meningitis model that applies for all assume homogenous mixing over whole district same model applied to all available districts S t, C t, I t represent numbers of people in each district β coefficients depend on many factors Thanks to Vanja Dukic")
6
Possible simple model (cont) - for closure, treat I t ( (d) terms) as sum of previous 2 weeks of cases (after 2 weeks, no longer infected) => I t = I t-1 + I t-2 weekly time increment, so model everything as weekly averages (met variables) Simplifying to: only observations are I t (actually positive change in I t ), and Population P => model last equation only => treat S t and C t as roughly fixed ratios of total population across all countries (proportionally-small variation in S and C) (a)(b)(c)(d) (a) (b) (c)
 - for closure, treat I t ( (d) terms) as sum of previous 2 weeks of cases (after 2 weeks, no longer infected) => I t = I t-1 + I t-2 weekly time increment, so model everything as weekly averages (met variables) Simplifying to: only observations are I t (actually positive change in I t ), and Population P => model last equation only => treat S t and C t as roughly fixed ratios of total population across all countries (proportionally-small variation in S and C) (a)(b)(c)(d) (a) (b) (c)")
7
Possible simple model (cont) - Or in terms of cases per 100,000 …
 - Or in terms of cases per 100,000 …")
9
2 other Possible simple models … => Population per Area dependence n A + m B → C + D {} => Per Population dependence or

10
Grouping all possible model terms together … Or in terms of real-time measurables (i.e. no I terms) …
 ….")
11
Logistic Regression for probability of occurrence ( “any case” or “epidemic 15/10 5 )
")
12
Weather Variable fit … RHVPAIRTVP/TTOTWINDNEWIND current const111110 lag1 const001000 lag2 const001111 current P111100 lag1 P000000 lag2 P101010 current P/A110100 lag1 P/A001010 lag2 P/A100100 current Pr/r101100 lag1 Pr/r001000 lag2 Pr/r111110 current Pr/r/Ar110100 lag1 Pr/r/Ar100100 lag2 Pr/r/Ar100010

13
Overall Weather Variable fit … current const010000 lag1 const000000 lag2 const000000 current P000000 lag1 P000000 lag2 P000000 current P/A000000 lag1 P/A000000 lag2 P/A000000 current Pr/r000000 lag1 Pr/r000000 lag2 Pr/r110000 current Pr/r/Ar000011 lag1 Pr/r/Ar000000 lag2 Pr/r/Ar000000 Next steps … 1) use cross-validation 2) compare with equation utilizing incidence reports
 use cross-validation 2) compare with equation utilizing incidence reports")
14
… followed by Quantile Regression (QR) for severity (cases) … E.g. Our application Fitting T quantiles using QR conditioned on: 1)Ranked forecast ens 2)ensemble mean 3)ensemble median 4) ensemble stdev 5) Persistence
Ranked forecast ens 2)ensemble mean 3)ensemble median 4) ensemble stdev 5) Persistence.")
15
Using ‘Quantile Regression’ to better calibrate ensembles Without Quantile Regression: Observations outside range of ensembles With Quantile Regression: Ensembles bracket observations From Tom Hopson

16
THORPEX-TIGGE “Grand Ensemble Experiment” Archive Centre Current Data Provider NCAR NCEP CMC UKMO ECMWF MeteoFrance JMA KMA CMA BoM CPTEC IDD/LDM HTTP FTP Unidata IDD/LDM Internet Data Distribution / Local Data Manager Commodity internet application to send and receive data NCDC

17
Archive Status and Monitoring, Variability between providers

18
Forecasting: Thorpex-Tigge “grand ensemble” -

19
Forecast “calibration” or “post- processing” Probability calibration Flow rate [m 3 /s] Probability Post-processing has corrected: the “on average” bias as well as under-representation of the 2nd moment of the empirical forecast PDF (i.e. corrected its “dispersion” or “spread”) “spread” or “dispersion” “bias” obs Forecast PDF Forecast PDF Flow rate [m 3 /s] Our approach: under-utilized “quantile regression” approach probability distribution function “means what it says” daily variation in the ensemble dispersion directly relate to changes in forecast skill => informative ensemble skill-spread relationship
![Forecast calibration or post- processing Probability calibration Flow rate [m 3 /s] Probability Post-processing has corrected: the on average bias as well as under-representation of the 2nd moment of the empirical forecast PDF (i.e.](http://images.slideplayer.com/47/11754779/slides/slide_19.jpg "corrected its dispersion or spread ) spread or dispersion bias obs Forecast PDF Forecast PDF Flow rate [m 3 /s] Our approach: under-utilized quantile regression approach probability distribution function means what it says daily variation in the ensemble dispersion directly relate to changes in forecast skill => informative ensemble skill-spread relationship.")
20
Calibration Procedure For each quantile: 1)Perform a “climatological” fit to the data 2)Starting with full regressor set, iteratively select best subset using “step-wise cross-validation” –Fitting done using QR –Selection done by: a)Minimizing QR cost function b)Satisfying the binomial distribution 2nd pass: segregate forecasts into differing ranges of ensemble dispersion, and refit models => ensure ensemble has skill-spread information Probability Temperature [K] obs Forecast PDF T [K] Time Forecastsobserved Regressors for each quantile: 1) ranked forecast ensemble member 2) ens mean 4) ens stdev 5) persistence
![Calibration Procedure For each quantile: 1)Perform a climatological fit to the data 2)Starting with full regressor set, iteratively select best subset using step-wise cross-validation –Fitting done using QR –Selection done by: a)Minimizing QR cost function b)Satisfying the binomial distribution 2nd pass: segregate forecasts into differing ranges of ensemble dispersion, and refit models => ensure ensemble has skill-spread information Probability Temperature [K] obs Forecast PDF T [K] Time Forecastsobserved Regressors for each quantile: 1) ranked forecast ensemble member 2) ens mean 4) ens stdev 5) persistence](http://images.slideplayer.com/47/11754779/slides/slide_20.jpg "Calibration Procedure For each quantile: 1)Perform a climatological fit to the data 2)Starting with full regressor set, iteratively select best subset using step-wise cross-validation –Fitting done using QR –Selection done by: a)Minimizing QR cost function b)Satisfying the binomial distribution 2nd pass: segregate forecasts into differing ranges of ensemble dispersion, and refit models => ensure ensemble has skill-spread information Probability Temperature [K] obs Forecast PDF T [K] Time Forecastsobserved Regressors for each quantile: 1) ranked forecast ensemble member 2) ens mean 4) ens stdev 5) persistence")
21
Questions about weather/health relationship How does the disease work? –Consensus?: irritation of the pharynx that allows the bacteria (which may already be there) to enter the body Consistent with dust, cooking smoke, and pneumococcal as risk factors. Problem of communal eating across belt – exchange of saliva
 to enter the body Consistent with dust, cooking smoke, and pneumococcal as risk factors. Problem of communal eating across belt – exchange of saliva.")
Similar presentations


 Regional Maritime University, Accra Ghana>")


, was developed.>")


 Bayesian Model Averaging (BMA) – Raftery et al (1997) 2) Analogue approaches – Hopson and Webster, J.>")


