Download presentation
Presentation is loading. Please wait.

1
© 2011 Pearson Education, Inc. Climate Change Position Paper… Winter Break Assignment AP Environmental Science Mr. Grant Lesson 53

2
© 2011 Pearson Education, Inc. Objectives: Review Chapter 18 Multiple Choice Questions/Take Quiz AP Students: You are to write a minimum three-page (double spaced) personal position paper on Global Warming. The paper should include i) Observations that give rise to global warming theory, ii) An explanation of global warming theory, iii) The effects of global warming (if the theory is true) iv) Skepticism about global warming (if the theory is not true), v) Possible solutions and/or future concerns, vi) Works cited. Robinson, Robinson & Soon: While the film Inconvenient Truth itself states that there is no scientific doubt about the fact of increasing human-influenced global warming, this paper helps students both to evaluate Gore’s evidence, and also to be aware of the major criticisms that exist to the global warming case, and the scientific validity they do or do not have.
 personal position paper on Global Warming. The paper should include i) Observations that give rise to global warming theory, ii) An explanation of global warming theory, iii) The effects of global warming (if the theory is true) iv) Skepticism about global warming (if the theory is not true), v) Possible solutions and/or future concerns, vi) Works cited. Robinson, Robinson & Soon: While the film Inconvenient Truth itself states that there is no scientific doubt about the fact of increasing human-influenced global warming, this paper helps students both to evaluate Gore’s evidence, and also to be aware of the major criticisms that exist to the global warming case, and the scientific validity they do or do not have..")
3
© 2011 Pearson Education, Inc. APES Global Warming Position Paper You are to write a minimum three-page (double spaced) personal position paper on Global Warming. I expect you to have an additional page of Works Cited. This is a list of supporting material you referred to in the paper. The paper must include the following sections. 1.Observations that give rise to global warming theory 2.An explanation of global warming theory. 3.a) The effects of global warming, if the theory is true, and/or b) Skepticism about global warming, if the theory is not true 4.Possible solutions and/or future concerns. 5.Works Cited
 personal position paper on Global Warming. I expect you to have an additional page of Works Cited. This is a list of supporting material you referred to in the paper. The paper must include the following sections. 1.Observations that give rise to global warming theory 2.An explanation of global warming theory. 3.a) The effects of global warming, if the theory is true, and/or b) Skepticism about global warming, if the theory is not true 4.Possible solutions and/or future concerns. 5.Works Cited.")
4
© 2011 Pearson Education, Inc. APES Global Warming Position Paper… Scoring Have you addressed…. 1.Observations that gave rise to the global warming theory 2.The global warming theory 3.Possible effects, if the theory is true 4.Possible skepticism, if the theory is not true 5.Possible solutions and future concerns

5
© 2011 Pearson Education, Inc. Environmental Effects of Increased Atmospheric Carbon Dioxide What is the Truth?

6
© 2011 Pearson Education, Inc.

9
Surface Temperatures in the Sargasso Sea

10
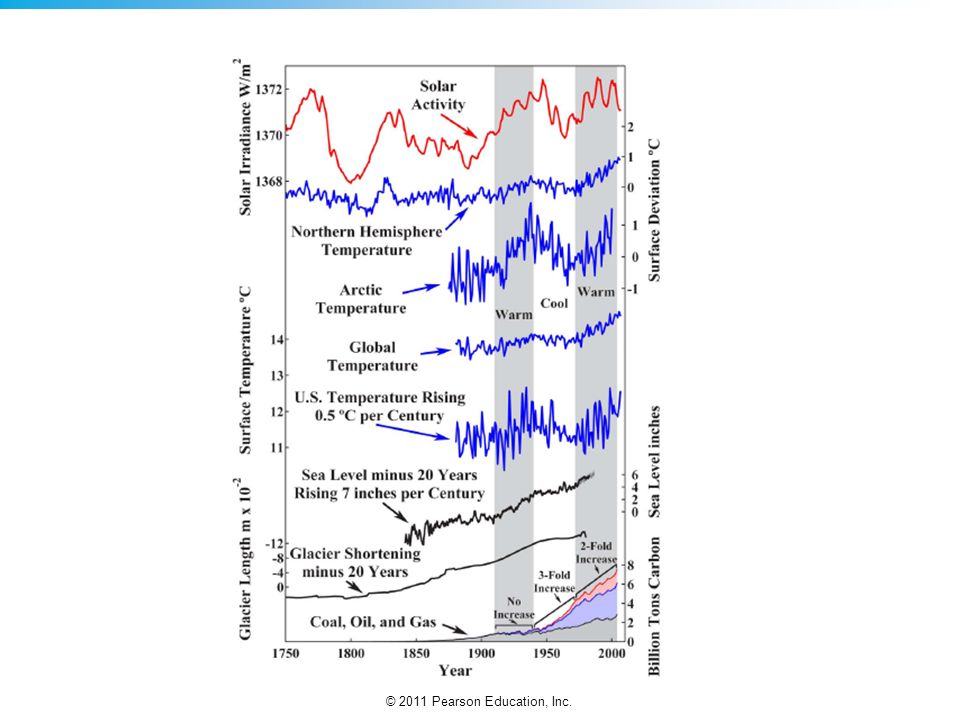
© 2011 Pearson Education, Inc. Glacier Shortening

11
© 2011 Pearson Education, Inc. Arctic surface air temperature compared with total solar irradiance as measured by sun spot cycle

12
© 2011 Pearson Education, Inc. Annual mean surface temperatures in the contiguous United States between 1880 and 2006

13
© 2011 Pearson Education, Inc. U.S. surface temperature as compared with total solar irradiance

14
© 2011 Pearson Education, Inc. Comparison between the current U.S. temperature change per century, the 3,000-year temperature range, seasonal and diurnal range in Oregon, and seasonal and diurnal range throughout the Earth.

15
© 2011 Pearson Education, Inc. Annual precipitation in the contiguous 48 United States between 1895 and 2006. The trend shows an in crease in rainfall of 1.8 inches per century – approximately 6% per century.

16
© 2011 Pearson Education, Inc. Annual number of strong-to-violent category F3 to F5 tornados during the March-to-August tornado sea son in the U.S. between 1950 and 2006. Du ing this period, world hydrocarbon use increased 6-fold, while violent tornado frequency decreased by 43%.

17
© 2011 Pearson Education, Inc. Annual number of Atlantic hurricanes that made land fall between 1900 and 2006. Line is drawn at mean value.

18
© 2011 Pearson Education, Inc. Annual number of violent hurricanes and maximum attained wind speed during those hurricanes in the Atlantic Ocean between 1944 and 2006. There is no upward trend in either of these records. During this period, world hydrocarbon use increased 6-fold. Lines are mean values.

19
© 2011 Pearson Education, Inc. Global sea level measured by surface gauges between 1807 and 2002 and by satellite between 1993 and 2006. Satellite measurements are shown in gray and agree with tide gauge measurements. The over - all trend is an in crease of 7 inches per century. This trend lags the temperature in crease, so it pre dates the in crease in hydrocarbon use even more than is shown. It is unaffected by the very large in crease in hydrocarbon use.

20
© 2011 Pearson Education, Inc. Glacier shortening and sea level rise. Gray area designates estimated range of error in the sea level re cord. These measurements lag air temperature in creases by about 20 years. So, the trends began more than a century be fore in creases in hydrocarbon use.

21
© 2011 Pearson Education, Inc.

23
Satellite microwave sounding unit (blue) and radiosonde balloon (red) measurements of tropospheric temperatures. The warming anomaly in 1997-1998 (gray) was caused by El Niño, which, like the overall trends, is unrelated to CO 2.
 was caused by El Niño, which, like the overall trends, is unrelated to CO 2..")
24
© 2011 Pearson Education, Inc. The “urban heat island effect” on surface measurements.

25
© 2011 Pearson Education, Inc.

26
Atmospheric CO 2 has increased 22% since 1958 and about 30% since 1880.

27
© 2011 Pearson Education, Inc.

Similar presentations


![Climate Change Impacts in the United States Third National Climate Assessment [Name] [Date] Climate Trends.](/15/4626683/big_thumb.jpg "Climate Change Impacts in the United States Third National Climate Assessment [Name] [Date] Climate Trends.>")


 Observed Surface & Atmosphere (from IPCC WG-I, Chapter 3) Observed Changes in Surface and Atmosphere Climate.>")


