Download presentation
Presentation is loading. Please wait.

1
Climate Change Impacts in the United States Third National Climate Assessment [Name] [Date] Climate Trends
![Climate Change Impacts in the United States Third National Climate Assessment [Name] [Date] Climate Trends](http://images.slideplayer.com/15/4626683/slides/slide_1.jpg "Climate Change Impacts in the United States Third National Climate Assessment [Name] [Date] Climate Trends")
2
Observed Climate Change Data from U.S. Census Bureau Global climate is changing and this change is apparent across a wide range of observations. The global warming of the past 50 years is primarily due to human activities.

3
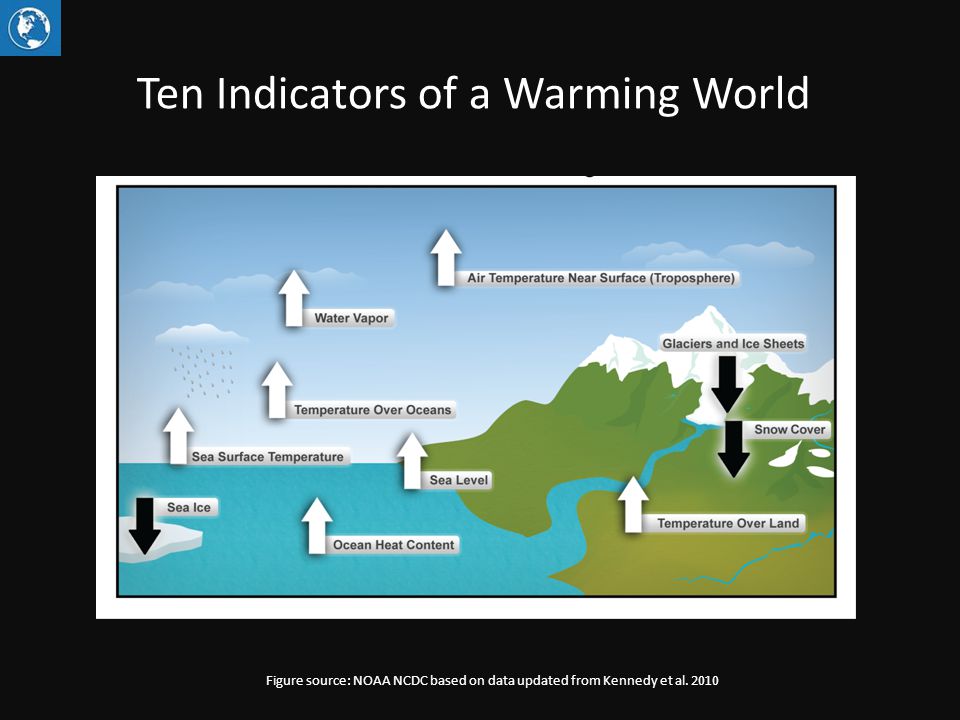
Ten Indicators of a Warming World Figure source: NOAA NCDC based on data updated from Kennedy et al. 2010
4
Separating Human and Natural Influences on Climate Figure source: adapted from Huber and Knutti

5
Future Climate Change Global climate is projected to continue to change over this century and beyond. The magnitude of climate change beyond the next few decades depends primarily on the amount of heat-trapping gases emitted globally, and how sensitive the Earth’s climate is to those emissions.

6
Projected Change in Average Annual Temperature Figure source: NOAA NCDC / CICS-NC

7
Temperature Trends U.S. average temperature has increased by 1.3°F to 1.9°F since record keeping began in 1895; most of this increase has occurred since about 1970. The most recent decade was the nation’s warmest on record. Temperatures in the United States are expected to continue to rise. Because human-induced warming is superimposed on a naturally varying climate, the temperature rise has not been, and will not be, uniform or smooth across the country or over time.

8
Newer Simulations for Projected Temperature (CMIP5 models) Figure source: NOAA NCDC / CICS-NC
 Figure source: NOAA NCDC / CICS-NC")
9
Lengthening Frost-free Season The length of the frost-free season (and the corresponding growing season) has been increasing nationally since the 1980s, with the largest increases occurring in the western United States, affecting ecosystems and agriculture. Across the United States, the growing season is projected to continue to lengthen.

10
Observed Increase in Frost-Free Season Length Figure source: NOAA NCDC / CICS-NC

11
U.S. Precipitation Change Average U.S. precipitation has increased since 1900, but some areas have had increases greater than the national average, and some areas have had decreases. More winter and spring precipitation is projected for the northern United States, and less for the Southwest, over this century.

12
Projected Precipitation Change by Season Figure source: NOAA NCDC / CICS-NC

13
Heavy Downpours Increasing Heavy downpours are increasing nationally, especially over the last three to five decades. Largest increases are in the Midwest and Northeast. Increases in the frequency and intensity of extreme precipitation events are projected for all U.S. regions.

14
Observed U.S. Trend in Heavy Precipitation Figure source: adapted from Kunkel et al. 2013

15
Observed Change in Very Heavy Precipitation Figure source: updated from Karl et al. 2009

16
Extreme Weather There have been changes in some types of extreme weather events over the last several decades. Heat waves have become more frequent and intense, especially in the West. Cold waves have become less frequent and intense across the nation. There have been regional trends in floods and droughts. Droughts in the Southwest and heat waves everywhere are projected to become more intense, and cold waves less intense everywhere.

17
Projected Temperature Change of Hottest and Coldest Days Figure source: NOAA NCDC / CICS-NC

18
Trends in Flood Magnitude Figure source: Peterson et al. 2013

19
Changes in Hurricanes The intensity, frequency, and duration of North Atlantic hurricanes, as well as the frequency of the strongest (Category 4 and 5) hurricanes, have all increased since the early 1980s. The relative contributions of human and natural causes to these increases are still uncertain. Hurricane-associated storm intensity and rainfall rates are projected to increase as the climate continues to warm.

20
Observed Trends in Hurricane Power Dissipation Figure source: adapted from Kossin et al. 2007

21
Changes in Storms Winter storms have increased in frequency and intensity since the 1950s, and their tracks have shifted northward over the United States. Other trends in severe storms, including the intensity and frequency of tornadoes, hail, and damaging thunderstorm winds, are uncertain and are being studied intensively.

22
Variation of Storm Frequency and Intensity during the Cold Season (November – March) Figure source: updated from CCSP 2008
 Figure source: updated from CCSP 2008")
23
Sea Level Rise Global sea level has risen by about 8 inches since reliable record keeping began in 1880. It is projected to rise another 1 to 4 feet by 2100.

24
North Atlantic Sea Level Change Figure source: NASA Jet Propulsion Laboratory

25
Past and Projected Changes in Global Sea Level Rise Figure source: NASA Jet Propulsion Laboratory

26
Melting Ice Rising temperatures are reducing ice volume and surface extent on land, lakes, and sea. This loss of ice is expected to continue. The Arctic Ocean is expected to become essentially ice free in summer before mid-century.

27
Decline in Arctic Sea Ice Extent Figure and data from National Snow and Ice Data Center

28
Projected Arctic Sea Ice Decline Figure source: adapted from Stroeve et al. 2012

29
Ocean Acidification The oceans are currently absorbing about a quarter of the carbon dioxide emitted to the atmosphere annually and are becoming more acidic as a result, leading to concerns about intensifying impacts on marine ecosystems.

30
As Oceans Absorb CO 2, They Become More Acidic Figure source: modified from Feely et al. 2009

31
Shells Dissolve in Acidified Ocean Water Photo credits: (left) Bednaršek et al. 2012; (right) Nina Bednaršek
 Nina Bednaršek.")
32
Climate Change Impacts in the United States http://nca2014.globalchange.gov http://nca2014.globalchange.gov Third National Climate Assessment @usgcrp facebook.com/usgcrp #NCA2014 [Name & Contact Info]
![Climate Change Impacts in the United States Third National Climate facebook.com/usgcrp #NCA2014 [Name & Contact Info]](http://images.slideplayer.com/15/4626683/slides/slide_32.jpg "Climate Change Impacts in the United States Third National Climate facebook.com/usgcrp #NCA2014 [Name & Contact Info]")
Similar presentations


![Climate Change Impacts in the United States Third National Climate Assessment [Name] [Date] Agriculture.](/14/4419994/big_thumb.jpg "Climate Change Impacts in the United States Third National Climate Assessment [Name] [Date] Agriculture.>")
![Climate Change Impacts in the United States Third National Climate Assessment [Name] [Date] Midwest.](/14/4474594/big_thumb.jpg "Climate Change Impacts in the United States Third National Climate Assessment [Name] [Date] Midwest.>")


 Thousands of years ago Carbon dioxide concentrations over the last.>")


