Download presentation
Presentation is loading. Please wait.

1
On land - 110,000 km 3 On sea - 400,000 km 3 510,000 km 3 from sky each year =110,000 km 3 43,500 km 3 (PET) 3,830 km 3 withdrawn Irrigation: 2,700 km 3 (70%) 71,500 km 3 Non-agric: 1,200 km 3 (90% returned) Source & Fate of Water
 3,830 km 3 withdrawn Irrigation: 2,700 km 3 (70%) 71,500 km 3 Non-agric: 1,200 km 3 (90% returned) Source & Fate of Water")
2
Green water, blue water, grey water… blue green rivers lakes aquifers soil moisture withdrawals Domestic industry returns wastewater surplus irrigation transpiration ocean food products domestic export domestic virtual water rivers virtual water 100% 36% 6.5% 0.1%

4
GWSP Digital Water Atlas (2008). Map 16: Water Consumption (total) (V1.0). Available online at http://atlas.gwsp.org Global Water Consumption

5
GWSP Digital Water Atlas (2008). Map 7: Water Stress (V1.0). Available online at http://atlas.gwsp.org Water Stressed Areas Of the World

6
GWSP Digital Water Atlas (2008). Map 32: Virtual Water Flows between World-Regions (V1.0). Available online at http://atlas.gwsp.org Virtual Water Flows between World Regions

7
The water footprint Source: Hoekstra and Chapagain 2008 3827 5835127314817 Export Equivalent to 4.5 m3 per day

8
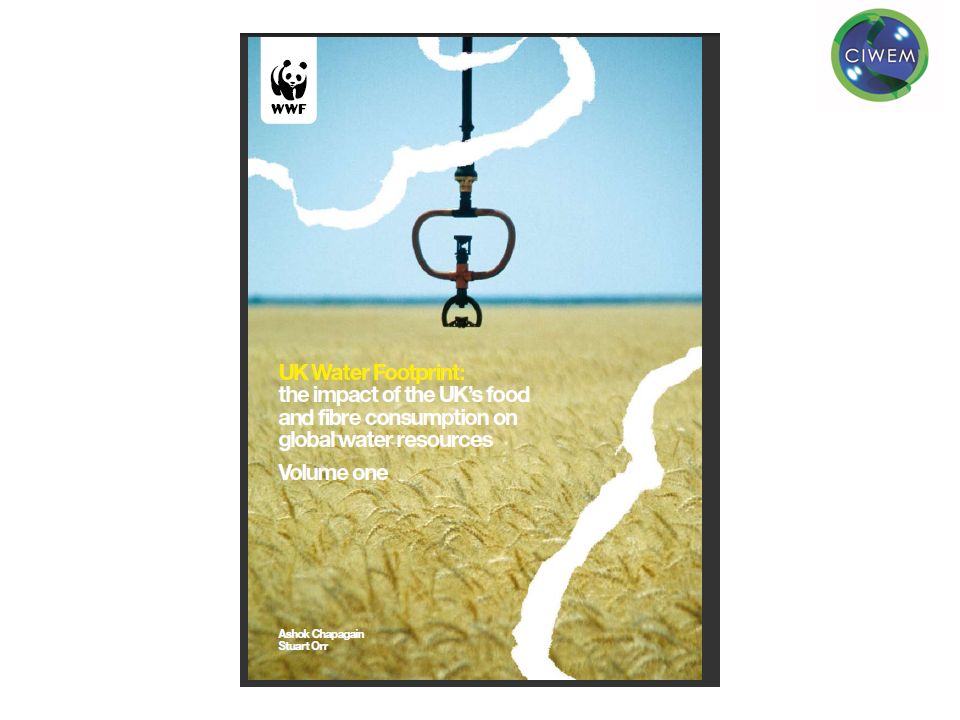
UK’s Agricultural WF and Water Stressed Areas Chapagain, A. K. and S. Orr (2008) UK Water Footprint: The impact of the UK's food and fibre consumption on global water resource, World Wide Fund for Nature
 UK Water Footprint: The impact of the UK s food and fibre consumption on global water resource, World Wide Fund for Nature.")
9
GWSP Digital Water Atlas (2008). Map 15: Water Consumption for Irrigation (V1.0). Available online at http://atlas.gwsp.org Water Consumption for Irrigation

10
Total Agricultural WF of the UK Contribution of Crops to UK’s Internal & External WF Chapagain, A. K. and S. Orr (2008) UK Water Footprint: The impact of the UK's food and fibre consumption on global water resource, World Wide Fund for Nature
 UK Water Footprint: The impact of the UK s food and fibre consumption on global water resource, World Wide Fund for Nature.")
11
UK’s External Agricultural Water Footprint Chapagain, A. K. and S. Orr (2008) UK Water Footprint: The impact of the UK's food and fibre consumption on global water resource, World Wide Fund for Nature
 UK Water Footprint: The impact of the UK s food and fibre consumption on global water resource, World Wide Fund for Nature.")
12
Tomatoes Cotton Chapagain, A. K. and S. Orr (2008) UK Water Footprint: The impact of the UK's food and fibre consumption on global water resource, World Wide Fund for Nature
 UK Water Footprint: The impact of the UK s food and fibre consumption on global water resource, World Wide Fund for Nature.")
13
Agricultural WF Spain to UK Chapagain, A. K. and S. Orr (2008) UK Water Footprint: The impact of the UK's food and fibre consumption on global water resource, World Wide Fund for Nature
 UK Water Footprint: The impact of the UK s food and fibre consumption on global water resource, World Wide Fund for Nature.")
14
Abstractions across Europe http://www.eea.europa.eu/data-and-maps/indicators/use-of-freshwater-resources/use-of-freshwater-resources-assessment-2

15
Water Exploitation Index - Europe

16
Flood events in Europe 1998 - 2009 European Environment Agency http://www.eea.europa.eu/data-and- maps/figures/occurrence-of-flood- events-in-europe-1998

17
Major Drought Events in Europe – last 10 Years European Environment Agency http://www.eea.europ a.eu/data-and- maps/figures/main- drought-events-in- europe-200020132009

18
Major threats to Biodiversity

Similar presentations


 is useful information. You should write it in your notes IN YOUR OWN WORDS.>")


