Download presentation
Presentation is loading. Please wait.

1
SCIENTIFIC METHOD SNC 1DI

2
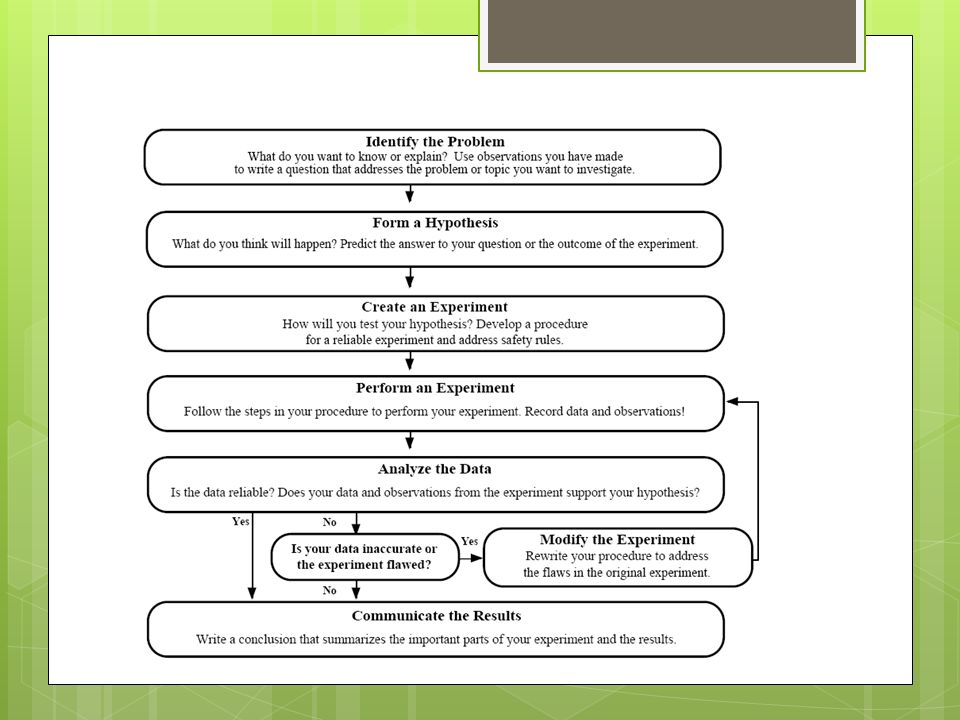
WHAT IS THE SCIENTIFIC METHOD? A process that is used to answer questions about the world around us begins with a question to be answered or observation to be explained and provides a method for conducting and analyzing an experiment

3
IDENTIFY THE PROBLEM What do you want to know or explain? Testable questions are written to show an obvious cause and effect relationship atio Observation Some trees turn different colours in the fall. Brainstorm questions1.Why do leaves change colour? 2.Why don’t all leaves change colour at the same time? 3.Why do leaves of different types of trees change different colours? Testable questions1.Will temperature change affect the colour of leaves in maple trees? 2.Will day length affect the colour of leaves in oak trees?

4
IN ALL TESTABLE QUESTIONS THERE IS A CAUSE AND EFFECT RELATIONSHIP. THESE ARE CALLED VARIABLES. independent variable (IV) the part that you are changing in the test i.e. ball release height dependent variable (DV) The part that changes because of the IV i.e. ball bounce back height control variable (CV) these are the parts that you could also change, but we keep them the same in the test to make sure only the IV is affecting the outcome i.e. type of ball, inflation of ball, type of surface, etc.
 the part that you are changing in the test i.e. ball release height dependent variable (DV) The part that changes because of the IV i.e. ball bounce back height control variable (CV) these are the parts that you could also change, but we keep them the same in the test to make sure only the IV is affecting the outcome i.e. type of ball, inflation of ball, type of surface, etc..")
5
HYPOTHESIS / PREDICTION what you think will happen – a prediction based on your reasoning or previous knowledge, suggest an answer or reason why the independent variable affects the dependent variable It does not matter if your prediction is right or wrong! Hypothesis statements are set up in a specific way: IF and THEN are used to separate the IV and DV Control variables are generally not listed in the hypothesis i.e. if the ball is released from a certain height then it will always bounce back at a lower height

6
CREATE AN EXPERIMENT How will you test your hypothesis? Develop a procedure for a reliable experiment and address the safety rules

7
CREATE AN EXPERIMENT – MATERIALS AND PROCEDURE Materials Should be written in a list with drawings of unusual equipment Procedure Numbered in logical steps, detailed enough to do it exactly Description of quantities, timing, etc must be included Eg. Rather than ‘pour the water into the jar’, use ‘slowly pour 250mL of 20 o C tap water into the 1L glass jar’ Checking controls should be part of the experimental procedure (for example, measure the same height each time, etc.)
.")
8
PERFORM AN EXPERIMENT Follow the steps in your procedure to perform your experiment Record data and observations!

9
PERFORM AN EXPERIMENT -OBSERVATIONS There are many ways to gather information about an observation Qualitative analysis includes observations of colour, state, smell, texture, taste, hardness, etc. Quantitative analysis includes measurements of height, mass, temperature, etc. Quantitative observations are important in science because sometimes our senses can be fooled

10
OBSERVATIONS Observations should be clear, concise and organized This usually involves putting your gathered information into charts, graphs, diagrams, and written descriptions Chart format Table 1: Drop Height vs. Bounce Height Drop Height (cm)Bounce Height (cm) 5040 10080 150120 200160
Bounce Height (cm)")
11
OBSERVATIONS Graph format Any time the IV and DV were both measured with numbers (quantitative) you can use a line graph Figure 1: Engine Size and Maximum Car Speed Engine size (litres) Car speed (km/h)
 you can use a line graph Figure 1: Engine Size and Maximum Car Speed Engine size (litres) Car speed (km/h)")
12
OBSERVATIONS When at least one of the variables is qualitative you can use a bar graph For example, a bar graph can be used to plot the population number in each country (see page 554 in your text for another example) Circle graphs can be used with the same type of information required to do a bar graph (see page 554 of your text for an example)
 Circle graphs can be used with the same type of information required to do a bar graph (see page 554 of your text for an example)")
13
ANALYZE THE DATA Is the data reliable? Does the data and observations from the experiment support your hypothesis? YES? YES? NO? NO?

14
MODIFY THE EXPERIMENT Rewrite your procedure to address the flaws in the original experiment What step do we have to go back to? previous step previous step

15
COMMUNICATE THE RESULTS Write a conclusion that summarizes the important parts of your experiment and the results

16
CONCLUSION Once the experiment has concluded, the experimenter must go back to the hypothesis to see whether the results supported, partially supported or rejected the hypothesis The conclusion should state if the hypothesis was right or wrong, the results that proved this conclusion and provide an explanation for the results

17
CONCLUSION It is important to reflect on events in order to learn from them: What went well? What were the challenges? What could be improved? What would you do differently if you were to complete the investigation again? Be sure to also include any experimental error that may have occurred during the experiment. Example Next time chemicals should be pre-mixed to save time. A possible source of error was that the same thermometer was not used every day, and perhaps they weren’t all calibrated the same.

Similar presentations


>")


