Download presentation
Presentation is loading. Please wait.

1
An Assessment & Design Tool for Adaptation to Climate Change Michael Westphal, Fareeha Iqbal, Ian Noble World Bank mwestphal@worldbank.org

2
Rationale of ADAPT Climate Change is occurring Constitutes a threat to development and impacts must be factored into development decisions Barrier to action is uncertainty But, we often have sufficient knowledge to guide decision makers now along paths of cc resiliency Contact Michael Westphal, World Bank mwestphal@worldbank.org

3
Climate Change Impacts Disproportionate 2 billion people in developing countries were affected by climate related disasters in the 1990s and the rate may double this decade People in developing countries are affected at 20 times the rate of those in developed countries Contact Michael Westphal, World Bank mwestphal@worldbank.org

4
Urgent Need to Screen 25% of projects climate sensitive (2001-2005) $5B worth of project components potentially vulnerable to cc impacts (annual lending ~ $20B) Contact Michael Westphal, World Bank mwestphal@worldbank.org
 $5B worth of project components potentially vulnerable to cc impacts (annual lending ~ $20B) Contact Michael Westphal, World Bank")
5
Screening & design tool (ADAPT) Target Audience: Project developers (national, bilateral and multilateral) and assessors; NGOs Not for technical expert Not community level decision making –This is a different, and critically important task –Seek compatibility and synergies Contact Michael Westphal, World Bank mwestphal@worldbank.org Purpose: Provide a first, quick check of potential issues that might arise in project design or implementation (35,000 ft level screen) Provide a lead into appropriate knowledge & experience Increase awareness of the issues of climate variability and change
 Target Audience: Project developers (national, bilateral and multilateral) and assessors; NGOs Not for technical expert Not community level decision making –This is a different, and critically important task –Seek compatibility and synergies Contact Michael Westphal, World Bank Purpose: Provide a first, quick check of potential issues that might arise in project design or implementation (35,000 ft level screen) Provide a lead into appropriate knowledge & experience Increase awareness of the issues of climate variability and change")
6
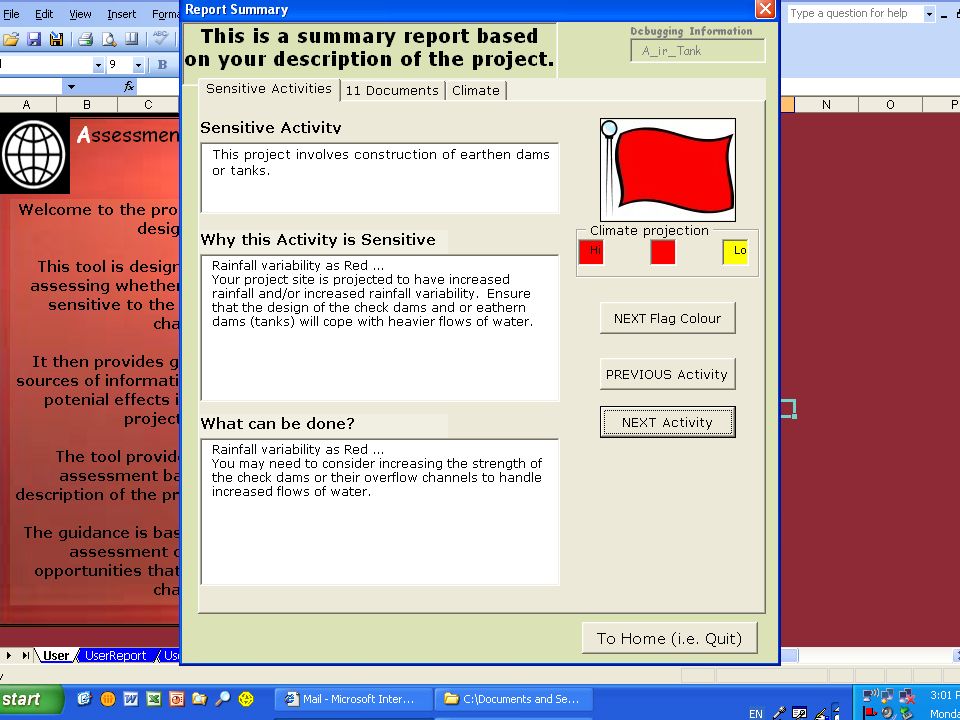
ADAPT Levels of advice provided –Red flag – adaptation issues are important and further follow up is strongly recommended –Yellow flag – some concerns, which should be checked –Orange – Not enough known to assess –Green flag – No adaptation issues foreseen –Blue flag – Positive action for adaptation Easy to use (Excel-based, GUI) Based on existing knowledge Captured via expert systems to identify key activities that might be sensitive to climate variability & change Qualitative climate change data base combining models and current trends Qualitative assessment of risks and opportunities Pointers to appropriate literature, projects, tolls and experts Contact Michael Westphal, World Bank mwestphal@worldbank.org
 Based on existing knowledge Captured via expert systems to identify key activities that might be sensitive to climate variability & change Qualitative climate change data base combining models and current trends Qualitative assessment of risks and opportunities Pointers to appropriate literature, projects, tolls and experts Contact Michael Westphal, World Bank")
7
A framework for a screening & design tool User Guidance on risk avoidance and adaptation options Additional tools Document database Project database Experts Risk elements & Location Direction of climate change (increase, no change, decrease, unknown) Activities Climate sensitivit y Climate parameter (eg average rainfall, rainfall variability, temperature etc) Climate sensitivity for an activity Climate parameter Location Projected direction of climate change Technically complex : Multiple models – changing data bases What project managers need to know
 Activities Climate sensitivit y Climate parameter (eg average rainfall, rainfall variability, temperature etc) Climate sensitivity for an activity Climate parameter Location Projected direction of climate change Technically complex : Multiple models – changing data bases What project managers need to know")
8
A framework for a screening & design tool based on expert advice User Guidance on risk avoidance and adaptation options Additional toolsDocument database Project database Experts Risk elements & Location Direction of climate change (increase, no change, decrease, unknown) Activities Climate sensitivit y Climate parameter (eg average rainfall, rainfall variability, temperature etc) Climate sensitivity for an activity Climate parameter Location Projected direction of climate change Selected scenarios and current trends Expert assessment of relevant activities Expert assessment of sensitivities
 Activities Climate sensitivit y Climate parameter (eg average rainfall, rainfall variability, temperature etc) Climate sensitivity for an activity Climate parameter Location Projected direction of climate change Selected scenarios and current trends Expert assessment of relevant activities Expert assessment of sensitivities")
9
A framework for a screening & design tool User Guidance on risk avoidance and adaptation options What does the user see? Additional tools Document database Project database Experts Risk elements & Location Direction of climate change (increase, no change, decrease, unknown) Activities Climate sensitivit y Climate parameter (eg average rainfall, rainfall variability, temperature etc) Climate sensitivity for an activity Climate parameter Location Projected direction of climate change Relevant guidance to … gdfsgfd Leading to … A series of questions about their project
 Activities Climate sensitivit y Climate parameter (eg average rainfall, rainfall variability, temperature etc) Climate sensitivity for an activity Climate parameter Location Projected direction of climate change Relevant guidance to … gdfsgfd Leading to … A series of questions about their project.")
10
Assessment & Design for Climate Change – a Prototype Tool -- ADAPT

11
Point-and-click map to identify project location, program queries geo-referenced climate data Mapping Module

12
Help about the question and about each option Ability to change ones mind

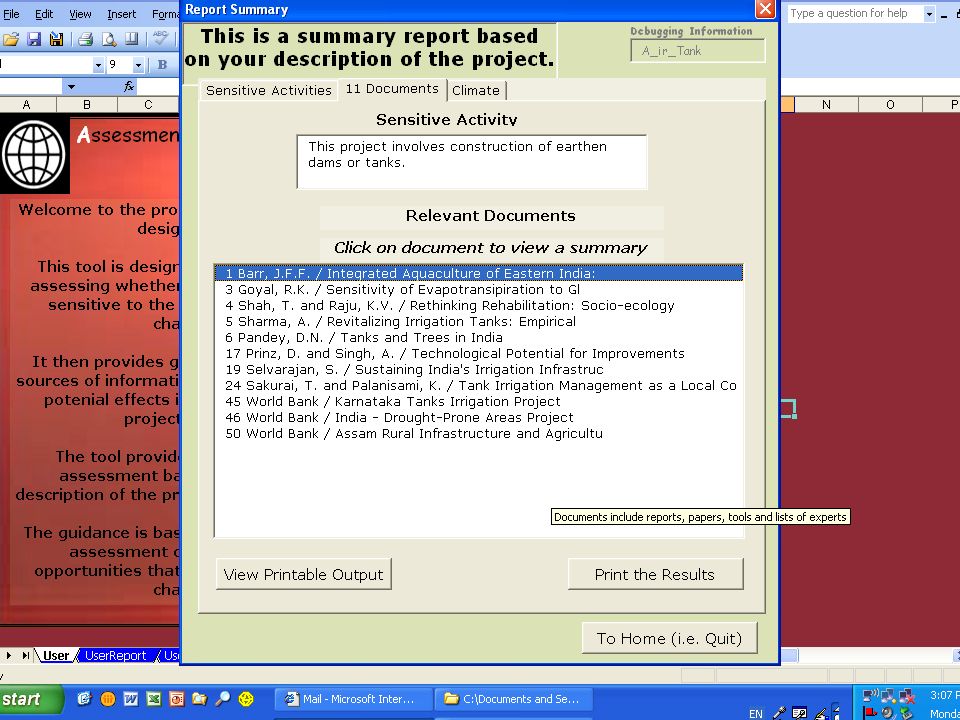
17
Printed list of documents

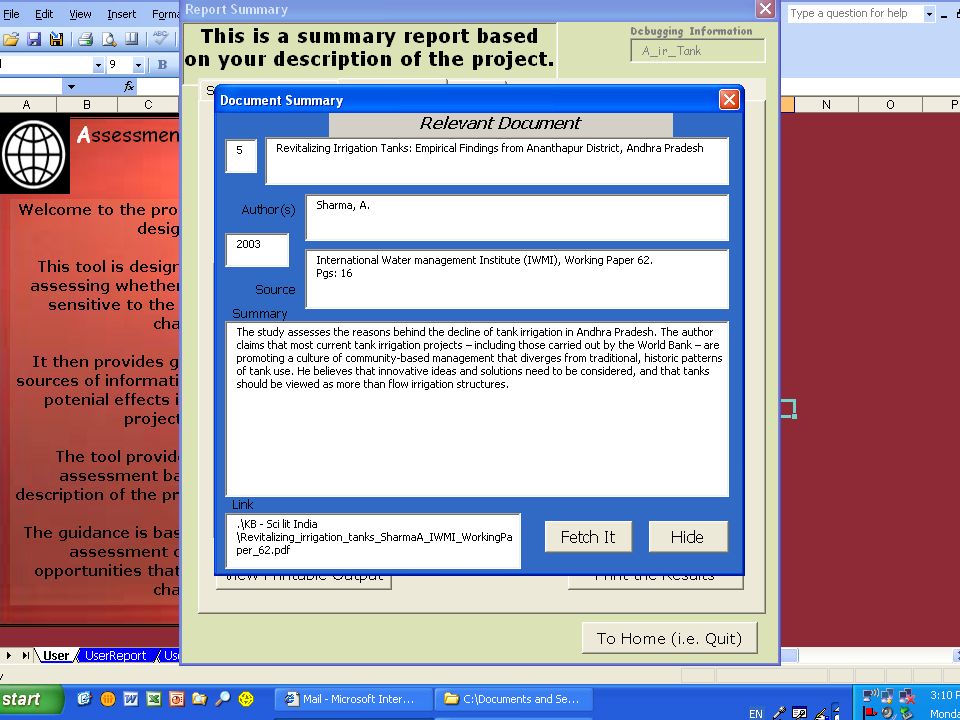
18
Printed summary

19
Climate (-Related) Data Hadley Centre PRECIS data for all of India (IITM) (SRES A2, B2; 2071 – 2100) Global 20km resolution data (Japanese Meteorological Institute; A1B, 2080 - 2099) Other Regional Models as available Other datasets: runoff (Milly, Scholze, Nohara), biodiversity-related (wildfire frequency, biome change), crop yield projections? ~6 – 10 variables/metrics

20
Economic Sectors Now: agriculture and irrigation (South Asian focus), general biodiversity Future: African agriculture (plus finer regional specificity) Infrastructure: rural roads, water resource Cities?
, general biodiversity Future: African agriculture (plus finer regional specificity) Infrastructure: rural roads, water resource Cities")
21
Project Site Location Lat and Long Agroecosystems and climate characterization Description of Local Farming/Livelihoods Systems and current constraints Focalized Focalized ADAPT screening Tool Questionnaire Report Climate predictions/projections Risks associated with identified sensitive agricultural activities (Flags) Possible CC Adaptation Strategies References and additional info (including brief summaries on critical activities and/or examples from other locations) Expert contact list ADAPT: Improved Agricultural Scheme
 Possible CC Adaptation Strategies References and additional info (including brief summaries on critical activities and/or examples from other locations) Expert contact list ADAPT: Improved Agricultural Scheme")
22
Example: Project within the African Sahel Region Description of Local Farming/Livelihoods Systems and present constraints ZoneClimatic conditions Farming/Livelihoods System Current limitations Climate Change impacts on local activities Arid / Semiarid < 75 growing period days for arid regions. Up to 180 days in semiarid ones. Long dry periods without any vegetal production. Dryland ecosystems are characterized by high levels of temporal and spatial variability in rainfall and in biomass production (Annual Rainfall CV is ~ 30% in drier areas). Livestock/ rangeland and some mixed farming systems High mobile agricultural systems on communal lands following pastures and water Agricultural areas compete with pastoral lands. Common rainfed crops are millet, corn sorghum, grundnuts, sweet potato. Soils are susceptible to waterlogging (short wet season) and erosion (long dry season). Extensive overgrazing in rangeland areas. Introduction of external inputs to increase production is risky, given the uncertainty of rainfall and severe degradation of soil resources. With increased Temp and general reduced Rainfall we could expect: Very low production and availability of quality pastures for grazing Scarcity and high demand of watering points Cultivation of the land more limited as soils continue to be infertile and degraded due to overgrazing and erosion. Focalized Focalized ADAPT Screening Tool Questionnaire
. Livestock/ rangeland and some mixed farming systems High mobile agricultural systems on communal lands following pastures and water Agricultural areas compete with pastoral lands. Common rainfed crops are millet, corn sorghum, grundnuts, sweet potato. Soils are susceptible to waterlogging (short wet season) and erosion (long dry season). Extensive overgrazing in rangeland areas. Introduction of external inputs to increase production is risky, given the uncertainty of rainfall and severe degradation of soil resources. With increased Temp and general reduced Rainfall we could expect: Very low production and availability of quality pastures for grazing Scarcity and high demand of watering points Cultivation of the land more limited as soils continue to be infertile and degraded due to overgrazing and erosion. Focalized Focalized ADAPT Screening Tool Questionnaire.")
23
Limitations/Challenges of Tool Does not assess their interaction of project components. Local optima, not global optima (project level, not explicit sectoral adaptation) No socioeconomics, parsing of community - can it be used for guidance at a policy level? Can it guide location selection for a pre- determined set of project activities, if location still TBD?
 No socioeconomics, parsing of community - can it be used for guidance at a policy level. Can it guide location selection for a pre- determined set of project activities, if location still TBD .")
24
Challenges with Regard to Users Widespread use? If we don’t want to make its use mandatory, what incentives do we need to provide PMs? Acting on its advice? Will users change near-term behaviour for what they may perceive to be a mid- to long- term term issue? Quantum mechanical: Some users may find its advice too technical/detailed, while others may find it too basic. Not a Decision-making tool: the tool aims at guiding users on issues and options, but does not tell them exactly what to do.

25
Lessons changes made to the tool on popular demand Originally meant to do a quick screen for potential vulnerability – now also provides adaptation advice. Various climate-related spatial data layers will now be included outside the question stream (climate projections, hazards, water resources, human health, biodiversity). 2-pg technical notes being developed that cover main issues on key activities (to condense info in literature). Minor changes to user interface to make more user- friendly.
. 2-pg technical notes being developed that cover main issues on key activities (to condense info in literature). Minor changes to user interface to make more user- friendly..")
Similar presentations
>")


