Download presentation
Presentation is loading. Please wait.

1
Making Data Work for Kids: EVAAS Teacher Reports October 2012 SAS ® EVAAS ® for K-12

2
Why should you care about your EVAAS Teacher Value Added Report? Beginning with your 2013 report, it becomes part of your evaluation. Standard 6 – Teachers contribute to the academic success of their students. (Measurable Progress) Standard 4 – Teachers facilitate learning for their students »Teachers plan instruction appropriate for their students »Use data for short and long range planning Standard 5 – Teachers reflect on their practice. »Teacher analyze student learning. But your report is not just an evaluation component. It is also a powerful tool for improving your effectiveness as a teacher. So why else should you care?
 Standard 4 – Teachers facilitate learning for their students »Teachers plan instruction appropriate for their students »Use data for short and long range planning Standard 5 – Teachers reflect on their practice. »Teacher analyze student learning. But your report is not just an evaluation component. It is also a powerful tool for improving your effectiveness as a teacher. So why else should you care .")
3
Why should you care about your EVAAS Teacher Value Added Report? You care about your students.

4
Achievement vs. Progress Student Progress – How far have I come? Highly dependent on what happens as a result of schooling rather than on demographic factors.

5
High-Achieving Students and Progress All schools in Tennessee in 2011 - Math students in grades 4 through 8. Districts, schools, and teachers that serve high achieving students can make excellent progress, just as easily as those that serve low achieving students.

6
High-Achieving Students and Progress All schools in Pennsylvania in 2011 - Math students in grades 4 through 8. Districts, schools, and teachers that serve high achieving students can make excellent progress, just as easily as those that serve low achieving students.

7
Achievement vs. Progress By concentrating on the progress students make, EVAAS puts the emphasis on something educators are responsible for and can do something about. Average progress (one year of academic gain) is the minimum expectation. In other words, it is expected that students will not lose ground, relative to their peers, in the course of the year.
 is the minimum expectation. In other words, it is expected that students will not lose ground, relative to their peers, in the course of the year..")
8
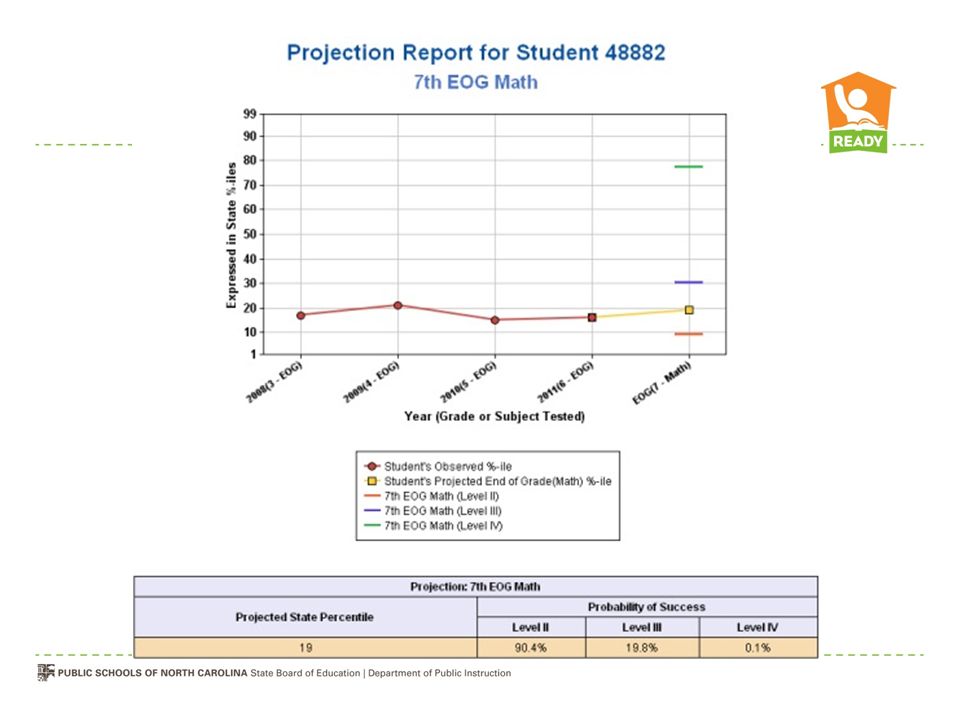
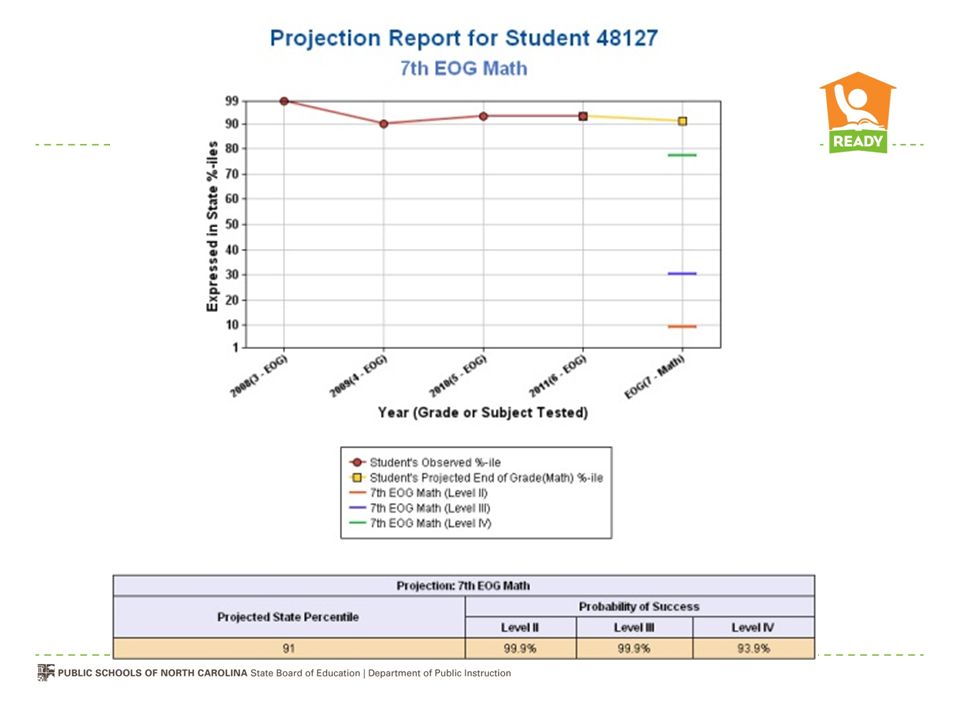
Understanding Value Added Projection report looks at past testing information and projects how a student will perform. Student’s own past performance Performance of students who have taken the test previously Students must have three prior test scores for something to be included in the teacher’s predictive report Whole cohort of students analyzed

15
EVAAS can tell you WHAT happened. It’s up to YOU to determine WHY it happened and what you want to do about it. Improve the Education Program EVAAS Local Knowledge & Expertise

16
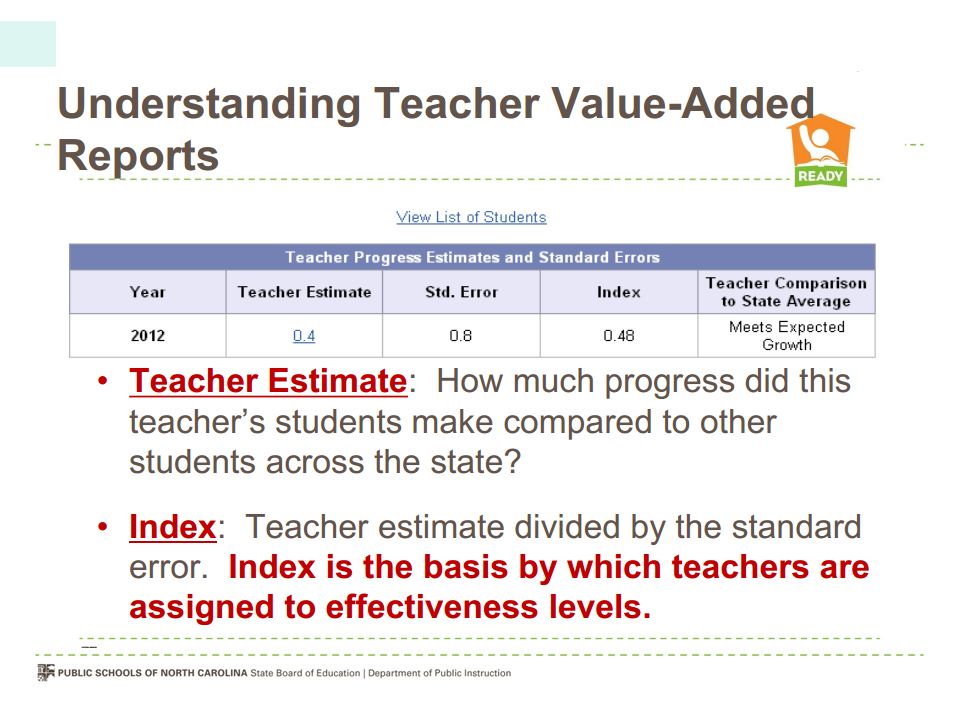
Information about Teacher Reports State Growth Standards/State Average = 0.0 Standard Error = a measure of uncertainty Usually, the more data you have, the smaller the standard error Index = Teacher Estimate divided by Standard Error

17
Effectiveness Categories 0.0 Index is equal to or greater than a -2 but less than +2 Index is 2 or higher Index is less than -2 State Growth Standard/State Average = 0.0 Standard Error = a measure of uncertainty Usually, the more data you have, the smaller the standard error. Index = Teacher Estimate divided by its Standard Error

18
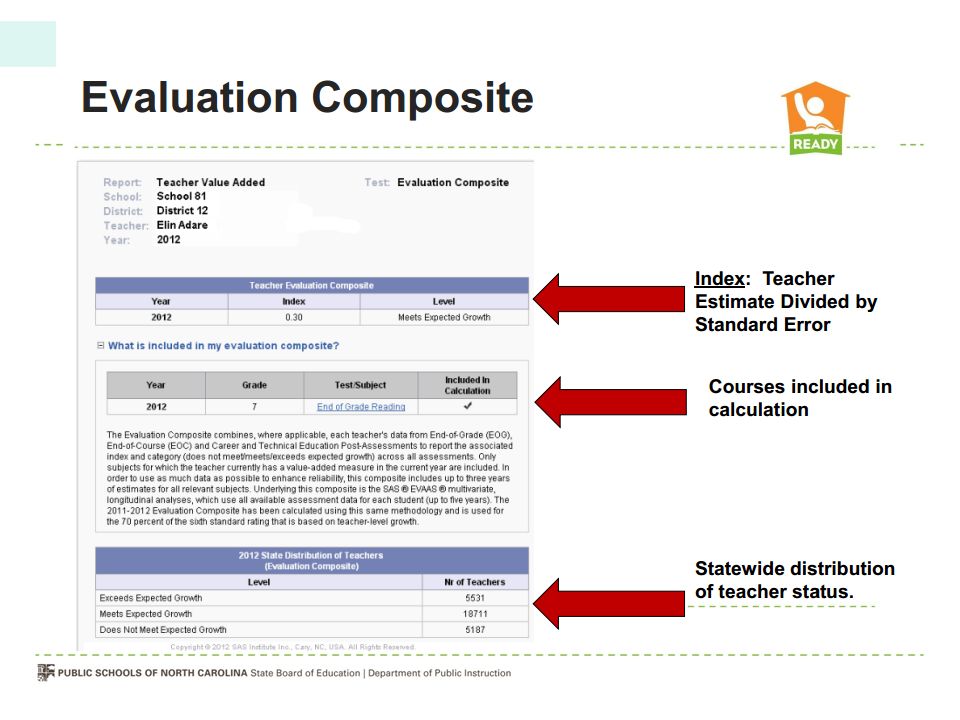
EVAAS Teacher Value Added Report Rules of Effectiveness Level Determination Exceeds Expected Growth: Teachers whose students are making substantially more progress than the state average (the teacher's index is 2 or greater). Meets Expected Growth: Teachers whose students are making the same amount of progress as the state average (the teacher's index is equal to or greater than -2 but less than 2). Does Not Meet Expected Growth: Teachers whose students are making substantially less progress than the state average (the teacher's index is less than -2).
. Does Not Meet Expected Growth: Teachers whose students are making substantially less progress than the state average (the teacher s index is less than -2)..")
19
Student Teacher Linkages

20
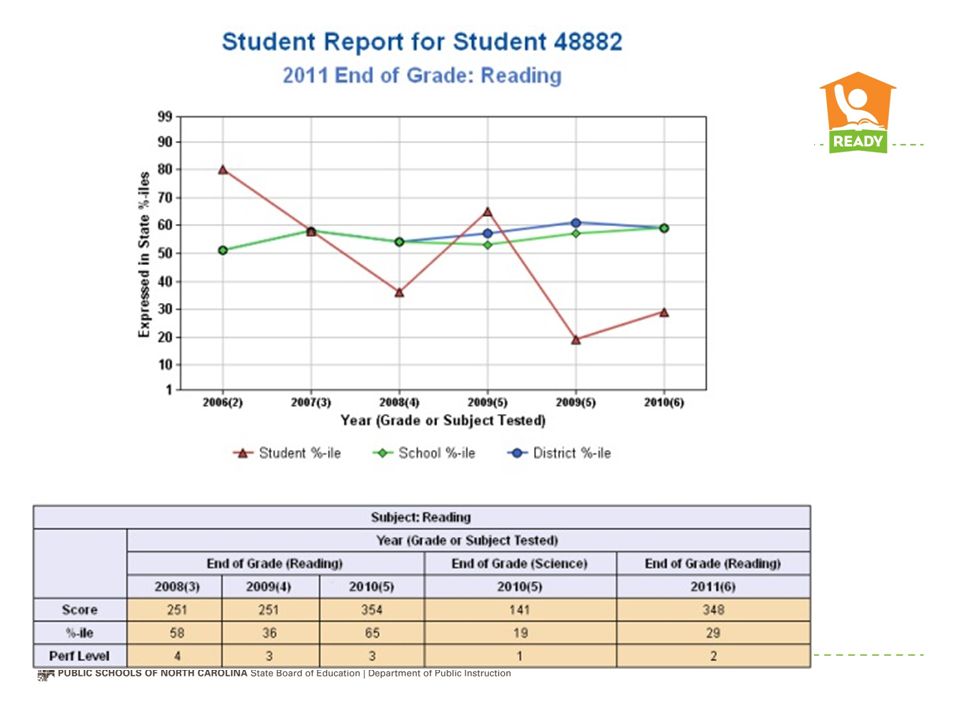
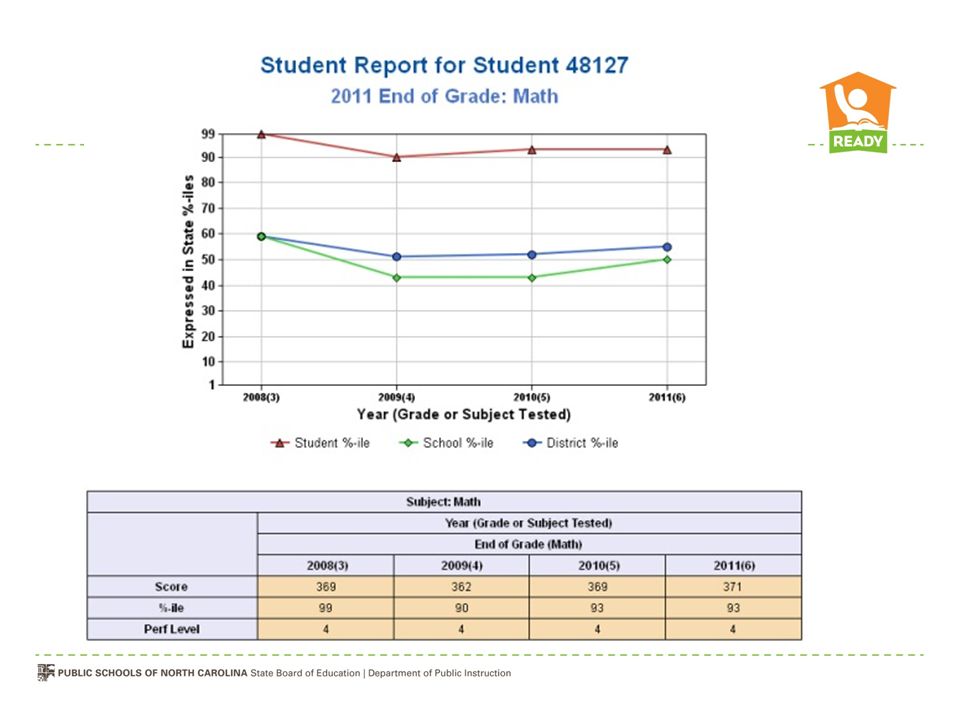
EVAAS Student Report

21
EVAAS Teacher Value Added Report Supplemental Information Table

23
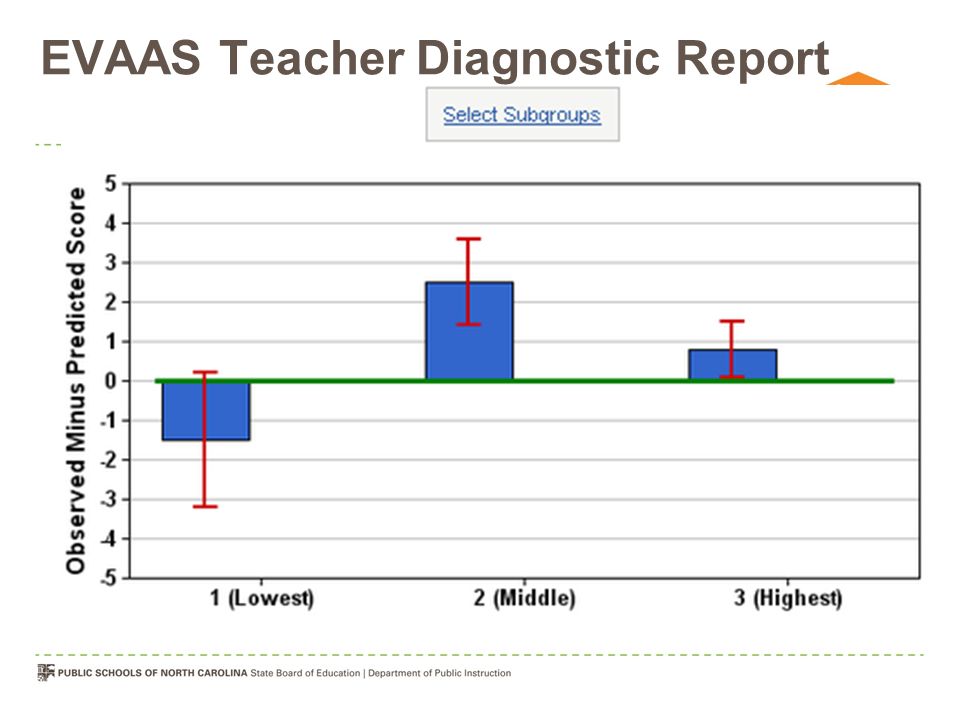
EVAAS Teacher Diagnostic Report

26
Making Generalizations and Inferences What generalizations and inferences can we make? What don’t we know? How do we find out?

27
School Composites

30
Underlying Philosophy All students deserve opportunities to make appropriate academic progress every year. There is no “one size fits all” way of educating students who enter a class at different levels of academic achievement. Adjustments to instruction should be based on the academic attainment of students, not on socio-economic factors. Given reliable information on past effectiveness, educators can make appropriate adjustments to improve student opportunities. "What teachers know and can do is the most important influence on what students learn." (National Commission on Teaching and America's Future, 1996) One of the most important things educators can know is who they are effective with and who they are not.
 One of the most important things educators can know is who they are effective with and who they are not..")
31
SAS EVAAS Questions? Sandy.Horn@sas.com http://ncdpi.sas.com

Similar presentations


: A Compass for Improvement Oxford Area School District February 14, 2013.>")

 Classroom Effectiveness Index (CEI) Data Analysis, Reporting, and Research Services.>")

![Enquiring mines wanna no.... Who is it? Coleman Report “[S]chools bring little influence to bear upon a child’s achievement that is independent of.](/15/4758624/big_thumb.jpg "Enquiring mines wanna no.... Who is it? Coleman Report “[S]chools bring little influence to bear upon a child’s achievement that is independent of.>")
>")

/8751.>")
