Download presentation
Presentation is loading. Please wait.

1
Best Practices for Teaching Statistics within the AP Psychology Curriculum Melissa J. Kennedy, PhD. Holy Names Academy Seattle, Washington

2
Let’s Talk About Research & Statistics!

3
Fall 2010 Course Description: Topics & Learning Objectives Objectives for Research Methods (8-10%) Psychology is an empirical discipline. Psychologists develop knowledge by doing research. Research provides guidance for psychologists who develop theories to explain behavior and who apply theories to solve problems in behavior.

4
Fall 2010 Course Description: Content Outline II. Research Methods.............. 8–10% – A. Experimental, Correlational, and Clinical Research – B. Statistics 1. Descriptive 2. Inferential – C. Ethics in Research

5
Fall 2010 Course Description: Topics & Learning Objectives Objectives for Testing and Individual Differences (5–7%) An understanding of intelligence and assessment of individual differences is highlighted in this portion of the course. Students must understand issues related to test construction and fair use.

6
Fall 2010 Course Description: Content Outline XI. Testing and Individual Differences.... 5–7% A. Standardization and Norms B. Reliability and Validity C. Types of Tests D. Ethics and Standards in Testing E. Intelligence

7
Fall 2010 Course Description: Topics & Learning Objectives Objectives: Personality (5–7%) In this section of the course, students explore major theories of how humans develop enduring patterns of behavior and personal characteristics that influence how others relate to them. The unit also addresses research methods used to assess personality.

8
Fall 2010 Course Description: Content Outline X. Personality..................... 5–7% A. Personality Theories and Approaches B. Assessment Techniques C. Growth and Adjustment

9
The Mind Reader Karnak, the Educator by Robert B. Bain available at http://www.apa.org/education/k12/karnak.as px http://www.apa.org/education/k12/karnak.as px HIGHLY Recommended Activity

10
Overconfidence Exercise Activity Truth or Lie?

11
Research Methods The Scientific Method

12
Research Designs #1. Differentiate types of research (e.g., experiments, correlational studies, survey research, naturalistic observations, and case studies) with regard to purpose, strengths, and weaknesses.
 with regard to purpose, strengths, and weaknesses..")
13
Research Methods Case Study Naturalistic Observation Survey Correlational Study

14
Activity Worksheet MethodDescriptionType of Data (Qualitative, Quantitative or Either/Both) AdvantagesDisadvantages Case Study Naturalistic Observation Survey Correlational Study Experiment
 AdvantagesDisadvantages Case Study Naturalistic Observation Survey Correlational Study Experiment")
15
Applet Understanding Correlation

16
Activity Experimental Practice Exercise #1 Additional Practice Exercises at End of Slide Show and in Handout Packet Cell phones and brain cancer One study of cell phones and the risk of brain cancer looked at a group of 469 people who have brain cancer. The investigators matched each cancer patient with a person of the same age, sex, and race who did not have brain cancer, then asked about the use of cell phones. Result: “Our data suggest that the use of handheld cellular phones is not associated with risk of brain cancer.” (a) Is this an observational study or an experiment? Justify your answer. (b) Based on this study, would you conclude that cell phones do not increase the risk of brain cancer? Why or why not? All exercises from: Yates, D.S., Moore, D.S., & Starnes, D.S. (2007)The Practice of Statistics, 3rd. Ed., New York, NY: W.H.Freeman.
 Is this an observational study or an experiment. Justify your answer. (b) Based on this study, would you conclude that cell phones do not increase the risk of brain cancer. Why or why not. All exercises from: Yates, D.S., Moore, D.S., & Starnes, D.S. (2007)The Practice of Statistics, 3rd. Ed., New York, NY: W.H.Freeman..")
17
Experimental Design Practice Problem (#2) Survey, experiment, or observational study? What is the best way to answer each of the questions below: a survey, an experiment, or an observational study that is not a survey? Explain your choices. For each question, write a few sentences about how such a study might be carried out. (a) Are people generally satisfied with how things are going in the country right now? (b) Do college students learn basic accounting better in a classroom or using an online course? (c) How long do your teachers wait on the average after they ask the class a question? Activity All exercises from: Yates, D.S., Moore, D.S., & Starnes, D.S. (2007)The Practice of Statistics, 3rd. Ed., New York, NY: W.H.Freeman.
 Are people generally satisfied with how things are going in the country right now. (b) Do college students learn basic accounting better in a classroom or using an online course. (c) How long do your teachers wait on the average after they ask the class a question. Activity All exercises from: Yates, D.S., Moore, D.S., & Starnes, D.S. (2007)The Practice of Statistics, 3rd. Ed., New York, NY: W.H.Freeman..")
18
Experimental Design Practice Problem (#3) I'll drink to that! In adults, moderate use of alcohol is associated with better health. Some studies suggest that drinking wine rather than beer or spirits yields added health benefits. (a) Explain the difference between an observational study and an experiment to compare people who drink wine with people who drink beer. (b) Suggest some characteristics of wine drinkers that might benefit their health. In an observational study, these characteristics are mixed up with the effects of drinking wine on people's health. Activity All exercises from: Yates, D.S., Moore, D.S., & Starnes, D.S. (2007)The Practice of Statistics, 3rd. Ed., New York, NY: W.H.Freeman.
 Explain the difference between an observational study and an experiment to compare people who drink wine with people who drink beer. (b) Suggest some characteristics of wine drinkers that might benefit their health. In an observational study, these characteristics are mixed up with the effects of drinking wine on people s health. Activity All exercises from: Yates, D.S., Moore, D.S., & Starnes, D.S. (2007)The Practice of Statistics, 3rd. Ed., New York, NY: W.H.Freeman..")
19
Experimental Design Practice Problem (#4) Abstinence or not? An August 2004 Gallup Poll asked 439 teens aged 13 to 17 whether they thought young people should abstain from sex until marriage. 56% said “Yes.” (a) If Gallup had asked all teens aged 13 to 17 this question, would exactly 56% have said “Yes”? Explain. (b) In this sample, 48% of the boys and 64% of the girls said “Yes.” Are you convinced that a higher percent of girls than boys aged 13 to 17 feel this way? Why or why not? All exercises from: Yates, D.S., Moore, D.S., & Starnes, D.S. (2007)The Practice of Statistics, 3rd. Ed., New York, NY: W.H.Freeman. Activity
 If Gallup had asked all teens aged 13 to 17 this question, would exactly 56% have said Yes . Explain. (b) In this sample, 48% of the boys and 64% of the girls said Yes. Are you convinced that a higher percent of girls than boys aged 13 to 17 feel this way. Why or why not. All exercises from: Yates, D.S., Moore, D.S., & Starnes, D.S. (2007)The Practice of Statistics, 3rd. Ed., New York, NY: W.H.Freeman. Activity.")
20
Experimental Design Practice Problem (#5) TV violence. A typical hour of prime-time television shows three to five violent acts. Linking family interviews and police records shows a clear association between time spent watching TV as a child and later aggressive behavior. a. Explain why this is an observational study rather than an experiment. b. Suggest several other variables describing a child’s home life that may be related to how much TV he or she watches. Explain why these variables make it difficult to conclude that more TV causes aggressive behavior? All exercises from: Yates, D.S., Moore, D.S., & Starnes, D.S. (2007)The Practice of Statistics, 3rd. Ed., New York, NY: W.H.Freeman. Activity
The Practice of Statistics, 3rd. Ed., New York, NY: W.H.Freeman. Activity.")
21
Aside from RM: Personality #2 (Personality). Describe and compare research methods (e.g., case studies and surveys) that psychologists use to investigate personality.
 that psychologists use to investigate personality..")
22
Activity OnLine Personality Measures Big Five I: http://www.outofservice.com/bigfive/ Big Five II: http://similarminds.com/big5.html Keirsey Personality Sort: http://www.keirsey.com/sorter/instruments2.aspx?partid=0 Self-Report Personality Exercise

23
Drawing Conclusions From Research #2. Describe how research design drives the reasonable conclusions that can be drawn (e.g, experiments are useful for determining cause and effect; the use of experimental controls reduces alternative explanations).
..")
24
Research Methods

25
Order in Random Events Applet

26
Activity An In-Class Experiment: Chocolate Improves Memory

27
Validity #5. Predict the validity of behavioral explanations based on the quality of research design (e.g., confounding variables limit confidence in research conclusions).
..")
28
Threats to Validity: Confounding or Third Variables Research Methods

29
Threats to Validity: Experimenter Expectancy

30
Research Methods Threats to Validity: Placebo Effects

31
Threats to Validity: Demand Characteristics Research Methods

32
Aside: Testing & Personality # 4 (Testing). Explain how psychologists design tests, including standardization strategies and other techniques to establish reliability and validity. #3 (Personality): Identify frequently used assessment strategies (e.g., the Minnesota Multiphasic Personality Inventory [MMPI], the Thematic Apperception Test [TAT]), and evaluate relative test quality based on reliability and validity of the instruments.
: Identify frequently used assessment strategies (e.g., the Minnesota Multiphasic Personality Inventory [MMPI], the Thematic Apperception Test [TAT]), and evaluate relative test quality based on reliability and validity of the instruments..")
33
Research Methods Reliability Test - Retest

34
Validity Research Methods

35
Random Selection & Random Assignment #4. Distinguish between random assignment of participants to conditions in experiments and random selection of participants, primarily in correlational studies and surveys.

36
Research Methods Random Selection

37
Research Methods 2010 FRQ #1 For each of the pairs below, use an example to show how the first term in each pair affects or is related to the second. Definitions alone without examples will not score. Double-blind research.. bias Random Assignment

38
Variables: Identification #3. Identify independent, dependent, confounding, and control variables in experimental designs.

39
Research Methods IV and DV

40
Research Methods Control & Experimental Groups

41
Variables: Operational Definitions #8. Discuss the value of reliance on operational definitions and measurement in behavioral research. 2010 FRQ #1 For each of the pairs below, use an example to show how the first term in each pair affects or is related to the second. Definitions alone without examples will not score. Operational definition.. replication

42
Research Methods Replication: Operationally Define Variables/Conditions

43
Statistics Statistics is…. Statistics are…..

44
Developing Critical Thinking Key Questions: 1) Who? How many are there? 2) What are the variables? What units recorded? 3) Why were the data gathered? Specific questions or draw conclusions about individuals other than the ones we actually have data for? 4) When, where, how, and by whom were data produced? Where did data come from? Archival or new data to answer current questions? From experiment or observational study? From census or sample? Who directed data production? Can we trust the data? Statistics
 What are the variables. What units recorded. 3) Why were the data gathered. Specific questions or draw conclusions about individuals other than the ones we actually have data for. 4) When, where, how, and by whom were data produced. Where did data come from. Archival or new data to answer current questions. From experiment or observational study. From census or sample. Who directed data production. Can we trust the data. Statistics.")
45
Research Study Summary Assign Research Articles. (i.e., 40 Studies text or Scientific American (SA) or SA The Mind; for academic reprint permission for any SA article: http://www.scientificamerican.com/page.cfm?section=educatio nal). http://www.scientificamerican.com/page.cfm?section=educatio nal Provide Assignment Sheet with critical questions (sample included in handout). Activity
 or SA The Mind; for academic reprint permission for any SA article: section=educatio nal). section=educatio nal Provide Assignment Sheet with critical questions (sample included in handout). Activity.")
46
Descriptive & Inferential Statistics #6. Distinguish the purposes of descriptive statistics and inferential statistics.

47
Descriptive Statistics Statistics Measures of Central Tendency Measures of Variability

48
Application of Descriptive Statistics #7. Apply basic descriptive statistical concepts, including interpreting and constructing graphs and calculating simple descriptive statistics (e.g., measures of central tendency, standard deviation).
..")
49
Graphs Statistics

50
3 Ms of Central Tendency Mode: the most frequent score – Example: 5 9 7 4 6 8 2 4 1 3 5 1 4 6 9 8 7 5 2 4 1 – Ordered: 3 2 1 4 3 2 2 2 2 Statistics 1 1 12 34 4 5 5 56 7 8 9 MODE

51
3 Ms of Central Tendency Median: the the middle score of any ordered set of numbers – Ex (odd # of scores): 3 8 11 11 12 13 24 35 46 – Ex (even # of scores): 3 8 11 11 12 13 24 35 46 48 (12 + 13)/2 = 12.5 = median Statistics MEDIAN
: – Ex (even # of scores): ( )/2 = 12.5 = median Statistics MEDIAN")
52
3 Ms of Central Tendency Mean: the arithmetic average of scores Mean = add their values and divide by the number of observations. If the n observations are x 1, x 2,….. x n1, their mean is: A simpler notation: Statistics

53
Mean, cont. Ex: 3 8 11 11 12 13 24 35 46 48 (3+8+11+11+12+13+24+35+46+48) 10 (211) 1021.1 Statistics
 10 (211) Statistics.")
54
Mean & Median Applet I Mean and Median Applet II Mean and Median Applet III Applet

55
Measures of Variability: Range Range – Range = (highest score – lowest score) – Example: 5 9 7 4 6 8 2 4 1 3 5 1 4 6 9 8 7 5 2 4 1 RANGE: 9 – 1 = 8 Statistics
 – Example: RANGE: 9 – 1 = 8 Statistics")
56
Measures of Variability: Variance Variance = average squared deviation from the mean Statistics

57
Measure of Variance: Standard Deviation Standard deviation: how far, on average, scores vary from the mean. Computed by taking square root of variance. Statistics

58
To Calculate Variance & Standard Deviation ScoresMeanDeviation from Mean Deviation Squared Total Activity

59
The Ever Popular Living Histogram Activity

60
4’6”- 4’7” 4’8”- 4’9” 4’10”- 4’11” 5’0” – 5’1” 5’2”- 5’3” 5’4”- 5’5” 5’6”- 5’7” 5’8” – 5’9” 5’10”- 5’11” 6’0” – 6’1” 6’2”- 6’3”

61
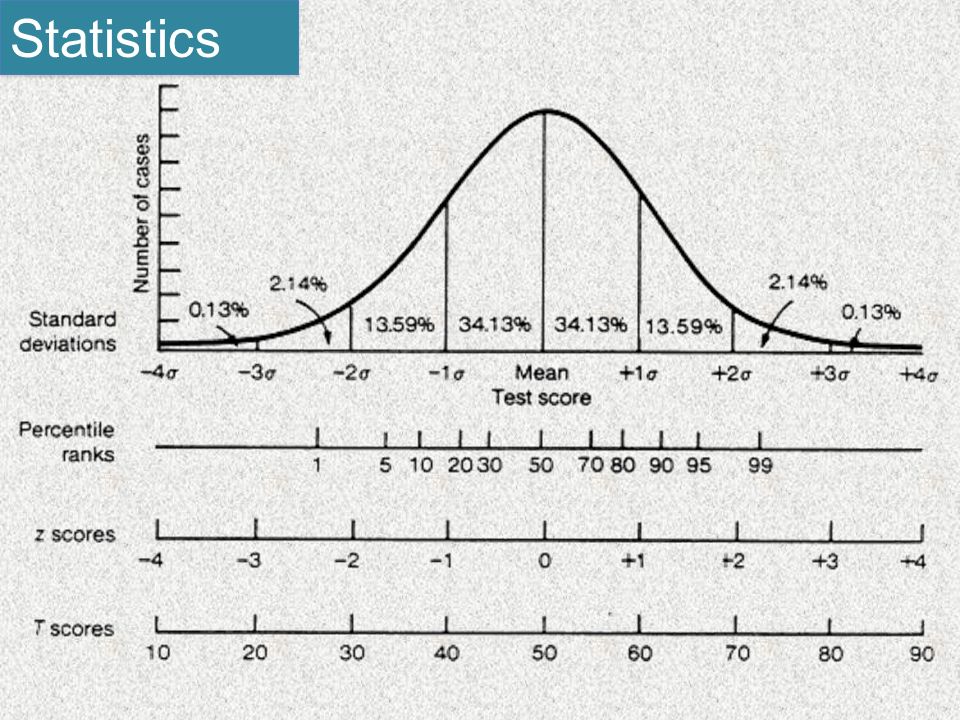
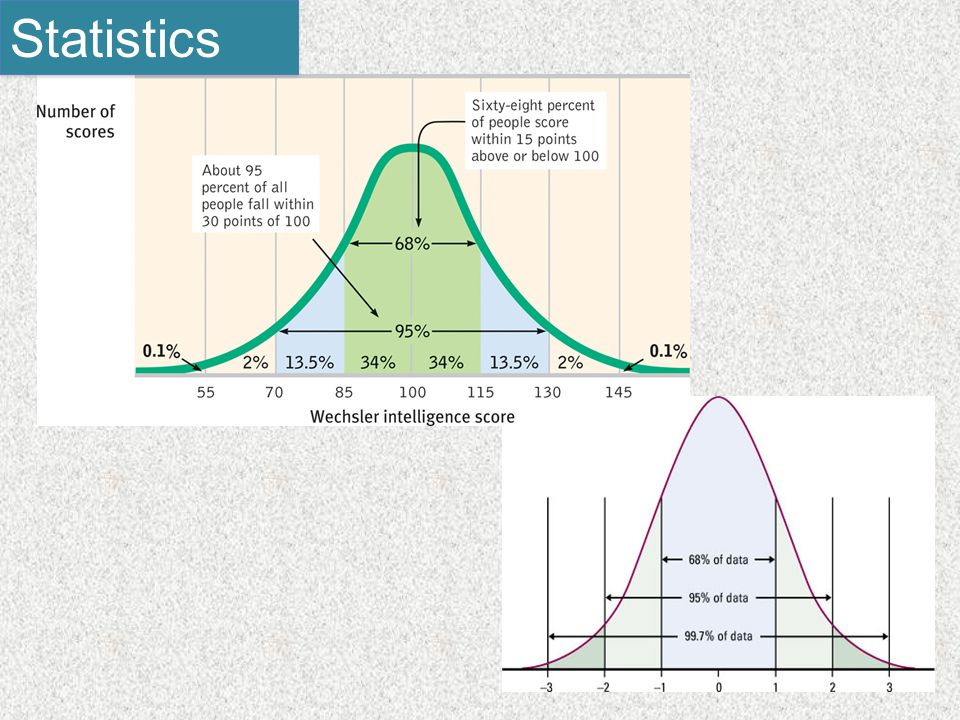
Measures of Variability: The Normal Curve #5 (Testing). Interpret the meaning of scores in terms of the normal curve.

62
Statistics

65
Normal Distribution & Standard Deviation Applet

66
Inferential Stats Statistics

67
Central Limit Theorem: Larger Sample Size = More Normal Applet

68
Statistics Statistical Significance

69
Statistics

70
Ethics in Research #9. Identify how ethical issues inform and constrain research practices. #10. Describe how ethical and legal guidelines (e.g., those provided by the American Psychological Association, federal regulations, local institutional review boards) protect research participants and promote sound ethical practice.
 protect research participants and promote sound ethical practice..")
71
Ethics APA Code of Ethics

72
Ethics Institutional Review Board (IRB)
")
73
Informed Consent Ethics

74
Protection from Harm

75
Confidentiality Ethics

76
Within Psychological Treatment: HIPPA Ethics

77
Debriefing Right to Withdrawal Ethics

78
Animal Rights Ethics

79
Thank you for your attention and interest! Please contact me for further discussion: mkennedy@holynames-sea.org

Similar presentations

>")
 Chapter 1 Thinking Critically with Psychological Science James A. McCubbin, PhD Clemson University Worth Publishers.>")


.>")

