Download presentation
Presentation is loading. Please wait.

1
Immigrant economic contribution represents nearly a quarter of the New York State economy New York State GDP in 2006: $1.02 trillion Source: FPI calculation based on Bureau of Economic Analysis estimate of Gross Domestic Product by State and ACS PUMS. See Working for a Better Life, Appendix B, for details. Foreign-born $229 billion 22.4% U.S.-born $791 billion 77.6%

2
New York City Downstate Suburbs Hudson Valley Rochester Ithaca New York State Immigration and growth go hand in hand Source: FPI analysis of 2000 Census microdata.Map created by the Regional Plan Association.

3
Immigrant share of population is in line with immigrant share of economic output Source: Fiscal Policy Institute: Working for a Better Life.

4
Immigrant contributions make up almost half of the New York City economy Sources: FPI analysis of ACS PUMS, and New York City Department of City Planning.Working age is 16-64 years old.

5
Immigrants work in jobs across the spectrum of the NYC economy Managerial & professional Tech, sales, & admin. support Service jobs Blue-collar jobs Source: Fiscal Policy Institute analysis of 2005-07 American Community Survey.

6
Dominican-born immigrants in New York City Managerial & professional Tech, sales, & admin. support Service jobs Blue-collar jobs Source: Fiscal Policy Institute analysis of 2005-07 American Community Survey.

7
Mexican-born immigrants in New York City Managerial & professional Tech, sales, & admin. support Service jobs Blue-collar jobs Source: Fiscal Policy Institute analysis of 2005-07 American Community Survey.

8
Korean-born immigrants in New York City Managerial & professional Tech, sales, & admin. support Service jobs Blue-collar jobs Source: Fiscal Policy Institute analysis of 2005-07 American Community Survey.

9
Russian-born immigrants in New York City Managerial & professional Tech, sales, & admin. support Service jobs Blue-collar jobs Source: Fiscal Policy Institute analysis of 2005-07 American Community Survey.

10
Trinidad & Tobago-born immigrants in New York City Managerial & professional Tech, sales, & admin. support Service jobs Blue-collar jobs Source: Fiscal Policy Institute analysis of 2005-07 American Community Survey.

11
white-collar Different groups of immigrants are concentrated in different occupations blue-collar, service, and all other combined Source: Fiscal Policy Institute analysis of 2005-07 American Community Survey.

12
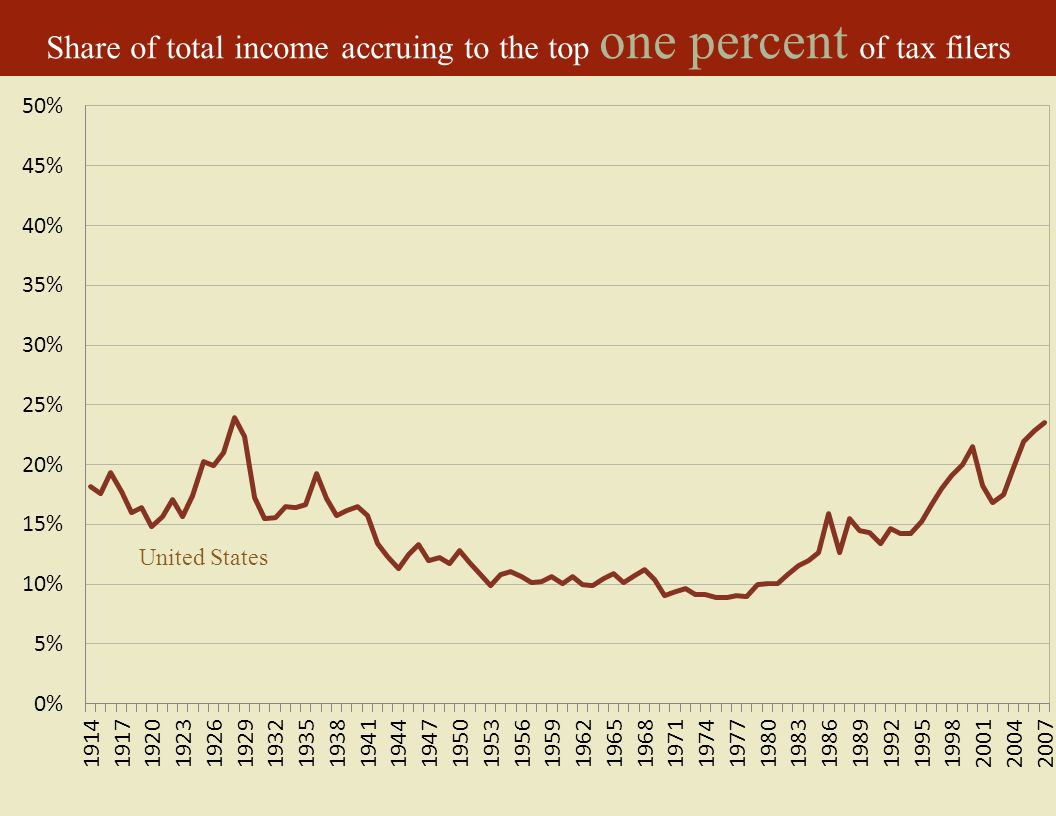
Share of total income accruing to the top one percent of tax filers

17
New York City

18
Immigrants have slightly lower poverty rates, but poverty levels are appallingly high for all, with great discrepancy between race/ethnic groups Source: FPI analysis of 2005-07 ACS. …even before the recent economic downturn. And rates are even higher in upstate cities.

19
300,000 more low-wage jobs in 2007 than in 1990, with immigrants more likely to be in low-wage jobs, and again big race/ethnic disparities Share of full-time workers in low-wage jobs Low wage = 2/3 of median ($27,000) 2005-07 28 percent of all full-time workers are in low-wage jobs
 percent of all full-time workers are in low-wage jobs")
20
In NY, Chicago, and Los Angeles, among low-wage workers: * 31 percent of workers subjected to legal violations * 26 percent of legal immigrants * 38 percent of undocumented immigrants * 30 percent of blacks (most of them U.S.-born) * 10 percent of whites (mostly U.S.-born) There are also widespread labor law violations that are more prevalent among immigrants but also very common for minorities (including U.S.- born) and not trivial for whites Broken Laws, Unprotected Workers, Annette Bernhardt et al.
 * 10 percent of whites (mostly U.S.-born) There are also widespread labor law violations that are more prevalent among immigrants but also very common for minorities (including U.S.- born) and not trivial for whites Broken Laws, Unprotected Workers, Annette Bernhardt et al.")
Similar presentations


 981-4076>")


 June 2009.>")


 Source: U.S. Census Bureau,>")
