Download presentation
Presentation is loading. Please wait.

1
Report on the Status of Women and Girls in Glendale 2015-16 Glendale Commission on the Status of Women

2
Areas of Focus Demographics Education Employment and Earnings Veterans Poverty Health Safety Leadership

3
Demographics

4
Racial/Ethnic Distribution of Women African American Asian Latina White Other

5
Median Age of Women (in years) 43.5 36.9
")
6
Higher % of Glendale Women in Older Age Groups 75 years up

7
Education

8
Ethnic/Racial Distribution of K-12 Public School Girls GUSDLAUSD White 54% Latina 74%

9
High School Graduation Rates Girls Boys

10
Educational Attainment of Women (25 years and older) Graduate/Prof Degree Glendale Los Angeles County
 Graduate/Prof Degree Glendale Los Angeles County")
11
Employment & Earnings

12
Median Earnings for Year-Round Full-Time Workers (16 years and over) Women (Blue)Men (Red) $45,300$40,200$42,700
 Women (Blue)Men (Red) $45,300$40,200$42,700")
13
Highest Paying Occupations for Glendale Women who are Working Full-Time (16 years and over) Occupations Median Salary of women % of workforce that is female Computer and Mathematical occupations $105,69225% Arts, entertainment, sports, media occupations $81,08035% Health diagnosing and treating practitioners $77,16672% Management occupations$72,67733% Business and financial operations$62,00464% Legal occupations$55,26739%
 Occupations Median Salary of women % of workforce that is female Computer and Mathematical occupations $105,69225% Arts, entertainment, sports, media occupations $81,08035% Health diagnosing and treating practitioners $77,16672% Management occupations$72,67733% Business and financial operations$62,00464% Legal occupations$55,26739%")
14
Occupations that are Predominantly Held by Glendale Women % of workforce that is female Women’s median salary Personal care and service88%$27,755 Education, training, library87%$52,882 Healthcare diagnosing and treating72%$77,166 Office and administrative support72%$35,978

15
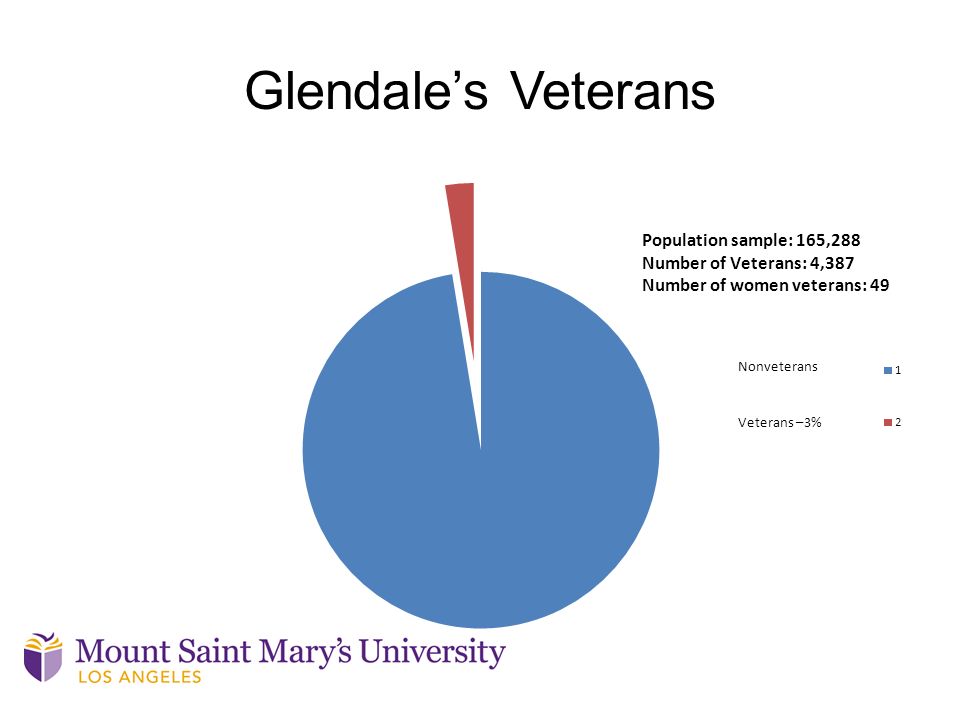
Glendale’s Veterans

17
LA County Veterans Needs Assessment Employment assistance55% Educational assistance55% Health care assistance56% Housing assistance45% Mental health assistance43% Services for vets with disabilities41% Services for women22% Domestic violence assistance10%

18
Poverty

19
Poverty in Glendale

20
Women Poverty Rates in Glendale Poverty of women by Age –17% for all ages 20% for women 75 years and older Poverty for families with children under 18 –Married Couple Households20% –Single Mother Households29%

21
Glendale’s Homeless January 28, 2015 In 2015 there were 208 homeless persons, 59% were unsheltered. Among the 208 homeless persons: –85 were women and girls –51 women and girls are in family groups –52 women and their children were homeless due to domestic violence

22
Health

23
Life Expectancy (years) Women Men
 Women Men")
24
Leading Causes of Death 2000- 2012 Glendale Women Total deaths15,945 Heart Disease 32% Cancers 25% Strokes 8% Alzheimer’s 6% Pneumonia/influenza 4% Glendale Men Total deaths14,408 Heart Disease 32% Cancers 27% Strokes 6% Alzheimer’s 3% Pneumonia/influenza 4%

25
Safety

26
Types of Violent Crimes City of Glendale City of Los Angeles Violent Crime Rate (per 1,000 residents) 15 Number of residents197,0793,906,772 Number of violent crime offenses 18619,171 % Murder/nonnegligent manslaughter 0%1% % Rape5%6% % Robbery36%41% % Aggravated Assault59%51% Source: Uniform Crime Report, FBI
 15 Number of residents197,0793,906,772 Number of violent crime offenses 18619,171 % Murder/nonnegligent manslaughter 0%1% % Rape5%6% % Robbery36%41% % Aggravated Assault59%51% Source: Uniform Crime Report, FBI")
27
Crimes that Disproportionately Impact Women Domestic Violence –Nationally, 85% of victims are women Sexual Violence, Rape –Nationally, women are 10 times more likely to be victims of rape (19% and 2%, respectively) Human Trafficking –Nationally, 55% of labor traffic victims are women –Nationally, 98% of sex traffic victims are women
 Human Trafficking –Nationally, 55% of labor traffic victims are women –Nationally, 98% of sex traffic victims are women")
28
Number of Domestic Violence- Related Calls for Assistance in Glendale

29
Rapes: Glendale Rapes account for about 5% of all Glendale crimes—an average of 12/year (2010-2015) –14 reported in 2006 and 15 in 2015 Peak in 2010 at 17 cases Low point in 2012 at 6 cases
 –14 reported in 2006 and 15 in 2015 Peak in 2010 at 17 cases Low point in 2012 at 6 cases")
30
Human Trafficking in Los Angeles Area 2014 Coalition Against Slavery and Trafficking (CAST– LA) –354 cases served 60% labor trafficking 38% sex trafficking –71% of victims were women –6% under age of 18 years
 –354 cases served 60% labor trafficking 38% sex trafficking –71% of victims were women –6% under age of 18 years")
31
Leadership

32
Women Executives in Glendale’s California Fortune 400 Companies Company Name Female CEO/ President Percent of women among highest paid executives % women Directors Avery Dennison 40%22.2% DineEquity 20%20.0% DreamWorks Animation, Inc. 20%14.3% Public Storage 20%12.5% PS Business Parks 25%22.2% CA 400 Average17 Companies10.5%13.3% Source: UC Davis

33
Political Leadership 2/3 of the elected officials representing Glendale in the County and State policy-making bodies are women. Women comprise 40% of the elected city council seats in Glendale, compared to a 28% statewide average. Nearly one-third (32%) of Glendale’s Boards and Commissions are women. 80% of the Board of Education are women, in addition to the student Board Member. Across California, public school boards are the closest elected body to reach gender parity, with 47% of all school board members in California being female.
 of Glendale’s Boards and Commissions are women. 80% of the Board of Education are women, in addition to the student Board Member. Across California, public school boards are the closest elected body to reach gender parity, with 47% of all school board members in California being female..")
Similar presentations