Download presentation
Presentation is loading. Please wait.

1
GOVERNMENT ENGINEERING COLLEGE, VALSAD
SUBJECT :- HYDROLOGY & WATER RESOURCES ENGINEERING ( ) TOPIC :- MODULE 1 (INTRODUCTION) GROUP NO :- 3 SUBMITTED TO :- PROF. KULDEEP PATEL
 TOPIC :- MODULE 1 (INTRODUCTION) GROUP NO :- 3. SUBMITTED TO :- PROF. KULDEEP PATEL.")
2
Name of group members No. Name Enrolment No. 1 Patel Nimesh R.
2 Patel Shubham R. 3 Patel Tejas R. 4 Patel Yash V.

3
INTRODUCTION:- Introduction Hydrologic cycle
Processes of Hydrologic cycle World’s Water Resources India’s Water Resources Water Balance Precipitation Variability of precipitation Measurement of Rainfall Methods of calculating average rainfall over an area

4
INTRODUCTION:- Design of Rain gauge Network
Intensity of rainfall, Mean Annual Rainfall Estimating missing rainfall data Presentation of Rainfall data Analysis of Rainfall data Evaporation Measurement of Evaporation Transpiration Evapotranspiration Infiltration

5
Introduction:- Hydrology is the science which deals with the occurance, circulation and distribution of water upon, over and beneath the earth surface. It deals with the transportation, precipitation, evaporation, transpiration, and infiltration.

6
In a general sense, hydrology is very broad subject of an interdisciplinary nature drawing support from allied sciences such as Metrology Geology Statistics Physics Chemistry Fluid mechanics, etc.

7
Engineering hydrology
Scientific hydrology Engineering hydrology A study which is concerned with academic aspects A study concerned with engineering applications It deals with Study of process in hydrological cycle Study of problems such as floods, droughts, strategies to combat them

8
Application of Hydrology
The maximum probable flood that may occur at given site and its frequency. The water yield from basin-its occurance, quantity and frequency, etc. Ground water development. The maximum intensity of storm and its frequency. Various methods of flood forecasting and flood control.

9
Selection of suitable site for a dam, reservoir and hydroelectric power generation.
The capacity of storage structures such as reservoirs. The interaction of flood wave and hydraulic structures like levees, reservoirs, barrages and bridges.

10
Hydrological Cycle:- The hydrological cycle is a descriptive term applied to the circulation of water from the oceans to the atmosphere, to the ground and back to the oceans again. Thus, hydrological cycle is the earth’s water circulation system.

12
Process of Hydrological Cycle:-
The hydrological cycle consist of the following process:- Evaporation and Transpiration Precipitation Runoff

17
Evaporation and Transpiration
Due to heat of sun the water from the surface of ocean, rivers, lakes and from the moist ground surface evaporates. The vapour are carried over the land by air in the form of clouds. This process is called evaporation.

18
Transpiration is the process of water being lost from the leaves of the plants from their pores.
Evaporation (E)= surface evaporation + water surface evaporation + rivers, ponds surface evaporation + ocean surface evaporation + transpiration + atmospheric evaporation
= surface evaporation. + water surface evaporation. + rivers, ponds surface evaporation. + ocean surface evaporation. + transpiration. + atmospheric evaporation.")
19
Precipitation (P) Liquid precipitation Precipitation
Precipitation may be defined as the fall of moisture from the atmosphere to the earth’s surface in any form. Precipitation Liquid precipitation Frozen precipitation rainfall Snow Hail Sleet Freezing rain

20
Runoff (R) Runoff is that part of precipitation that is not evaporated. There are three types of runoff. Surface runoff Sub-surface runoff or interflow Ground water flow or base flow.

21
Surface runoff A large portion of the precipitation, left after infiltration , flows over the ground into the streams and rivers, which ultimately discharge the water to the sea, known as surface runoff.

22
SUB-SURFACE RUNOFF OR INTERFLOW
A Portion of the precipitation infiltrates in to soil runs as sub surface runoff and reaches the streams and rivers. This water is known as Sub Surface run off or Interflow.

23
GROUND WATER FLOW OR BASE FLOW

25
World’s water Resources

26
Per capita availability and utilization of water around various countries of the world:
World’s total land area =1,45,000 B.m³ World’s total annual precipitation that falls on total land area =1,09,000 B.m³ Average annual precipitation depth =0.752 m Total land evaporation = 62,000 B.m³ Average annual runoff = 47,000 B.m³ Average depth of runoff = m

27
Per Capita average annual Flow(m3)
Country Per Capita average annual Flow(m3) Canada 1,00,00 Egypt 1,000 India 1,700 USSR 19,500 USA 9,900 China 2,400 World 7,200
 Canada. 1,00,00. Egypt. 1,000. India. 1,700. USSR. 19,500. USA. 9,900. China. 2,400. World. 7,200.")
28
Water balances Catchment area:
The area of draining in to a stream or a water course at a given location is known as catchment area. It is also called drainage area or drainage basin. In USA, it is known as watershed.

29
Water budget equation:
The hydrologic equation is simply the statement of the law of conservation of matter and is given by I = O + ΔS ……………….( 1) where, I = inflow O = outflow ΔS = change in storage, in given time interval.
 where, I = inflow. O = outflow. ΔS = change in storage, in given. time interval.")
30
The expression for the water budget of a catchment for a time interval Δt is written as,
P – R – G – E – T = ΔS ….…..(2) Where, P = precipitation R = surface runoff G = net ground water flow out of catchment E = evaporation T = transpiration ΔS = change in storage
 Where, P = precipitation. R = surface runoff. G = net ground water flow out of catchment. E = evaporation. T = transpiration. ΔS = change in storage.")
31
Precipitation Precipitation may be define as the fall of moisture from the atmosphere to the earth’s surface The water which comes back to the surface of earth in its various forms like rain, hail, snow, sleet, etc. is known as precipitation.

32
Frozen precipitation Precipitation i.e. Snow Hail Sleet Freezing rain
Liquid precipitation i.e. Rainfall

33
For precipitation to form, it therefore necessary to have the following favorable conditions in the environment: The atmosphere must have moisture There must be sufficient nucleii present to aid condensation over them. Weather condition must be favourable to condensation to water vapour.

34
Forms of precipitation
Rain Snow Hail Drizzle Glaze Sleet Rime dew Forms of precipitation

35
Types of pricipitation
Precipitation is often classified according to factors responsible for lifting. Broadly speaking, there are four types of precipitation. Cyclonic precipitation Convective precipitation Orographic precipitation Precipitation due to turbulent ascent

36
1. Cyclonic precipitation
Cyclonic precipitation is caused by the lifting of an air mass due to the pressure difference. If low pressure occurs in an area, air will flow horizontally from the surrounding area, causing the air in the low pressure area to lift. The cyclonic pressure may be divide into (a) Frontal precipitation (b) Non-frontal precipitation
 Frontal precipitation. (b) Non-frontal precipitation.")
37
FRONTAL PRECIPITATION :-
when two air masses due to contrasting temperatures and densities clash with each other , condensation and precipitation occur at the surface of contact. This surface of contact is called ‘ frontal ’ or ‘frontal surface’ and the precipitation is called frontal precipitation. Different types of front is, Cold front Warm front Stationary front

38
Non-frontal precipitation:-
In case of non- frontal precipitation, the moist warm air mass is stationary and the moving cold air mass meets it. Thus, due to lightness of the warm air mass there is passive ascent of warm air over cold air owing to the active under cutting. When the lifted warm air cools down at higher altitude precipitation occurs.

39
2. Convective precipitation
Convective precipitation is caused by natural rising of warmer lighter air in colder, denser surroundings. Generally, this kind of precipitation occurs in tropics, where on a hot day, the ground surface gets heated unequally, causing the warmer air to lift up as the colder air comes to take place.

41
3. Orographic precipitation
Orographic precipitation is caused by moist air masse, which strike some natural topographic barriers like mountains, rise up causing condensation and precipitation. The greatest amount of precipitation falls on the windward side, and the leeward side often has very little precipitation.

43
4. Precipitation due to turbulent ascent:
Air mass is forced to rise up due to greater friction of earth surface after its travel over ocean. The air mass rises up because of increased turbulence and friction, when it ultimately condenses and precipitation occurs.

44
Artificial rainfall (cloud seeding):
Sometimes the process of evaporation is smoothly carried and the air has sufficient amount of moisture, but it does not reach the point of saturation because there is a deficiency of hygroscopic nuclei, which are necessary to form the raindrops.

45
So artificial hydroscopic nuclei are provided in following forms:
Dry ice (solid CO2) Silver dioxide Frozon carbon dioxide Sodium chloride etc. The process of artificial simulation of precipitation by adding certain chemicals to cloud in atmosphere is known as cloud seeding.
 Silver dioxide. Frozon carbon dioxide. Sodium chloride etc. The process of artificial simulation of precipitation by adding certain chemicals to cloud in atmosphere is known as cloud seeding.")
46
Variablity of precipitation
The distribution of precipitation is not uniform in a particular region. The precipitation regime for any region depends upon the following factors: Location of region in the general circulation pattern. The latitude. Distance from moisture source Orography of a region

47
Location of the region in the general circulation pattern:
The thermal circulation originates from the sun as a source of origin. About 40% of radiant energy of sun is reflected back from upper surface of clouds. The earth absorbs the remaining 60% with small losses. This in turn increases the the heat of the surface.

48
Measurement of Rainfall
The knowledge of amount of rainfall, intensity of rainfall and the distribution of rainfall is extremely useful for the irrigation engineering. Rainfall at a place can be measured by a rain gauge, usually in cm.

49
The following are the main types of rain gauges used for measurement of rainfall.
Non recording type Symon’s rain gauge IMD Recording type Weighing bucket type Tipping bucket type Float type rain gauge

50
Symon’s rain gauge: The symon’s rain gauge consist of
It can measure up to 12.5 cm of rainfall. Metal case internal dia. 127 mm Base dia. 210 mm Metal casing size 600*600*600 mm Funnel with circular rim Height of metal casing 305 mm above G.L. Receiving bottle 75 to 100 mm dia.

51
The following points should be kept in mind while selecting the site for a rain-gauge station:
The rain gauge should be an open place The distance between the rain gauge and the nearest object should be at least twice the height of the object. The rain gauge should be at least 30m away from the near by obstruction. The rain gauge should never be situated on the side or top of a hill.

53
I.M.D. standard rain gauge:
The symon’s rain gauge was used by Indian Metrology Department upto 1969 when the IMD standard rain gauge was adopted. The IMD consist collector which surface area is either 100 cm² or 200 cm² . The collector is fitted over the base which is fixed to a concrete masonry.

54
IMD standard rain gauge

55
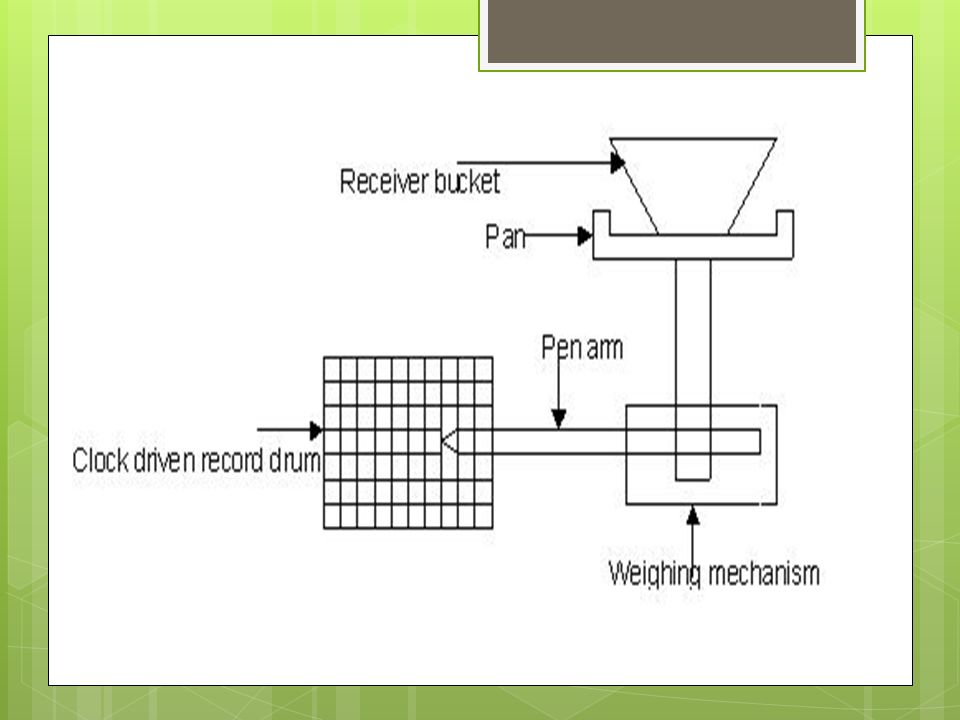
Weighing bucket type rain gauge:
This is self recording type or automatic type rain gauge. In weighing bucket type rain gauge, the rain water is collected by a receiver bucket. The rainfall record produced by this gauge is in the form of a mass curve of rainfall. The mass curve gives the intensity of rainfall.

57
Tipping bucket type rain gauge:
The tipping bucket type rain gauge consist of two small bucket placed below the funnel fitted in a 30 cm diameter receiver. The buckets are so designed that when 0.25 mm of rainfall collects in one bucket, it tips and empties its water into the measuring tube below it.

59
Float type rain gauge: The working of float type rain gauge is similar to the weighing bucket type rain gauge. A funnel receives the rain water which is collected in rectangular, float chamber. A float is provided at the bottom of the float chamber.

60
Float type or syphon type rain gauge

61
Methods of calculating average rain fall over an area:
The rain fall is recorded by a rain gauge represent the rain fall at that station. In many hydrological studies, the average depth of rainfall over a specified area due to a storm is required.

62
Number of rain gauge station is required
The number of rain gauge stations required in particular climate area depends upon the size of the catchment as given in table. Area of catchment sq. km Number of rain gauge station is required 0 to 80 1 80 to 160 2 160 to 320 3 320 to 560 4 560 to 800 5 800 to 1200 6

63
The average rainfall over an area can be computed by the following methods:
Arithmetic average method Thiessen polygon method Isohyetal method

64
Arithmetic average method:
In this method the average depth of rain fall over an area is obtained by dividing the sum of depths of rainfall recorded at the gauge stations located in the area by the number of stations.

65
Thus, if P1, P2, P3, …… Pn are the depths of rain fall recorded at various rain gauge stations.
n = number of rain gauge stations

66
Thiessen polygon method:
This method is better then the arithmetic mean method which gives equal weightage of to all the stations.

67
Procedure: Join the adjacent rain gauge stations A, B, C, D etc. by straight lines, forming triangles. Construct the perpendicular bisectors of each of these sides of triangles. A thiessen network is thus created.

68
Let P1, P2, P3, ……Pn are the details of rainfall
A1, A2, A3, ……An area represented by various rain gauge stations.

69
Isohyetal method: Isohyetal are the contours of equal rainfall.
An isohyetal map showing contours of equal rainfall represent a more accurate picture of the rainfall distribution over the basin.

71
Estimating missing rainfall data:-
The prediction of the missing data can be made with the help of available data of nearby measuring stations, using the following methods : Arithmetic mean method Normal ratio method Inverse distance method station-year method.

72
Arithmetic mean method

73
Inverse distance method
In this method a set of rectangular co- ordinates axes are passed through the missing station so that its co – ordinates are (0,0). The co-ordinates (x,y) of each index surrounding the missing station are found.
. The co-ordinates (x,y) of each index surrounding the missing station are found.")
74
STATION YEAR METHOD In this method , the records of two or more rain gauge stations record are independent and areas of stations are climatologically the same. The missing record at a certain station in a particular year may be found out by the ratio of the average or by graphical comparison. o

75
Evaporation : Due to heat of sun the water from the surface of ocean, rivers, lakes, and from the moist ground surfaces evaporates. The vapour are carried over the land by air in the forms of clouds. This process is called evaporation.

76
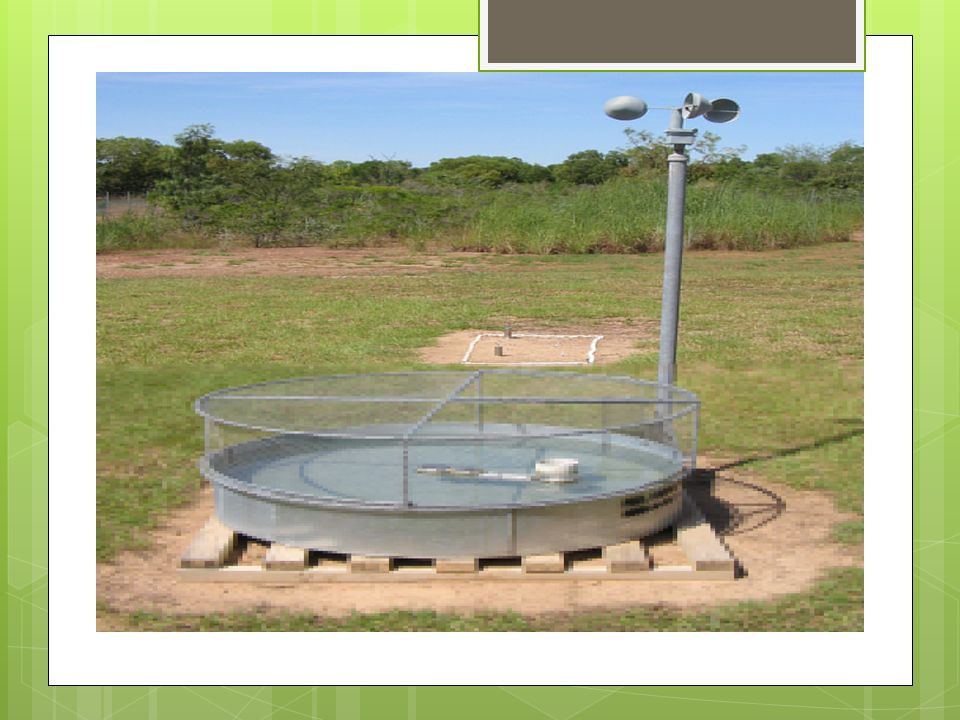
U.S. weather bureau class a pan
This is perhaps the most commonly used evaporation pan. The pan consists of a shallow vessel 1.2 m dia. And 25 cm deep the pan is made of unpainted galvanized iron sheet. Where there is corrosion problem, it is made of Monel sheet. Evaporation is computed as the difference between observed water levels on two consecutive days. Pan coefficient is about 0.6 to 0.8 , generally taken as 0.7 .

78
COLORADO SUNKEN PAN It is 90 cm square with a depth ranging from 30 to 90 cm and buried in the ground within about 10 cm of the top. the water should be within 2.5 cm of ground level. Pan coefficient is 0.75 to 0.86 generally taken as

79
U.S. GEOLOGICAL SURVEY FLOATING PAN
This is 90 cm square in plan and 45 cm deep pan by drum floats in the center of a raft 14’ *16’ . The pan coefficient is generally taken as U.S. GEOLOGICAL SURVEY FLOATING PAN

80
TRANSPIRATION

81
FACTORS AFFECTING TRANSPIRATION
All the factors that affect the evaporation from the free water surface also affect transpiration, that is follows: temperature of air wind velocity atmosphere pressure humidity solar radiation soil moisture physiologic factors

82
Dalton’s law of evaporation:
According to Dalton’s law “ The rate of evaporation depends upon the difference between the saturation vapour pressure and the vapour pressure in the air above.” where E = evaporation loss (mm/day) C = coefficient
 C = coefficient.")
83
Factors Affecting Evaporation :
Temperature of air Wind velocity Atmospheric pressure Area of water surface Depth of water body Humidity Impurities in water Nature of evaporating surface

84
Measurement of evaporation :
The rate of evaporation from large water surfaces can be determined by following methods : 1. Pan Measurement method 2. Using Empirical formula 3. Water budget method 4. Energy budget method

85
Pan measurement method :
The most reliable method for the estimating of evaporation from large water bodies is that by measurements from evaporation pans. Different shapes of pans have been designed by different designers, and different values of pan coefficient have been suggested.

86
The more important of these pans are described below.
U.S. Weather Bureau class A pan Colorado sunken pan U.S. Geological Survey Floating pan I.S. Standard pan

87
Using Empirical formula
Evaporation from lakes and reservoirs is usually estimated by empirical methods based on metrological data. There are a number of empirical formulae available in the literature. Most of these equations are based on Dalton’s law of evaporation.

88
1. mayer formula It states that Where, E = evaporation (mm/day)
es = saturation vapour pressure ea = actual vapour pressure V9 = mean wind velocity at 9 m above G.L. km = coefficient

89
2. Rohwer’s Formula : It states that

90
Lake Hefner formula : It states that

91
WATER BUDGET METHOD

92
Evapotranspiration : Evapotranspiration is the sum of the water lost to the atmosphere by the plants through transpiration, and the water evaporated from the soil or water body surrounding the plant. Evapotranspiration = Evaporation +Transpiration

93
If sufficient moisture is always available to completely meet the needs of the plants, the resulting evapotranspiration is called Potential evapotranspiration (PET). The real evapotranspiration occuring in a specific situation is called Actual evapotranspiration.

94
Factors affecting evapotranspiration
Metrological factors Density of vegetation Soil moisture Stage of plant growth Adjoining joint Surface of leaves

95
Measurement of evapotranspiration (consumptive use) :
Measurement of consumptive use of water direct measurement method Use of empirical formula Tank and lysimeter method Field experimental plots Inflow and out flow studies Penman method Jensen-Haise method Hargreaves method Blaney-criddle method

96
Penman’s method : For shorter periods, it is necessary to use calculation methods to estimate evapotranspiration. This can done by penmen’s method. The penman’s equation is a equation is a combination of energy balance and wind transfer approach, which reads:

97
Where, PET = daily potential evapotranspiration A = slope of the saturation pressure versus temperature curve at mean air temperature Hn = net incoming solar radiation (mm/day) Ea = Parameter including wind velocity and saturation deficit. = Psychometric constant
 Ea = Parameter including wind velocity and. saturation deficit. = Psychometric constant.")
99
Infiltration : Infiltration may be defined as the downward movement of water from soil surface, into the soil mass through the pores of the soil. The process of downward movement of water into soil, once water enters into the soil, is known as percolation.

100
The maximum rate at which a soil in any given condition is capable of absorbing water is called its infiltration capacity. The infiltration rate at any instant is the rate at which water actually enters the soil during a storm and is equal to the infiltration capacity or rainfall rate, whichever is less.

101
Factors affecting infiltration:
Thickness of saturated layer Permeability characteristics of soil formation Soil moisture Temperature Intensity and duration of rainfall Vegetation cover

102
Compaction due to men and animals Washing of fines Quality of water
Human activities Quality of water Size and characteristics Pressure of ground water table

103
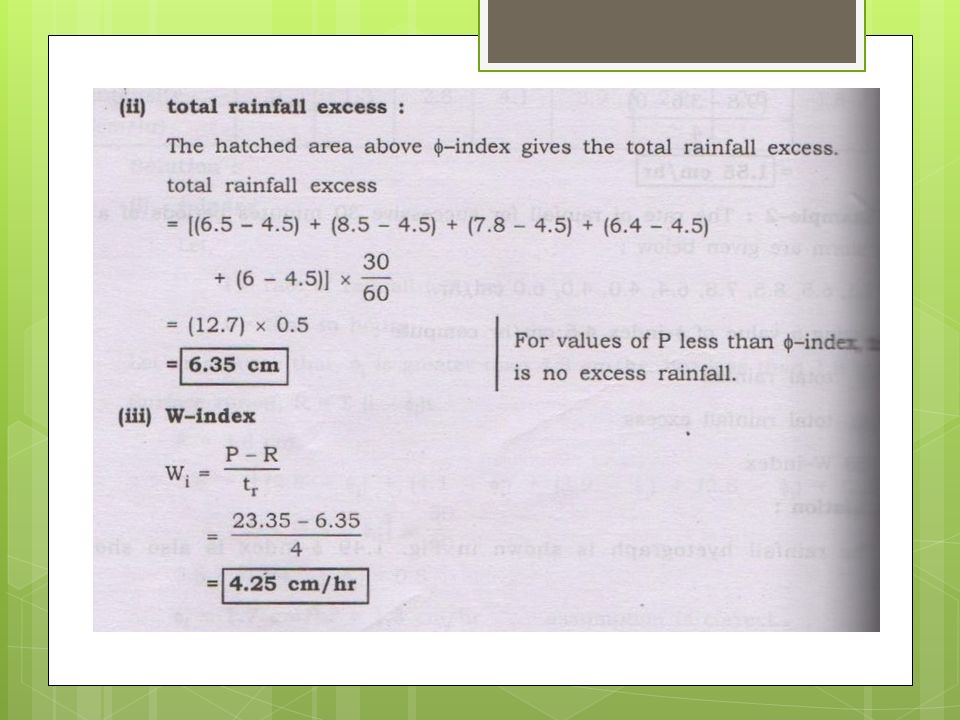
Horton’s equation : The maximum rate at which the soil in any given condition is capable of absorbing water is called its infiltration capacity. Infiltration often begins at a high rate (20 to 25 cm/hr) and decreases to a fairly steady state rate as the rain continues, called ultimate fp.
 and decreases to a fairly steady state rate as the rain continues, called ultimate fp.")
107
Green – Ampt method :

113
Thank you

Similar presentations


 Vadlani Ronak Patel Shivanshu Patel Parth Thaker Rajvi Leuva Nisarg Patel Rudra ALPHA COLLEGE.>")


 A cloud is a large collection of tiny water droplets. (100 times smaller than the average rain drop.>")

