Download presentation
Presentation is loading. Please wait.

1
Hydrology Chia-Ming Fan Department of Harbor and River Engineering
National Taiwan Ocean University 2010/03/11

2
Contents Ch 1 Introduction Ch 2 Precipitation
Ch 3 Abstractions from Precipitation Ch 4 Streamflow Measurement Ch 5 Runoff Ch 6 Hydrographs Ch 7 Floods Ch 8 Flood Routing Ch 9 Groundwater Ch 10 Erosion and Reservoir Sedimentation

3
Chapter 2 Precipitation
2.1 Introduction 2.2 Forms of precipitation 2.3 Weather systems for precipitation 2.4 characteristics of precipitation in India 2.5 Measurement of precipitation 2.6 Raingauge network 2.7 Preparation of data 2.8 Presentation of rainfall data 2.9 Mean precipitation over an area 2.10 Depth-area-duration relationships 2.11 Frequency of point rainfall 2.12 Maximum intensity-duration-frequency relationship 2.13 Probable maximum precipitation (PMP) 2.14 Rainfall data in India
 2.14 Rainfall data in India.")
4
2.1 Introduction The term precipitation denotes all forms of water that reach the earth from the atmosphere. (rainfall, snowfall, hail, frost, dew,…) Variation floods and droughts For precipitation to form 1. the atmosphere must have moisture 2. there must be sufficient nuclei present to aid condensation 3. weather conditions must be good for condensation of water vapour 4. the products of condensation must reach the earth

5
2.2 Forms of precipitation
Rain Snow Drizzle Glaze Sleet Hail

6
2.3 Weather systems for precipitation
Front: a front is the interface between two distinct air masses. Cyclone(氣旋): a cyclone is a large low pressure region with circular wind motion 1. Tropical cyclone (hurricane, typhoon) 2. Extratropical cyclone Anticyclone(反氣旋): high pressure Convective precipitation(對流雨): usually, the areal extent of such rains is small, being limited to a diameter of about 10 km. Orographic precipitation(地形雨):
: a cyclone is a large low pressure region with circular wind motion. 1. Tropical cyclone (hurricane, typhoon) 2. Extratropical cyclone. Anticyclone(反氣旋): high pressure. Convective precipitation(對流雨): usually, the areal extent of such rains is small, being limited to a diameter of about 10 km. Orographic precipitation(地形雨):")
7
2.3 Weather systems for precipitation

8
2.5 Measurement of precipitation
Raingauge: 1. nonrecording 2. recording For sitting a raingauge the following considerations are important: 1. The ground must be level and in the open and the instrument must present a horizontal catch surface 2. The gauge must be set as near the ground to reduce wind effects but it must be sufficiently high to prevent splashing, flooding, etc. 3. The instrument must be surrounded by an open fenced area of at least 5.5m * 5.5m

10
2.6 Raingauge network An optimum density of gauges (Storm--Catchments)
Optimum number of stations: Coefficient of variation of the rainfall values at the existing m stations Allowable degree of error in the estimate of the mean rainfall Optimum number of stations

11
2.6 Raingauge network If there are m stations in the catchment each recording rainfall values P1,P2,…Pm in a known time, the coefficient of variation Cv is calculated as: Coefficient of variation Standard deviation Mean precipitation

12
Ex 2.1

13
2.7 Preparation of data The normal rainfall is the average value of rainfall at a particular date, month ot year over a specified 30-year period. Estimation of missing data within 10% Pj: annual precipitations Nj: normal annual precipitations Normal ratio method

14
Ex 2.2

15
2.7 Preparation of data (Test for consistency of record)
")
16
Ex 2.3

19
2.8 Presentation of rainfall data
Mass Curve of Rainfall (降雨累積曲線)
")
20
2.8 Presentation of rainfall data
Hyetograph (降雨組體圖)
")
21
2.8 Presentation of rainfall data
Point rainfall (station rainfall) Moving average Ex 2.4
 Moving average. Ex 2.4.")
23
TABLE 2.2

25
2.9 Mean precipitation over an area
Arithmetical-mean method 算數平均法 Thiessen-polygon method 徐昇多邊形法 Isohyetal method 等雨量線法 Arithmetical-mean method In practice, this method is used very rarely.

26
2.9 Mean precipitation over an area
Thiessen-polygon method

27
2.9 Mean precipitation over an area
Thiessen-polygon method

28
2.9 Mean precipitation over an area
Isohyetal method

29
2.9 Mean precipitation over an area
Isohyetal method

30
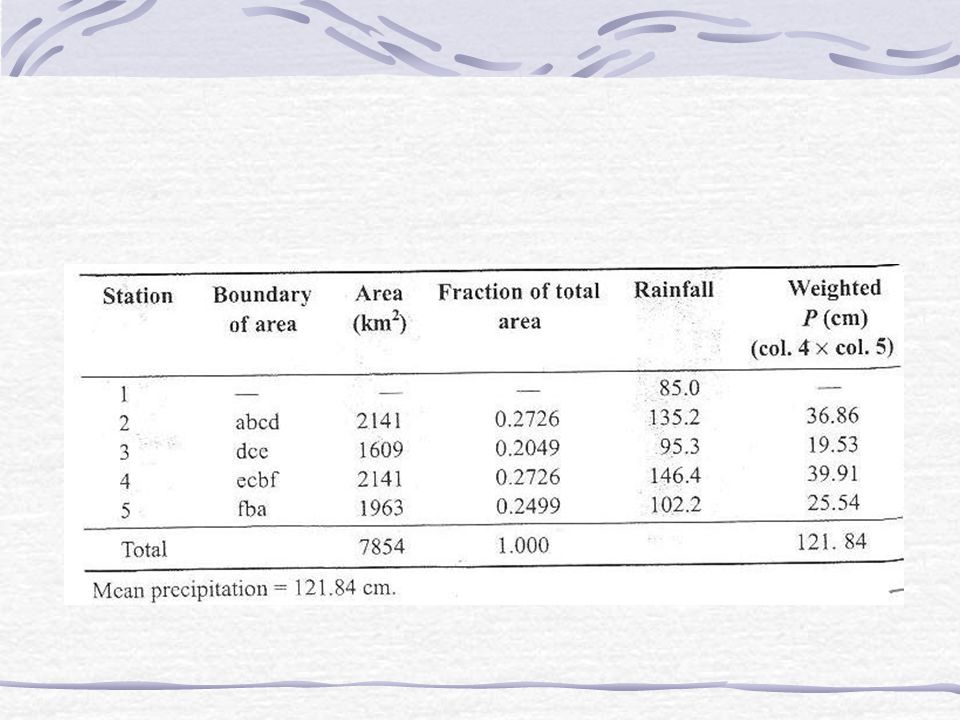
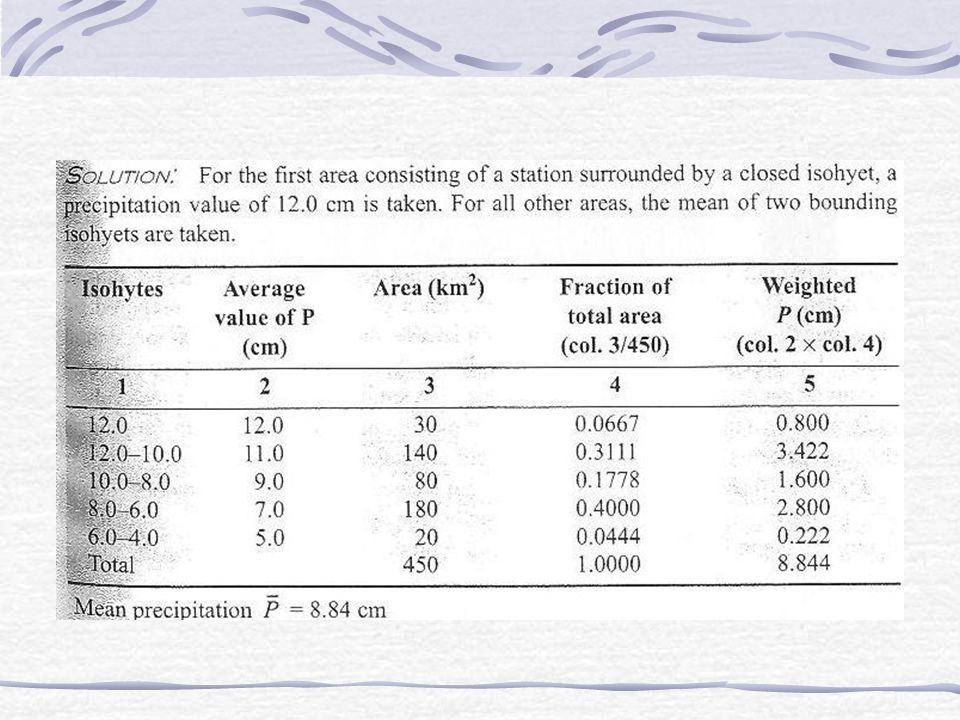
Ex 2.5

33
Ex 2.6

35
2.10 Depth-area-duration relationships
Depth-area relation Highest amount of rainfall in cm at the storm center K and n are constants in a given region Average depth in cm over an area A km2

36
2.10 Depth-area-duration relationships
Maximum Depth-Area-Duration (DAD) Curves
 Curves.")
37
2.11 Frequency of point rainfall
The probability of occurrence of an event of a random variable (rainfall) whose magnitude is equal to or in excess of a specified magnitude X is denoted by P. The recurrence interval (also known as return period) is defined as T=1/P This represents the average interval between the occurrence of a rainfall of magnitude equal to or greater than X.
 whose magnitude is equal to or in excess of a specified magnitude X is denoted by P. The recurrence interval (also known as return period) is defined as. T=1/P. This represents the average interval between the occurrence of a rainfall of magnitude equal to or greater than X.")
38
2.11 Frequency of point rainfall
If the probability of an event occurring is P, the probability of the event not occurring in a given year is q=(1-P). The binomial distribution can be used to find the probability of occurrence of the event r times in n successive years. Thus
. The binomial distribution can be used to find the probability of occurrence of the event r times in n successive years. Thus.")
39
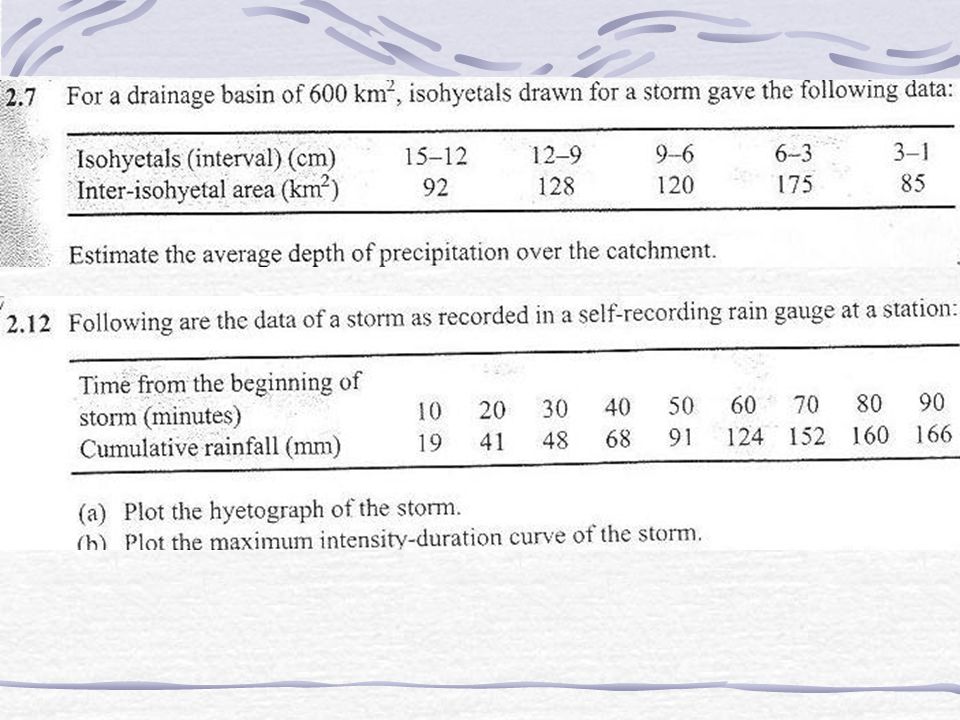
Ex 2.7

40
2.11 Frequency of point rainfall
Plotting Position (empirical formula) The probability analysis may be made either by empirical or by analytical methods.
 The probability analysis may be made either by empirical or by analytical methods.")
42
Ex 2.8

45
2.12 Maximum intensity-duration-frequency relationship

48
Ex 2.9

52
2.13 Probable maximum precipitation (PMP)
The probable maximum precipitation (PMP) is defined as the greatest or extreme rainfall for a given duration that is physically possible over a station or basin. Meteorological methods The statistical study of rainfall data
 is defined as the greatest or extreme rainfall for a given duration that is physically possible over a station or basin. Meteorological methods. The statistical study of rainfall data.")
53
Problems 2.1/2.2/2.6/2.7/2.12/2.14/2.16/2.19

Similar presentations


>")


 Precipitation ERS 482/682 Small Watershed Hydrology.>")


