Download presentation
Presentation is loading. Please wait.

1
Investigating PV Generation Induced Voltage Volatility for Customers Sharing a Distribution Service Transformer Abhineet Parchure Dominion Voltage, Inc.

2
AGENDA Growth in Solar PV installations Need for monitoring customer voltages Significance of Distribution Secondary Connections Modeling secondary connections Accurate assessment of solar PV induced fluctuations on customer voltages

3
Growth in Residential PV

4
Customer Voltage Requirement

5
Distribution Feeder Model

6
Secondary Model (an example)
")
7
Variable Solar PV Generation

8
Significance of Secondary Connections The PV penetration for the feeder is 24% of the load at 12 noon. At this time there are some distribution transformers that experience reverse power flow. At 12 noon the level of PV penetration, as measured on the secondary side of some transformers, reaches 200%. The AMI load measured for the eight customers connected to this distribution transformer at 12 noon is 31 kW Five of these eight customers have PV generation rated at a maximum of 12 kW each.

9
Significance of Secondary Connections Customer Load Bus AMI Load (kW) Max. Rated PV (kW) Transformer Distance (feet) V max (V)V min (V)MVF (V) 41083.4712338124.2116.77.5 41005.2612260123.5116.66.9 41014.070235122.7116.66.1 41074.4812135122.9117.75.2 17134.321294122.4118.83.6 41144.581250121.91192.9 41134.56074121.2118.62.6 18010.30063121.61192.6
 Transformer Distance (feet) V max (V)V min (V)MVF (V)")
10
PV Impact Rules Rule 3: In the case of multiple solar customers sharing a service transformer, depending on the size of PV generation and the distance from service transformer, one of the solar customers will always have the most severe voltage fluctuations induced by volatile PV generation. Rule 1: For a solar customer, the greater the impedance from their service location to the distribution transformer, the larger the voltage fluctuation at their service location. Note 1: The level of PV penetration is not a sufficient measure of how severe the impact of variable PV generation is on customer- level voltages. Rule 2: Larger solar customers (greater PV generation) will have more severe voltage fluctuations than smaller solar customers having the exact same load and distance from the service transformer.
 will have more severe voltage fluctuations than smaller solar customers having the exact same load and distance from the service transformer..")
11
Test Scenarios Scenario #Rated PVPV Customers% of Load (approx.)MVF (Volts) 116 kW1713502.26 216 kW4108504.81 340 kW4100, 4108, 4107, 1713, and 4114 1294.76
MVF (Volts) 116 kW kW kW4100, 4108, 4107, 1713, and")
12
PV Impact Rules Rule 4: For all customers without PV, but sharing the distribution transformer with one or more solar customers, the severity of voltage fluctuations can be determined based on the length of secondary conductors that is shared with solar customers. The greater the length of shared secondary, the larger the voltage fluctuations. Rule 5: Let a non-solar customer ‘A’ share X feet of secondary with solar customer ‘1’, and Y feet of secondary with solar customer ‘2’, and so forth. Now, if there exist more non-solar customers at the same distribution transformer, such that they also share exactly the same lengths of secondaries (X feet, Y feet, and so forth) with solar customers 1, 2 and so forth, then all such non-solar customer voltages undergo the exact same trend and voltage fluctuations for PV-induced voltage effects. Note that these non-solar customers may have their individual service drops such that they are far from each other, and do not have to be neighbors.
 with solar customers 1, 2 and so forth, then all such non-solar customer voltages undergo the exact same trend and voltage fluctuations for PV-induced voltage effects. Note that these non-solar customers may have their individual service drops such that they are far from each other, and do not have to be neighbors..")
13
Test Scenarios Scenario #Rated PVPV Customers% of Load (approx.)MVF (Volts) 1.116 kW1713502.26 1.216 kW4108504.81 1.340 kW4100, 4108, 4107, 1713, and 4114 1294.76 2.116 kW4107502.51
MVF (Volts) kW kW kW4100, 4108, 4107, 1713, and kW")
14
Comparing Scenarios Scenario 1.1Scenario 2.1Scenario 1.2 Load Bus Shared length V max V min ΔV Shared length V max V min ΔV Shared length V max V min ΔV 41080 feet115.9114.71.296 feet117115.11.9338 feet120.5115.74.8 41000 feet116114.81.296 feet117.1115.21.9187 feet118.2115.42.8 41010 feet116.21151.296 feet117.3115.41.9187 feet118.4115.62.8 41070 feet117.6116.41.2135 feet119.4116.92.596 feet118.7116.81.9 171394 feet120.8118.52.30 feet119.3118.11.20 feet119.3118.11.2 41140 feet119.6118.41.20 feet119.6118.41.20 feet119.6118.41.2 41130 feet119.3118.11.20119.3118.11.20119.3118.11.2 18010 feet119.7118.51.20119.7118.51.20119.7118.51.2

15
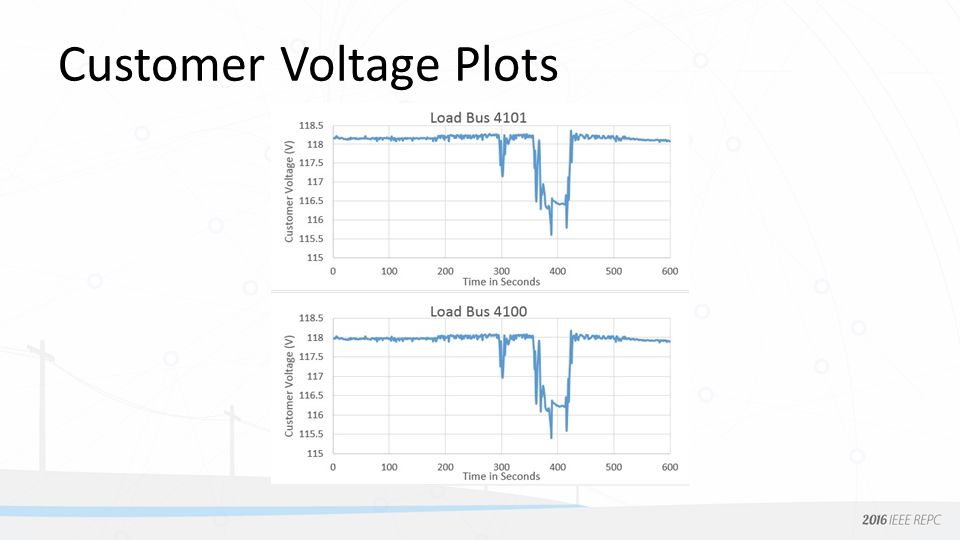
Customer Voltage Plots

17
MVF for each customer Load BusMVF (V) 1205020.5 1205072.0 1205041.6 1205141.8 1205083.3 1205012.2 1205002.2 1205132.2
")
18
Conclusions A detailed distribution system model, including a variety of secondary network models, was considered. In order to simulate realistic scenarios, hourly AMI measurements were used to model load, and one-second solar generation measurement data was used in modeling the time variations of PV inverter generation. The simulation data was carefully chosen to capture a representative variation in PV generation. Quasi-steady-state power flow simulations, running once every second, are used to capture time varying voltage profiles at various customer locations. Based on analyzing the power flow results for various secondary circuit configurations and PV inverters at various locations, rules for the effects of PV generation on secondary circuit voltage variations are presented.

19
Conclusions Scenarios that illustrate the rules are also presented, along with a set of representative time-varying voltage plots for a selected scenario. The rules and notes provide an understanding of how secondary circuit customer voltages are impacted by time-varying PV generation. The rules developed in this paper can be used to select a small subset of customer locations to be monitored in real-time as feedback for voltage control algorithms These rules can also be used as a guide for selecting solar customers that should be controlled by the utility for reactive power support.

20
Future Work The authors have developed a Cloud Motion Simulator and are currently investigating how cloud motion across distributed PV panels affects quasi-steady-state power flow results, where realistic models of secondary services are employed. Work is in progress on building an automated Secondary Circuit Builder and also a control simulator, where the control simulator incorporates the Cloud Motion Simulator. The eventual goal is to use realistic, secondary circuit models together with the cloud motion and control simulators to compare the effectiveness of different voltage control strategies across a wide range of scenarios.

21
Thank You! Questions?

Similar presentations


 Web Tool for the advanced management of LV Network Trends in Power Industry in the European Context VIII Antonello.>")


 LECTURE # 12 BY MOEEN GHIYAS.>")

 Virtual Power Plant Simulator (VPPS) Tom Jones, Manger – Corporate Technology Development American Electric Power Grid-InterOp.>")