Download presentation
Presentation is loading. Please wait.

1
Copyright © The McGraw-Hill Companies, Inc. Permission required for reproduction or display. Chapter 17: Renewable Energy and Energy Conservation

2
© 2013 Pearson Education, Inc. 16.1 Renewable Energy Overview Renewable energy –Primary energy sources that are continuously replenished Falling water Wind Sunlight Earth's heat Ocean tides and waves Biomass

3
© 2013 Pearson Education, Inc.

4
16.1 Renewable Energy Overview Transition to renewable energy –General challenges Renewables diffuse and intermittent Technology to harvest Infrastructure –Currently nonrenewables provide 84% of energy –Benefits Far fewer environmental impacts Infinite energy source

5
© 2013 Pearson Education, Inc.

6
16.1 Renewable Energy Overview Four general categories of challenges –Unfamiliar technologies Many still in development –Economies of scale Scale still small –Externalized costs Subsidies for fossil fuels Pollution –Limited consumer knowledge and understanding

7
FUEL CELLS Fuel cells use ongoing electrochemical reactions to produce electrical current Fuel cells provide direct-current electricity as long as supplied with hydrogen and oxygen. Hydrogen is supplied as pure gas, or a reformer can be used to strip hydrogen from other fuels. Fuel cells run on pure oxygen and hydrogen produce only drinkable water and radiant heat. Reformer releases some pollutants, but far below conventional fuel levels. Fuel cell efficiency is 40-45%. Positive electrode (cathode) and negative electrode (anode) separated by electrolyte which allows charged atoms to pass, but is impermeable to electrons. Electrons pass through external circuit, and generate electrical current.
 and negative electrode (anode) separated by electrolyte which allows charged atoms to pass, but is impermeable to electrons. Electrons pass through external circuit, and generate electrical current..")
8
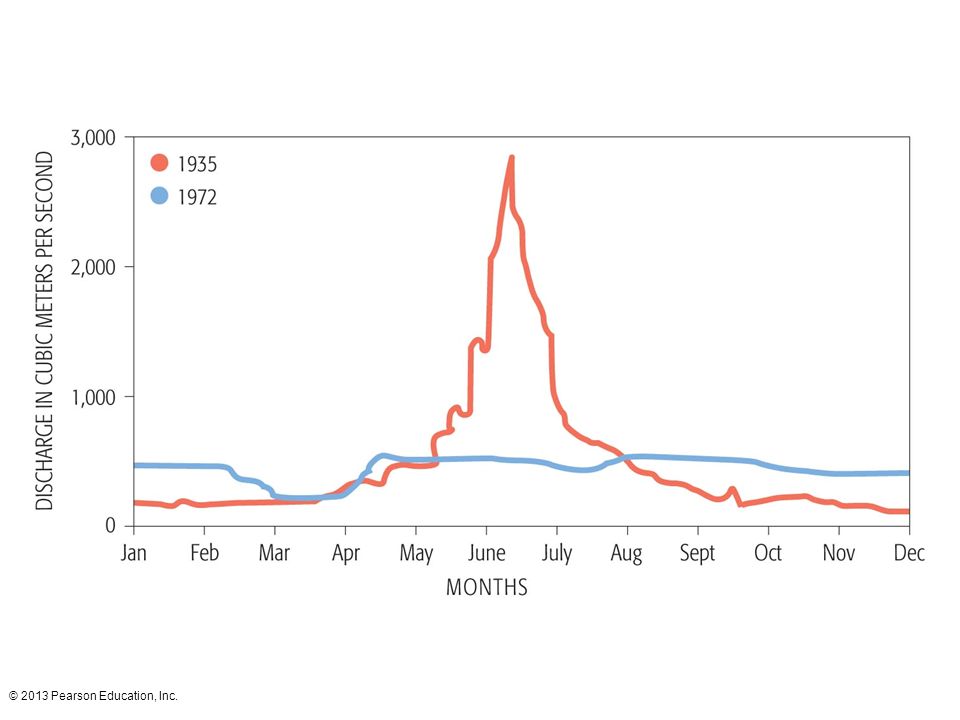
© 2013 Pearson Education, Inc. 16.2 Hydropower Sources and supplies –Constantly supplied by hydrologic cycle Most abundant renewable energy use (58%) Mainly used for electricity generation –Impoundment Dams creating reservoir –Run of river Portion of river diverted through powerhouse
 Mainly used for electricity generation –Impoundment Dams creating reservoir –Run of river Portion of river diverted through powerhouse.")
9
Energy from the Earth’s Forces Hydropower –1925, falling water generated 40% of world’s electric power Hydroelectric production capacity has grown, but so has fossil fuel use Consequently, hydroelectric only supplies 1/4 of electrical generation –Currently use about 10% of potential supply –Much of recent hydropower development has been in very large dams Parana River, Yangtze River

10
© 2013 Pearson Education, Inc.

11
Water stored behind the wall of a hydropower dam accumulates potential energy. 1 Reservoir Dam The force of gravity carries water through an intake pipe known as a penstock. Penstock Turbine Water spins the turbine blades attached to a generator. Generator Long-distance power lines Hydroelectric power is generated and transmitted. River 2 4 3

12
© 2013 Pearson Education, Inc. Runoff from rainfall and snowpack Head pond Hydroelectric plant (houses generator) Transmission lines Outfall pipe (returns water to source) Buried penstock (steel pipe)
 Transmission lines Outfall pipe (returns water to source) Buried penstock (steel pipe).")
13
© 2013 Pearson Education, Inc.

14
16.2 Hydropower Advantages –Fuel and pollution free –Relatively inexpensive –Also provides flood control and water storage –Continuous electricity Disadvantages –Loss of land –Ecosystem disruption –Initial cost

15
Dam Drawbacks Human Displacement Ecosystem Destruction Wildlife Losses Large-Scale Flooding Due to Dam Failures Sedimentation Herbicide Contamination Evaporative Losses Nutrient Flow Retardation

16
Dam Alternatives Low-Head Hydropower - extract energy from small headwater dams Run-of-River Flow - turbines submerged directly in stream and usually do not require dam or diversion structure Micro-Hydro Generators - small versions designed to supply power to single homes

17
© 2013 Pearson Education, Inc.

19
16.3 Wind Power Sources and supplies –Driven by sun –Kinetic energy from wind collected by wind turbines Wind power less than 0.5% of global energy 6% of renewables

20
© 2013 Pearson Education, Inc.

21
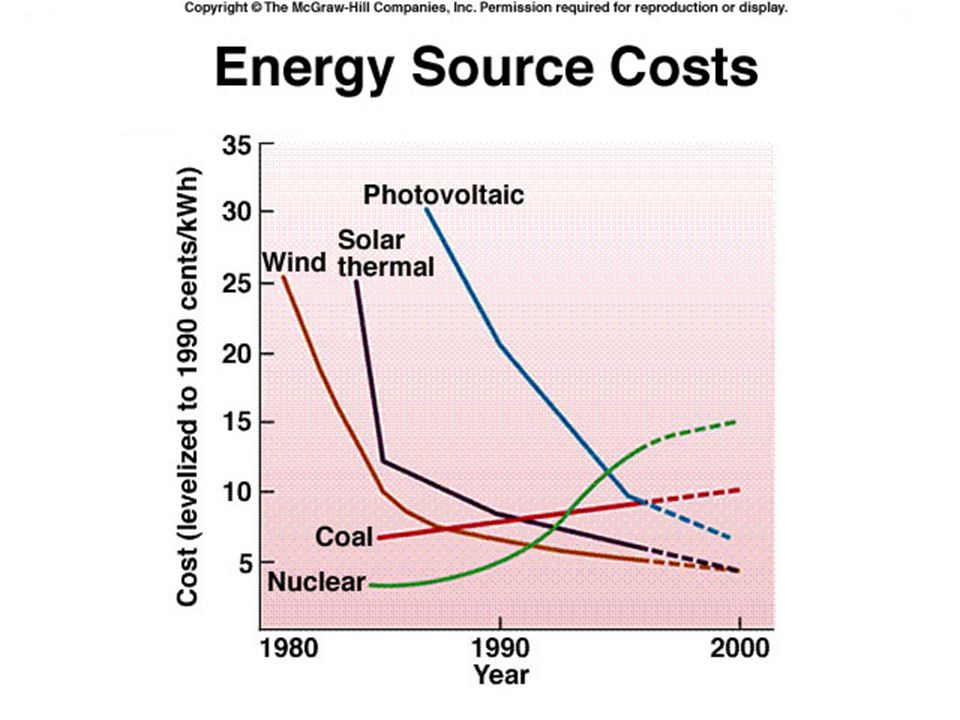
Wind Energy Estimated potential 50 times current nuclear generation 1920s - windmill technology thriving, but shut down in the 1930s Typically operates at 35% efficiency under field conditions Where conditions are favorable, (steady winds averaging at least 24 km/hr), electric prices are as low as 3 cents/KWH
, electric prices are as low as 3 cents/KWH")
22
Standard modern turbines use only 2 or 3 blades in order to operate better at high wind speeds

23
Wind Farms Large concentrations of wind generators producing commercial electricity Mountain ridges, plains, seacoasts Negative impacts: –Interrupt view in remote places –Destroy sense of isolation –potential bird kills

24
© 2013 Pearson Education, Inc. 16.3 Wind Power Advantages –No fuel, no pollution –Domestic –CO 2 e free Disadvantages –Intermittent –Aesthetics –Impacts to wildlife

25
© 2013 Pearson Education, Inc.

26
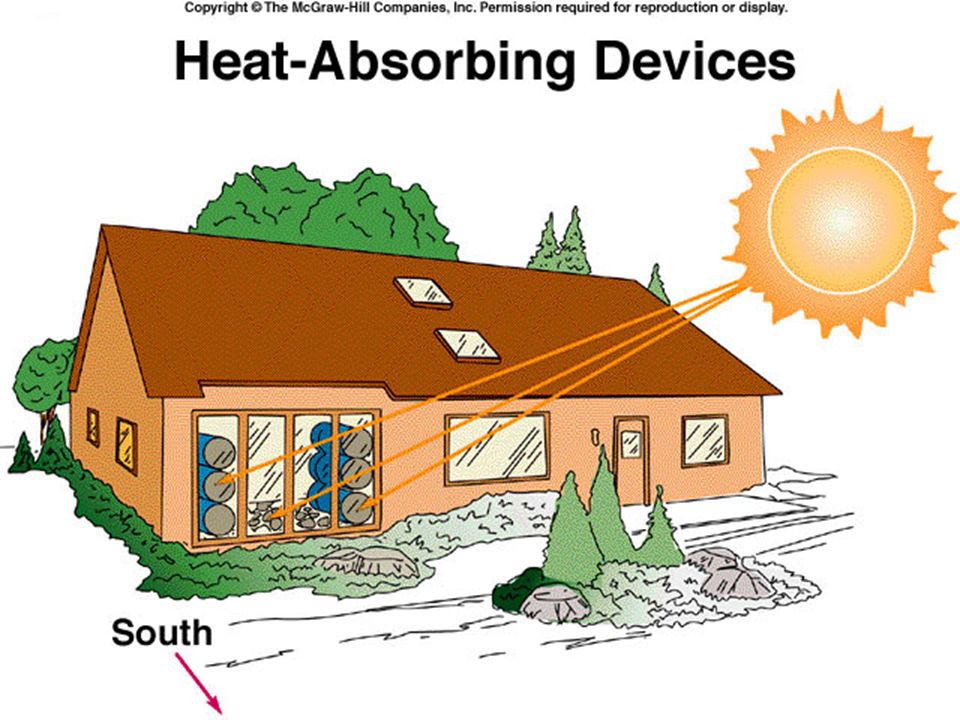
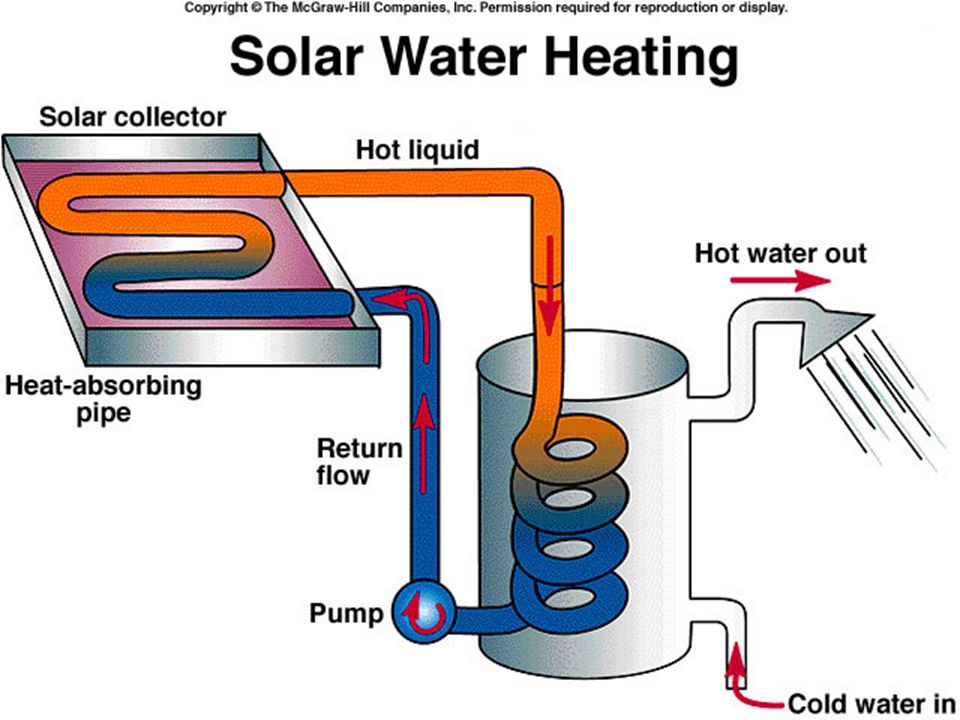
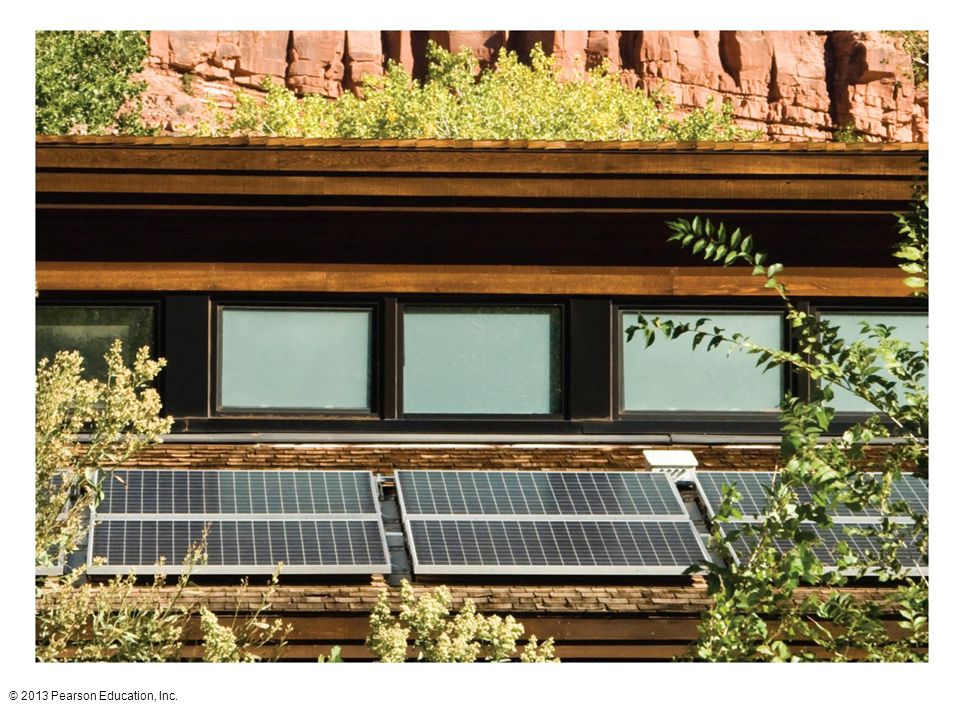
16.4 Solar Energy Sources and supplies Passive solar technology –Uses solar energy without mechanical devices –Natural lighting and heating Active solar –Uses mechanical devices –Rooftop solar panels Photovoltaic (PV) Solar water heater –Concentrating solar power system
 Solar water heater –Concentrating solar power system")
27
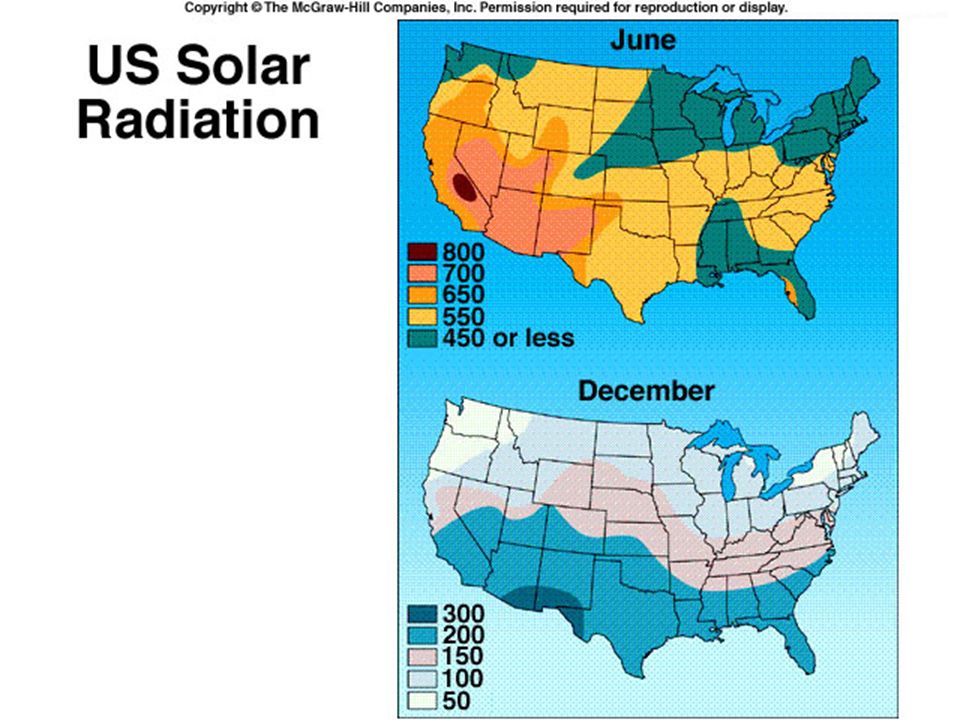
Tapping Solar Energy On average, solar energy reaching top of atmosphere = 1,330 watts/m 2 –50% absorbed or reflected by atmosphere –50% reaches earth this is 10,000 times more energy than all commercial energy used annually Until recently, this energy source has been too diffuse and low in intensity to capitalize for electricity

29
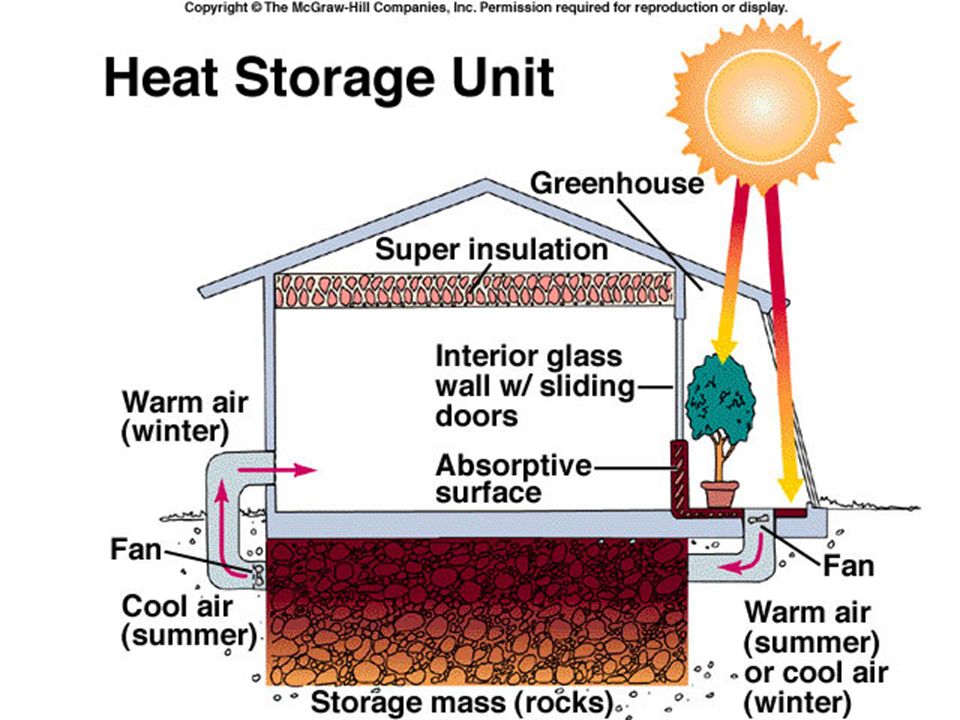
Passive Solar Heat Using absorptive structures to gather and hold heat –Stone, adobe, greenhouse design

31
Active Solar Heat Pump heat-absorbing medium through a collector Water heating consumes 15% of US domestic energy budget

33
Solar Energy Storage Insulated water tank Bin with stone, water, or clay Eutectic chemicals –Store large amounts of energy in a small volume –Heating melts the chemicals and cooling returns them to a solid state Most do not swell when they solidify and undergo phase change at higher temperatures than water and ice More convenient for heat storage

35
High-Temperature Solar Energy Use mirrors (parabolic, curved) to collect and focus light into a concentrated point. Two techniques: –Long curved mirrors focused on central tube containing a heat-absorbing fluid –Concentric rings of small mirrors around a tall central tower They track the sun and focus light on a heat absorber on top of the tower when molten salt is heated to drive a steam-turbine generator

36
© 2013 Pearson Education, Inc.

37
Photovoltaic Solar Energy Capture solar energy and converts it directly to electrical current by separating electrons form parent atoms and accelerating the across a one-way electrostatic barrier First observed in 1839 Application 1954 - Bell Laboratories –1958 - $2,000/watt –1970 - $100/watt –2001 - $5/watt

38
Photovoltaic Cells Efficiency of energy capture has increased from 10% in field conditions Invention of amorphous silicon collectors has allowed production of lightweight, cheaper cells –Currently $700 million annual market

41
Storing Electrical Energy Difficult and expensive –Lead-acid batteries are heavy and have low energy density, hazardous materials –Metal-gas batteries are inexpensive and have high energy density, but short lives –Alkali-metal batteries have high storage capacity, but are more expensive –Lithium batteries have very long lives, and store large amounts of energy, but are very expensive

42
Pumped hydro or air storage Decomposition of water to H 2 and O 2

43
© 2013 Pearson Education, Inc.

47
16.4 Solar Energy Advantages –Widely available –Few environmental costs Disadvantages –Intermittent –Regional –Distribution

48
© 2013 Pearson Education, Inc.

49
16.5 Biomass Energy Sources and supplies –Energy contained in wood and other plant matter –Derived from solar energy (photosynthesis) –Biomass can be burned to produce energy Wood Charcoal Crop residue Ethanol Biodiesel
 –Biomass can be burned to produce energy Wood Charcoal Crop residue Ethanol Biodiesel")
50
Energy from Biomass Plants capture about 0.1% of all solar energy that reaches earth’s surface Kinetic energy transformed to potential (chemical) energy –50% of energy used in metabolism –50% of energy stored as biomass
 energy –50% of energy used in metabolism –50% of energy stored as biomass")
51
Useful biomass production estimated at 15 - 20 times the amount currently obtained from all commercial energy sources Renewable energy resources account for 18% of total world energy use, and biomass makes up 3/4 of that supply

52
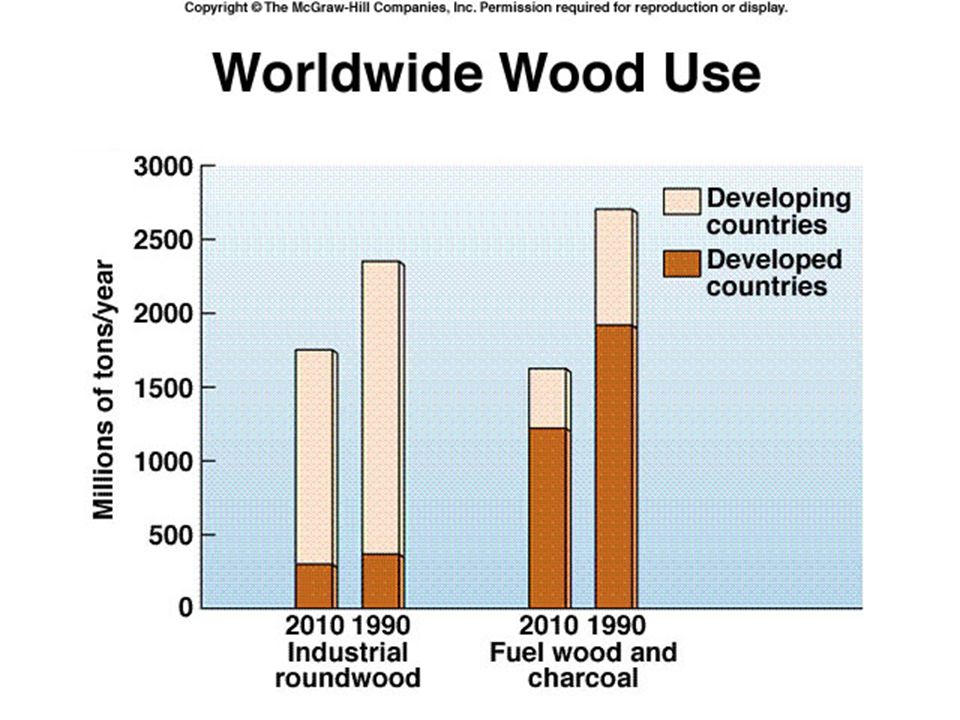
Burning Biomass Wood now provides < 1% of US energy, but provides up to 95% in poorer countries –About 1/2 of all wood harvested for fuel Inefficient burning of wood produces smoke laden with fine ash and soot, and hazardous amounts of carbon monoxide and hydrocarbons But - with efficient measures, it produces few sulfur gases, burns at lower temperatures than coal so fewer nitrogen oxides, no additional CO 2

53
Fuel wood Crisis 40% of world population depends on firewood and charcoal as their primary energy source –Of these, 3/4 do not have an adequate supply Problem intensifies as less developed countries continue to grow For urban dwellers, no opportunity to scavenge for wood, so it must be bought from merchants

54
More on the Crisis Remember - 50% of worldwide annual wood harvest is used as fuel –85% of fuel wood harvested in developing countries By 2025, worldwide demand for fuel wood is expected to be twice current harvest rates while supplies will have remained relatively static

56
Dung No other fuel supply? Dry and burn animal dung Not returning animal dung to land as fertilizer reduces crop production and food supplies When burned in open fires, 90% of potential heat and most of the nutrients are lost

58
© 2013 Pearson Education, Inc.

59
Few Other Biomass Options Ethanol, gasohol Crop Residues –Expensive Energy Crops –Trees (Leucaena) and shrubs (alder and willow), wetland plants, sunflower Peat
 and shrubs (alder and willow), wetland plants, sunflower Peat")
60
© 2013 Pearson Education, Inc.

61
16.5 Biomass Energy Advantages –Carbon neutral –Emits less NO 2 and SO 2 than fossil fuels –Evenly distributed Disadvantages –Impacts on food supply –Land clearing

62
© 2013 Pearson Education, Inc.

63
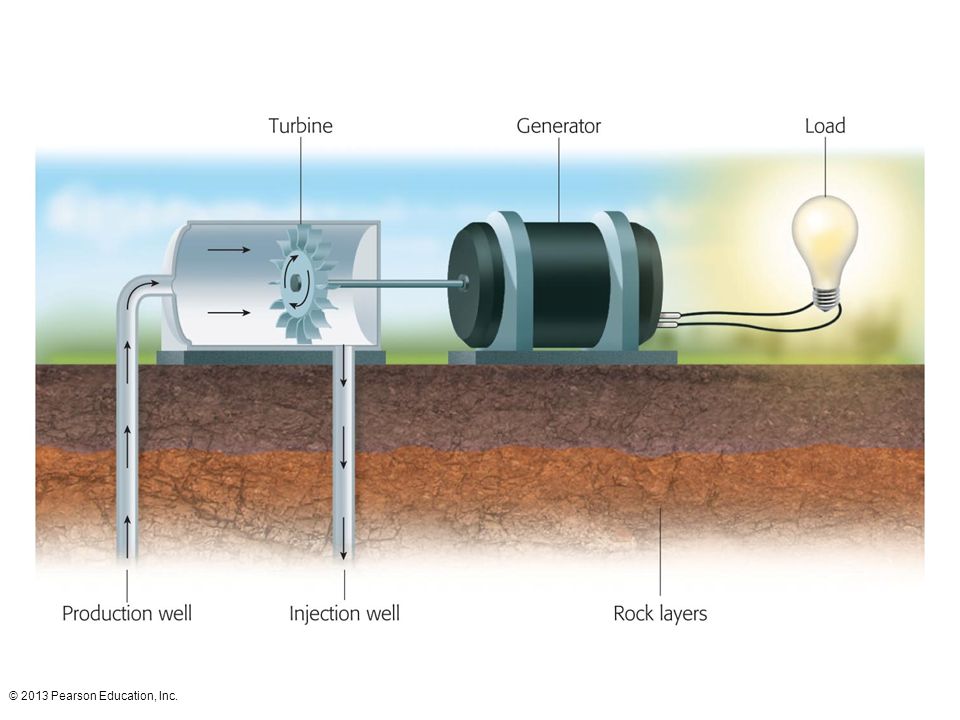
16.6 Geothermal Energy Sources and supplies –Uses heat energy from Earths' interior Harnessed in 3 ways –Dry-steam power plants –Flash-steam power plants –Ground-source heat pumps (GSHP)
")
64
Geothermal Energy High-pressure, high-temperature steam fields below earth’s surface - hot springs, geysers, fumaroles Recently used in electric power production, industrial processing, space heating, agriculture, and aquaculture Long life span, no mining, little waste disposal Potential danger of noxious gases and noise problems from steam valves

65
Pretty much a regional energy source –But some deep drilling to warm rocks

66
© 2013 Pearson Education, Inc.

68
16.6 Geothermal Energy Advantages –Reliable and relatively inexpensive –Pollution free Disadvantages –Can be overused –Start-up cost high –Regional

69
© 2013 Pearson Education, Inc.

70
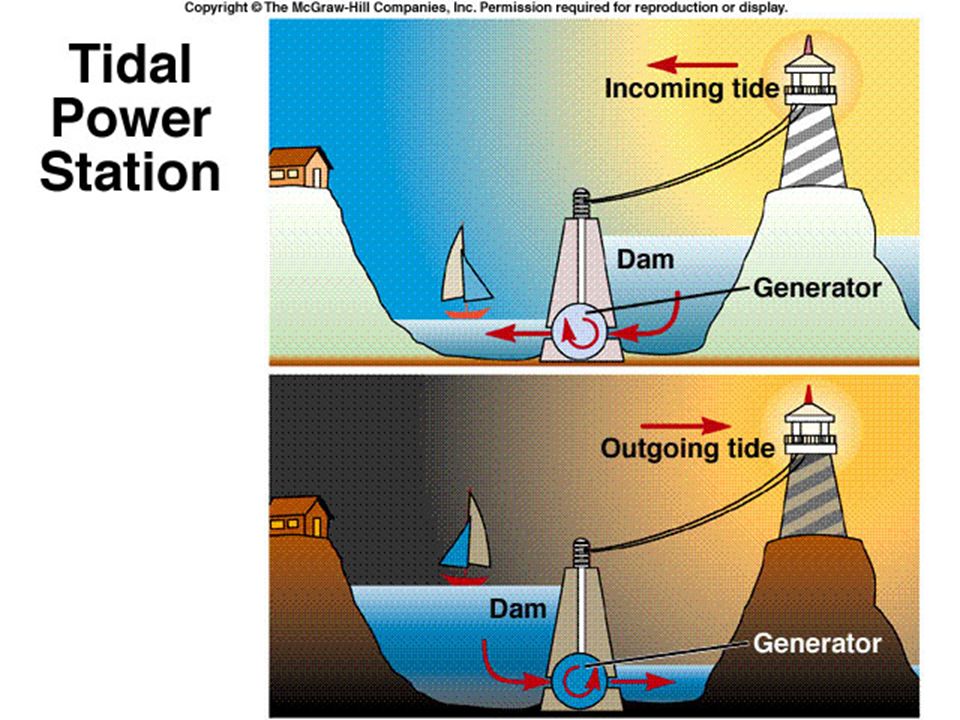
16.7 Ocean Energy Sources and supplies Takes advantage of tides, waves, and temperature differences –Tidal power Driven by moon Turbines turned as tides enter and leave bays –Waves power Uses kinetic energy of waves –Ocean thermal conversion (OTEC)
")
71
© 2013 Pearson Education, Inc.

73
Tidal and Wave Energy Harnessing the enormous amounts of energy in ocean tides and waves Tidal Station - tide flows through turbines, creating electricity –Requires a high tide / low tide differential of several meters –Main worries are saltwater flooding behind the dam and heavy siltation –Stormy coasts with strong waves are often far from major population centers

75
© 2013 Pearson Education, Inc.

76
16.8 Energy Conservation Advantages –Fuel free –Minimal emissions Disadvantages –Regional –Disruptive to ecosystems

77
© 2013 Pearson Education, Inc. 16.8 Energy Conservation Energy conservation can help meet growing energy demands Economic energy intensity –Measure of overall energy efficiency Amount of energy used per dollar output Higher in industrialized countries

78
© 2013 Pearson Education, Inc.

79
Conservation Our energy use is inefficient, most potential energy is lost as waste heat Techniques available for industry, transportation, domestic use –US automobile gas mileage increased form 13 mpg in 1975 to 28.8 mpg in 1988 –Falling fuel prices of 1980s discouraged further conservation

80
Utilization Efficiencies New homes today use ½ the fuel required in a house built in 1974; but more can be done –Better insulation, glazing windows, window coverings, reduced air infiltration –New national standards for washing machines, have to use 35% less water by 2007 –New air conditioning standards

81
Utilization Efficiencies Superinsulated homes Houses can use passive solar, trees or roofs, earth sheltering Industry can save energy by using more efficient= equipment

82
Energy Conversion Efficiencies Energy efficiency = measure of energy produced compared to energy consumed –Thermal conversion machines turn no more than 40% of energy in primary fuel into electricity or mechanical power due to waste heat –Fuel cells can theoretically approach 80% efficiency using hydrogen or methane

83
Net Energy Yield Based on total useful energy produced during lifetime of an entire energy system, minus the energy required to make useful energy available Expressed as a ratio between output of useful energy and energy costs Considers all energy put into system (mining, processing, build, operating and dismantling)
")
84
Negawatt Programs Less expensive to finance conservation projects than to build new power plants Power companies invest in negawatts of demand avoidance –Conservation costs on average: $350/kw –New nuclear power plant: $8,000/kw –New coal power plant: $1,000/kw

85
Cogeneration Simultaneous production of both electricity and steam or hot water, in the same plant Increases net energy yield from 30-35% to 80-90% –In 1900, half of electricity generated in US came from plants also providing industrial steam or district heating –By 1970s, cogeneration had fallen to <5% of power supplies –Now renewed interest

86
Promoting Renewable Energy Proposed conservation policies: –Distributional Surcharges small fee levied on all utility customers –Renewable Portfolio Suppliers must get minimum % of power from renewable sources –Green Pricing allows utilities to profit from conservation programs and charge premium prices for renewable energy

87
© 2013 Pearson Education, Inc. 16.8 Energy Conservation Lighting and appliance efficiency –Incandescent vs. compact fluorescent lights (CFLs) vs. light-emitting diodes (LEDs) –Standby mode Automobile efficiency –Fuel efficiency Gasoline-electric hybrid Plug-in hybrid automobiles
 vs. light-emitting diodes (LEDs) –Standby mode Automobile efficiency –Fuel efficiency Gasoline-electric hybrid Plug-in hybrid automobiles.")
88
© 2013 Pearson Education, Inc.

89
16.9 Sustainable Energy—Economics and Policy Measuring economic benefits –Conservation viewed as "win-win" –Yet cost may be prohibitive Cost of saved energy (CSE) –Policy options Renewable portfolio standards (RPS) –Government mandate that a certain percentage of energy use is from renewables –Consumer education EPA's energy star program
 –Policy options Renewable portfolio standards (RPS) –Government mandate that a certain percentage of energy use is from renewables –Consumer education EPA s energy star program")
90
© 2013 Pearson Education, Inc.

91
An Alternative Energy Future?

Similar presentations


 or to cause a change. Wind has energy to move these wind turbines.>")


 Production – Use the sun’s energy to heat water or air Either stored or used immediately – Photovoltaic cells are used.>")
