Download presentation
Presentation is loading. Please wait.

1
Presentation to the State Board of Education February 19, 2015

2
Number of cohort members who earned a regular high school diploma through September 2014 ------------------------------------------------------------------------- Number of first-time 9 th graders in the fall of 2010 (starting cohort) plus students who transfer in, minus students who transfer out, emigrate, or are deceased during school years 2010-2011, 2011-2012, 2012- 2013, 2013-2014
 plus students who transfer in, minus students who transfer out, emigrate, or are deceased during school years , , ,")
3
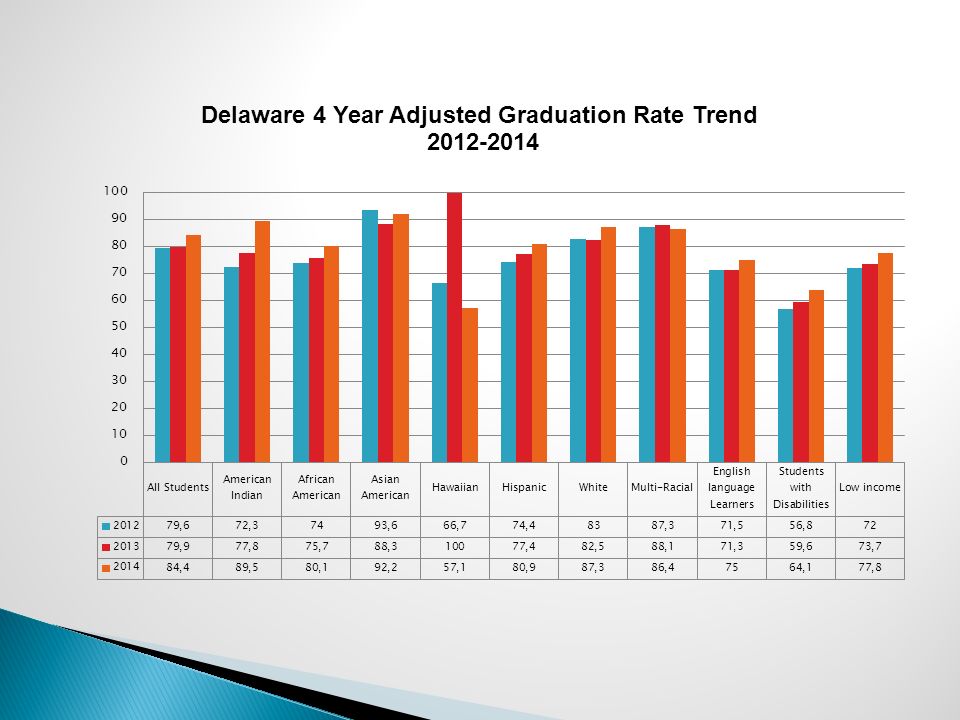
CohortGraduatesGraduation Rate All Students9713820284.4% American Indian383489.5% African American 3104248680.1% Asian33230692.2% Hawaiian<15 57.1% White5094444787.3% Hispanic105785580.9% Multi-Racial817086.4% English Language Learners 32824675.0% Students with Disabilities 130883964.1% Low Income4673363477.8% Class of 2014

4
2014 ESEA Target2013-2014 Results All Students 83.8%84.4% * American Indian 83.4%89.5%* African American 79.4%80.1%* Asian American 92.4%92.2% Hawaiian 100%57.1% White 86.8%87.3%* Hispanic 78.9%80.9%* Multi-Racial 96.3%86.4% English Language Learners 75.1%75.0% Students with Disabilities 66.7%64.1% Low Income 77.3%77.8%* * Made ESEA Target

6
2012-20132013-2014 Appoquinimink86.5%94.7% Brandywine85.0%84.6% Caesar Rodney79.9%88.5% Cape Henlopen83.0%91.0% Capital75.6%83.1% Christina67.4%74.5% Colonial70.7%80.8% Delmar89.3%92.3% Indian River86.6%93.7% Lake Forest77.3%82.1% Laurel61.4%76.7% Decrease from previous year

7
2012-20132013-2014 Maurice J. Moyer Academic Institute 40.5%32.1% Milford83.3%84.2% NCCVT87.6%93.6% Polytech98.1%97.2% Positive Outcomes 50.0%54.5% Red Clay Includes Charter School of Wilmington and Delaware Military Academy 84.4%90.3% Seaford74.2%79.7% Smyrna77.7%77.6% Sussex Tech98.7%97.2% Woodbridge60.7%82.7% Decrease from previous year

10
Number of cohort members who earned a regular high school diploma through Fall of 2013 ------------------------------------------------------------------------- Number of first-time 9 th graders in the fall of 2009 (starting cohort) plus students who transfer in, minus students who transfer out, emigrate, or are deceased during school years 2009-2010, 2010-2011, 2011-2012, 2012-2013, 2013-2014
 plus students who transfer in, minus students who transfer out, emigrate, or are deceased during school years , , , ,")
11
SY 2009- 2010 Began 9 th grade SY 2010- 2011 Year 2 SY 2011- 2012 Year 3 SY 2012- 2013 4 year graduate SY 2013- 2014 5 year graduate

12
4 Year Adjusted Cohort Graduates When we added an additional year (Year 5) the New # of Graduates Net Change from year 4 to year 5 4 Year Adjusted Cohort Graduation Rate 5 Year Adjusted Cohort Graduation Rate All Students8190833114179.981.1 African American 261926816275.777.3 Asian293300788.390.6 Hispanic819825677.478.0 White437744386182.583.5 Multi-Racial5257588.192.2 Low Income372238149273.775.3 Students with Disabilities 9209725259.662.8 English Language Learners 2482591171.374.0
 the New # of Graduates Net Change from year 4 to year 5 4 Year Adjusted Cohort Graduation Rate 5 Year Adjusted Cohort Graduation Rate All Students African American Asian Hispanic White Multi-Racial Low Income Students with Disabilities English Language Learners")
13
2013-2014

14
“There’s no young person who aspires to be a high school dropout.” “When someone drops out, it’s a symptom of a problem. It’s not the problem itself. Something has gone radically wrong.” U.S. Secretary of Education, Arne Duncan

15
Dropout rate: ◦ Dropout rate is calculated for grades 9 through 12 as prescribed by the National Center for Educational Statistics (NCES) ◦ Dropout rate is total number of students (grades 9-12) who dropped out in a single year, divided by the total enrollment of the same school year. This is reported as the event (annual) dropout rate.
 dropout rate..")
16
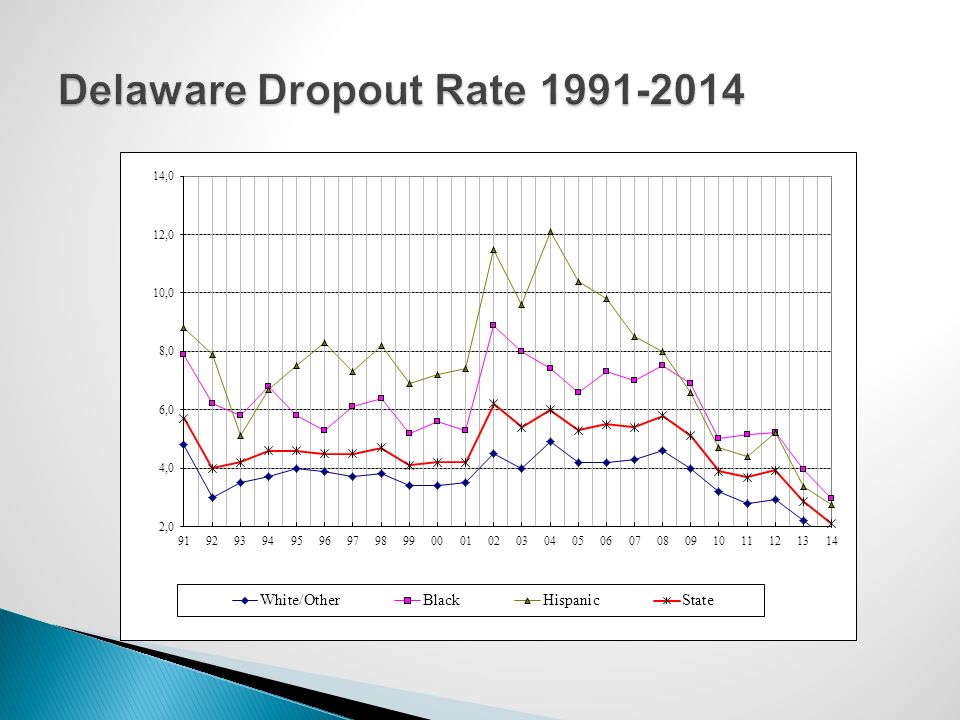
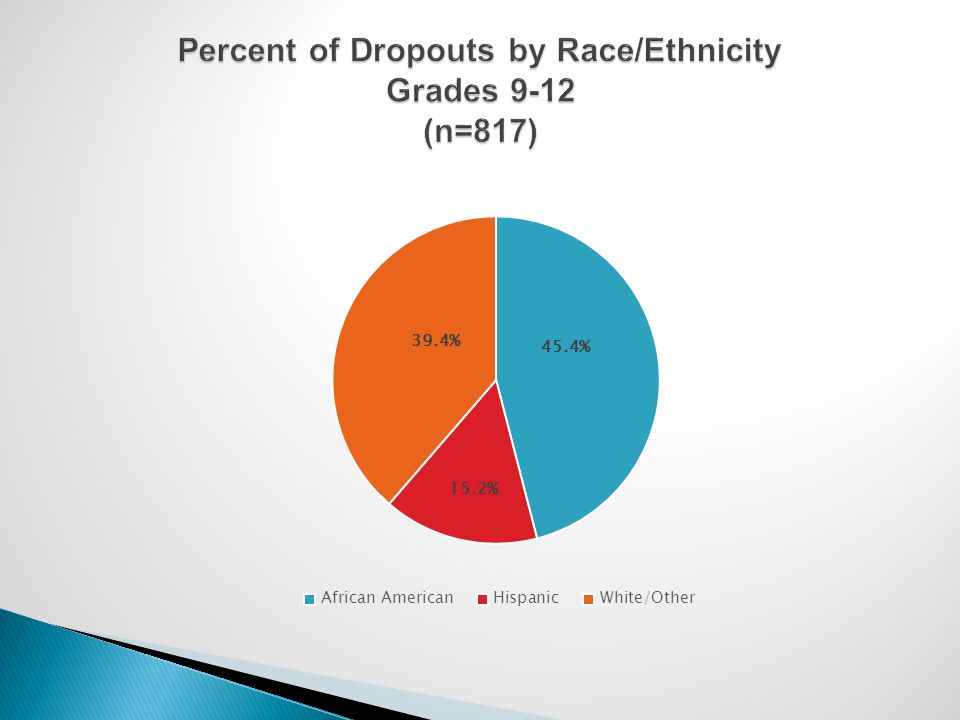
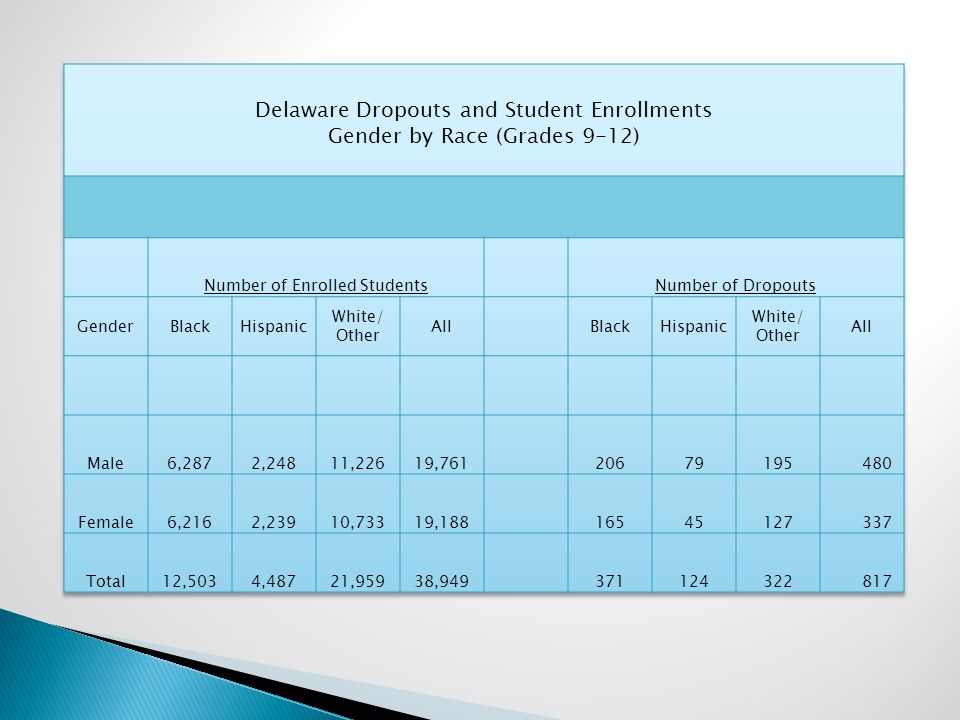
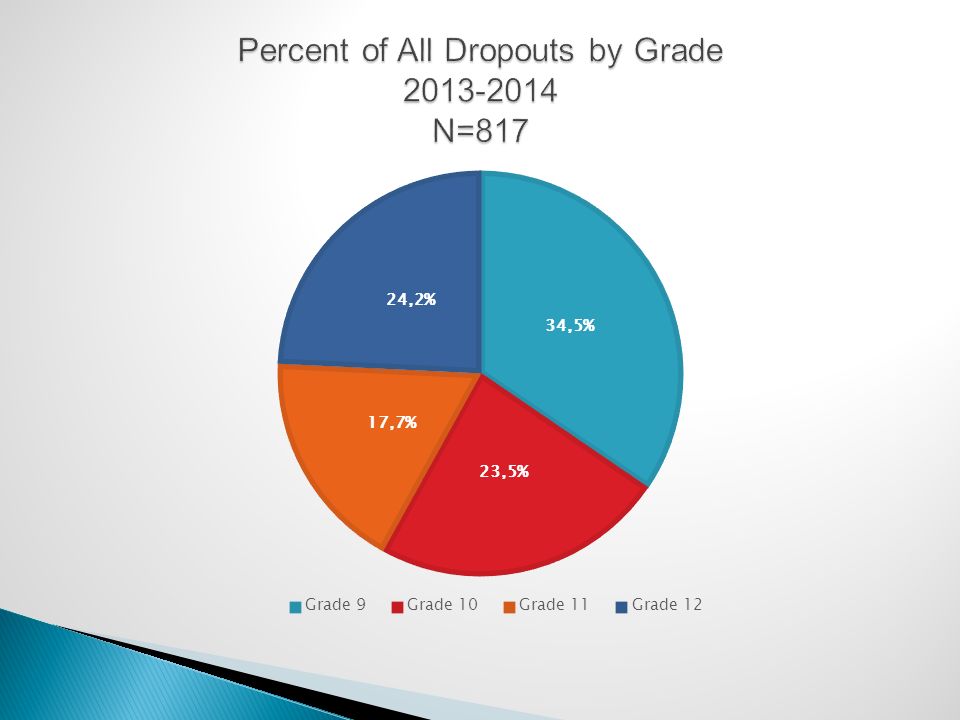
For the 2013-2014 school year, grades 9-12: 817 of the 38,949 students enrolled dropped out of school during the school year Annual dropout rate for 2013-2014 is 2.1% Decrease from the previous year’s rate of 2.9%

18
20072008200920102011201220132014 National Average 4.4%4.1% 3.4%3.3% --- Delaware5.5%6.0%5.1%3.9%3.7%3.9%2.9%2.1%

21
Grade 7 Grade 8 No. of Dropouts Students Enrolled Dropout Rate No. of Dropouts Students Enrolled Dropout Rate Kent County 352,4201.4%402,3111.7% New Castle County 405,6820.7%895,8461.5% Sussex County 131,9890.7% 171,9330.9% State 8810,0910.9%14610,0901.4%

23
Delaware Dropout Rate by County by Grade Number of Enrolled StudentsNumber of Dropouts Grade County9101112All9101112All Kent2,5462,2142,0411,8638,66455354326159 New Castle6,8535,7525,0575,10222,76419111777130515 Sussex2,1451,8561,8031,7177,52136402542143 State11,5449,8228,9018,68238,949282192145198817

24
SY 11-12 Enrollment SY 11-12 # of Dropouts SY 12-13 Enrollment SY 12-13 # of Dropouts SY 13-14 Enrollment SY 13-14 # of Dropouts New Castle County 22,7731,022 (4.5%) 22,558674 (3.0%) 22,764515 (2.3%) Kent County8,683289 (3.3%) 8,653253 (2.9%) 8,664159 (1.8%) Sussex County7,444216 (2.9%) 7,402179 (2.4%) 7,521143 (1.9%)
 22, (3.0%) 22, (2.3%) Kent County8, (3.3%) 8, (2.9%) 8, (1.8%) Sussex County7, (2.9%) 7, (2.4%) 7, (1.9%)")
25
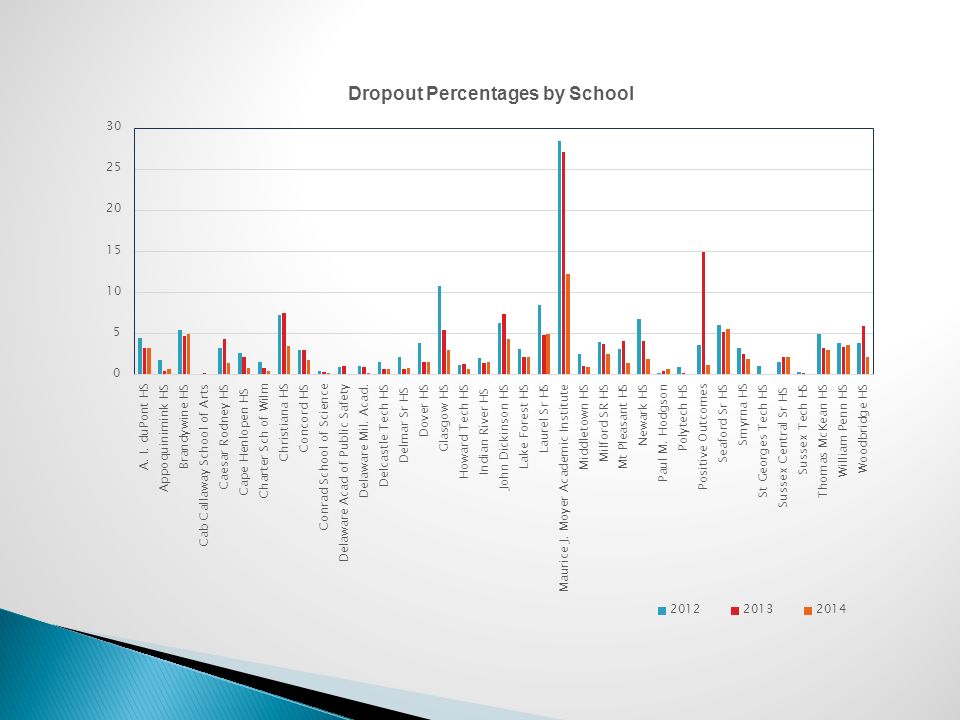
201220132014 Middletown HS29<15 Appoquinimink HS27<15 Howard Tech HS<15 St Georges Tech HS<15 Paul M. Hodgson<15 Delcastle Tech HS23<15 Brandywine HS544645 Concord HS403720 Mt Pleasant HS2939<15 Conrad School of Science<15 Cab Callaway School of Arts<15 John Dickinson HS395433 A. I. duPont HS5737 Thomas McKean HS442826 Charter Sch of Wilm15<15 Christiana HS726329 Glasgow HS1165330 Newark HS996230 William Penn HS757179 M.J. Moyer Academy292316 Delaware Acad of Public Safety<15 Delaware Mil. Acad.<15

27
201220132014 Positive Outcomes <1513<15 Caesar Rodney HS 699228 Dover HS5726 POLYTECH HS<15 Lake Forest HS282019 Milford HS333126 Smyrna HS463428

28
201220132014 Sussex Academy<15 Cape Henlopen HS3527<15 Delmar Senior HS<15 Indian River HS18<1515 Sussex Central Senior HS 2027 Laurel Senior HS422224 Seaford Senior HS453739 Sussex Tech HS<15 Woodbridge HS2334<15

29
4 Year Adjusted Cohort Dropout Rate The number of students who leave school for any reason other than death within the 4 year period divided by the number of students who form the adjusted cohort. We will be looking at 3 different cohorts of students to examine the dropouts and track the number of students lost each year within those cohorts.

30
# of Students that dropped out in 1 st Year # of Students that dropped out in Year 2 # of Students that dropped out in Year 3 # of Students that dropped out in Year 4 Total # of Dropouts over the 4 years for each of the adjusted cohort classes 4 Year Adjusted Cohort Dropout Rate Class of 2012 Began 9 th grade in Fall 200843 (5.7%) 451 (59.3%) 100 (13.2%) 166 (21.8%) 7607.3 Class of 2013 Began 9 th grade in Fall 2009281 (37.6%) 109 (14.6%) 213 (28.5%) 144 (19.3%) 7477.3 Class of 2014 Began 9 th grade in Fall 201060 (12.4%) 179 (36.9%) 134 (27.6%) 112 (23.1%) 4855.0
 451 (59.3%) 100 (13.2%) 166 (21.8%) Class of 2013 Began 9 th grade in Fall (37.6%) 109 (14.6%) 213 (28.5%) 144 (19.3%) Class of 2014 Began 9 th grade in Fall (12.4%) 179 (36.9%) 134 (27.6%) 112 (23.1%)")
31
Challis Breithaupt Education Associate (302) 735-4076 Fran Purnell Education Specialist (302) 857-3320
 Fran Purnell Education Specialist (302)")
Similar presentations