Download presentation
Presentation is loading. Please wait.

1
STATISTICS IN PSYCHOLOGY Describing and analyzing the data

2
Process of research in Ψ 1 ■ A research question based on previous research → aim and hypothesis (experiment) ■Choice of method to test hypothesis (Experiment) ■Data collection
 ■Choice of method to test hypothesis (Experiment) ■Data collection")
3
Process of research in Ψ 2 ■Describe results (descriptive stats) ■Analyze results → in experiments we want to know the probability that results are due to manipulation of IV (inferential stats) ■Interpret results ■Discuss results in the light of previous studies ■Outline possible future areas of research
 ■Analyze results → in experiments we want to know the probability that results are due to manipulation of IV (inferential stats) ■Interpret results ■Discuss results in the light of previous studies ■Outline possible future areas of research")
4
Data ■Raw data (what comes out of data collection) Levels of measurement of data: ■Nominal: discrete categories → e.g. the number of people who helped or not ■Ordinal: Measurements that can be ranked or put in position but intervals unknown → she came in first, he came second etc. ■Interval and ratio: measurements based on scales → temperature (interval) and time in seconds (ratio)
 and time in seconds (ratio).")
5
Levels of data: nominal (categories) ■Which shows do you watch regularly? ■We can put these into categories. ■So lets try it….

6
Levels of Data: ordinal (placed in order) ■How can we transform this in Ordinal data? ■These can be put in order… in order of favorite ■So lets try it…

7
Levels of ratio/interval data ■A level of measurement where units of equal measurements (a scale with equal intervals) are used e.g. minutes, kilograms, speed. ■Ratio data is on a scale, but has a true zero eg weight/height, time, distance.

8
Levels of data: interval/ratio ■How can we transform this in ratio or interval data? ■We can measure and compare the exact time because the intervals on the ruler are equal. ■So lets try it…

9
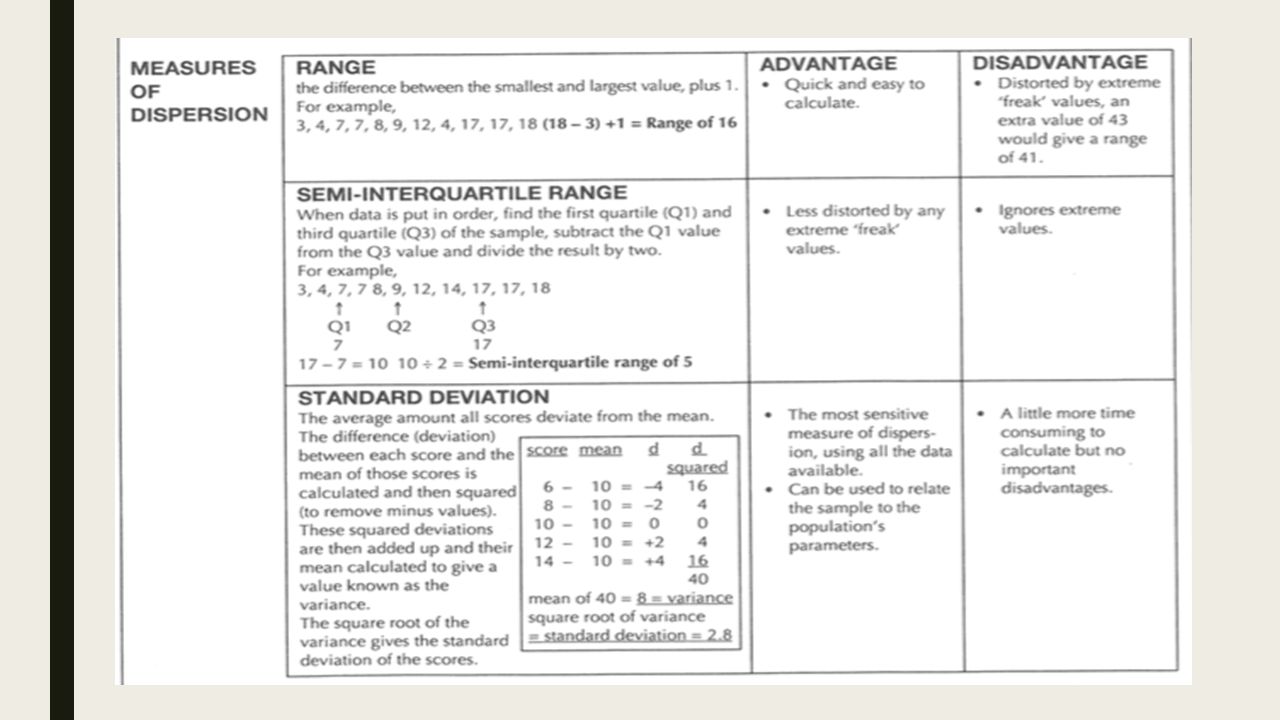
DESCRIPTIVE STATS Each of you need to calculate and present ONE measure of central tendency and ONE measure of Dispersion Each of these ‘choices’ needs to be justified See samples and rubric for more details

10
Descriptive statistics Not all stats can be applied to all levels of data ■Mode : most frequent score (nominal data) ■Median: middle value when scores are placed in rank order (ordinal data) ■Mean: average value of all scores (interval and ratio data)
 ■Median: middle value when scores are placed in rank order (ordinal data) ■Mean: average value of all scores (interval and ratio data)")
13
INFERENTIAL STATS (HL ONLY) Each of you need to calculate and present ONE Statistical Test Your ‘choice’ needs to be justified The Results of your test should allow you to accept/reject your hypothesis See samples and rubric for more details
 Each of you need to calculate and present ONE Statistical Test Your ‘choice’ needs to be justified The Results of your test should allow you to accept/reject your hypothesis See samples and rubric for more details")
14
INFERENTIAL STATS ■For HL, you need to determine the appropriate statistical test and apply it to your data. ■P Value = <.05 –This means that 95% of my hypothesis AGREES with the data and is not up to chance. ■If the hypothesis contains a prediction the test is one-tailed ■If the hypothesis is non directional the test is two-tailed ■Type I error: we accept a hypothesis that is not true (our test is not tight enough) ■Type II error: We reject a hypothesis that is true (our test is too tight)
 ■Type II error: We reject a hypothesis that is true (our test is too tight).")
15
Inferential Statistics ■So.....got that? Use the diagram on the following slide to help you decide which test to do:

16
Inferential Statistics

17
Just plug it in… ■This website lets you use the tests (click on the correct one and input your data): ■http://www.socscistatistics.com/Default.aspxhttp://www.socscistatistics.com/Default.aspx ■If you choose to use this, Be sure to screen shot all results and include in the appendix. ■Also, be sure to place a properly formatted full reference to the cite on your Works Cited page

Similar presentations