Download presentation
Presentation is loading. Please wait.

1
Choosing Statistical Procedures

2
Types of Inferential Statistics
Parametric Statistics: estimate the value of a population parameter from the characteristics of a sample Assumes the values in a sample are normally distributed Interval/Ratio level data required Nonparametric Statistics: No assumptions about the underlying distribution of the sample Used when the data do not meet the assumption for a nonparametric test (ordinal and nominal data)
")
3
What are We Testing Anyway?
Parametric Statistics: comparing the means of two or more groups relative to the variance within the groups Nonparametric Statistics: comparing the medians or ranks of two or more groups Testing the null hypothesis Statistical Significance: determination that the differences between groups are large enough to be unlikely to have occurred by chance

4
Steps in the Test of Significance
State the null hypothesis. State the alternative hypothesis. Set the level of significance associated with the null hypothesis (Type I Error). Select the appropriate test statistic. Compute the test statistic value. Determine the critical value needed for rejection of the null hypothesis for the particular statistic. Compare the obtained value to the critical value. Make a decision: Accept or reject the null hypothesis.
. Select the appropriate test statistic. Compute the test statistic value. Determine the critical value needed for rejection of the null hypothesis for the particular statistic. Compare the obtained value to the critical value. Make a decision: Accept or reject the null hypothesis.")
5
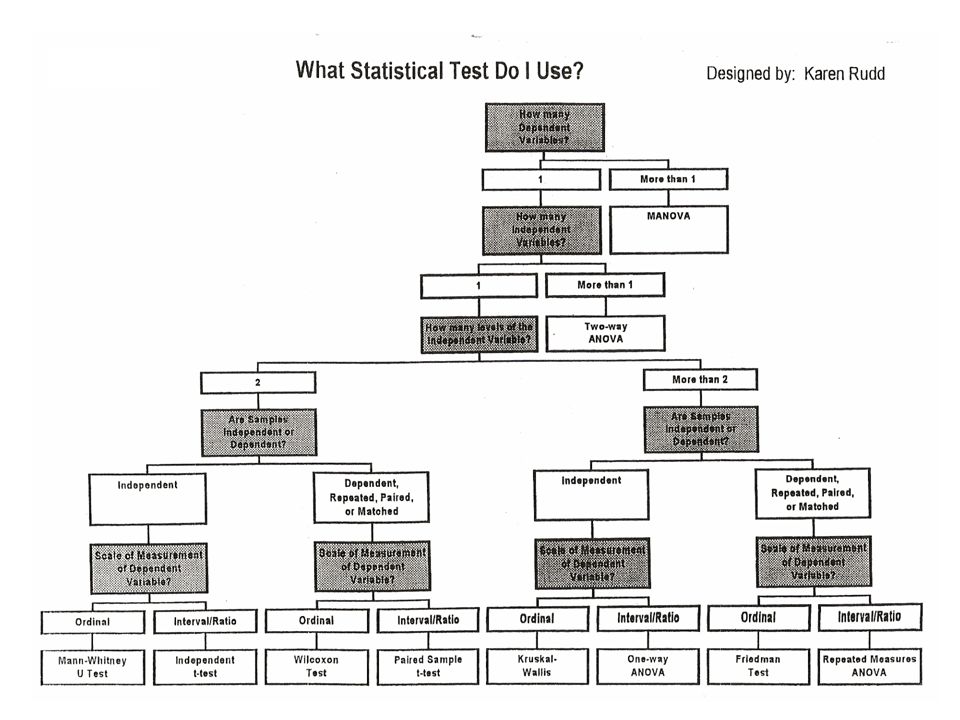
All These Tests! How do I know which one?
The type of statistical test you use depends on several factors: Number of independent variables Number of levels of the independent variable(s) Number of dependent variables Independent vs. dependent samples (between vs. within groups design) Scale of measurement of the dependent variable
 Number of dependent variables. Independent vs. dependent samples (between vs. within groups design) Scale of measurement of the dependent variable.")
6
Selecting Statistical Tests

8
What Can We Conclude? Intact Groups Design (Quasi-Experiments)
Subject Variables: conditions over which the experimenter has no direct control Cannot establish cause and effect Can only conclude that the groups are different from one another True Experiments Manipulated Variables: conditions that the experimenter controls directly and to which he randomly assigns participants Allows for cause and effect interpretations

9
The Power of a Test Power of a Test: the probability that one will reject H0 when it is a false statement. The power of a statistical analysis is represented as 1 – β. Reminder: β = the probability of making a Type II Error It is influenced by: μX - μ0 n σ α Type 2 error the probability of failing to reject a null hypothesis when it is false missed opportunity Power probability of NOT failing to reject the null when it is false the probability of accurately rejecting a false null hypothesis

10
Effect Size Statistics
Due to the role of N (sample size) in the formulae for parametric statistics, a large sample size can make a negligible difference between groups appear significant. Because of this, current APA guidelines recommend computing effect size statistics in addition to parametric comparisons.
 in the formulae for parametric statistics, a large sample size can make a negligible difference between groups appear significant. Because of this, current APA guidelines recommend computing effect size statistics in addition to parametric comparisons.")
11
Uses of the Effect Size Statistic
The effect size statistic can be used to: Estimate the true effect of the IV Compare the results of one research project to the results of other projects Estimate the power of the statistic Estimate the number of subjects one needs in a research project to maximize the chance of rejecting a false hypothesis (power)
")
Similar presentations


 Hypothesis Testing with Sample.>")


 Hypothesis Testing with Sample.>")

