Download presentation
Presentation is loading. Please wait.

1
Human Populations : Growth, Demography and Carrying Capacity http://www.miniature-earth.com/

2
Demography Demography: –The study of populations Developed countries Developing countries Age Structure Diagram: The distribution of ages in a specific population at a certain time.

3
Age Structure

4
http://www.youtube.com/watch?v= grbSQ6O6kbs

5
Exponential Growth The material below explains the concepts of exponential growth and doubling time - the time it would take a population to double if it were growing exponentially at a constant rate. Throughout human history, human population has generally grown in an exponential manner, and discussion of exponential doubling times has been appropriate.

6
The Rule of 70 The Rule of 70 is useful for financial as well as demographic analysis. It states that to find the doubling time of a quantity growing at a given annual percentage rate, divide the percentage number into 70 to obtain the approximate number of years required to double. –For example, at a 10% annual growth rate, doubling time is 70 / 10 = 7 years. –Similarly, to get the annual growth rate, divide 70 by the doubling time. For example, 70 / 14 years doubling time = 5, or a 5% annual growth rate.

7
Maximum Population Growth (MPG) Influenced by Biotic PotentialInfluenced by Biotic Potential – different for each species – can change with conditions MPG is always exponential under ideal conditionsMPG is always exponential under ideal conditions
 Influenced by Biotic PotentialInfluenced by Biotic Potential – different for each species – can change with conditions MPG is always exponential under ideal conditionsMPG is always exponential under ideal conditions")
8
Survivorship The percentage of members of a group that are likely to survive to any given age. –Survivorship Curves: show how much of the population survives to a given age Over 95% of this increase will take place in “Developing Countries” Over 95% of this increase will take place in “Developing Countries”

9
Current World Population Current Population Clock U.S. 314,551,726 World 7,044,803,052 16:39 UTC (EST+5) Oct 10, 2012 The global population grows by: –Nearly 2.3 persons per seconds –Nearly 8,343 persons per hour –Over 200,234 persons per day –Over 78 million persons per year http://www.poodwaddle.com/clocks/worldclock/
 Oct 10, 2012 The global population grows by: –Nearly 2.3 persons per seconds –Nearly 8,343 persons per hour –Over 200,234 persons per day –Over 78 million persons per year")
10
How Much is a Billion? 1,000 seconds = 16.7 minutes 1 million-s = 16,677 min = 11.6 days 1 billion-s = 11,574 days = 31.7 years 1,000 pennies = ~ 88 ounces = 5.5 pounds 1 million pennies = 5,500 pounds (~1-Suburban) 1 billion pennies = 2,750 tons (~2 Space Shuttles)
 1 billion pennies = 2,750 tons (~2 Space Shuttles).")
11
Human Population Growth

12
Population Growth Total Fertility Rate: –The number of babies born each year per 1,000 women in a population. Replacement Level Fertility: –The average # of children each parent must have in order to replace themselves in the population. in developed; in developing countries TFR – Total Fertility Rate - 1.6 in developed; 3.3 in developing countries Developed ;developing countries due to child mortality RLF – Replacement Level Fertility – Developed 2.1;developing countries 2.5 due to child mortality

14
Global Total Fertility Rates

15
Population Growth TFR needs to drop to 2.1 in order to stabilize the population.(Takes into account infant mortality)TFR needs to drop to 2.1 in order to stabilize the population.(Takes into account infant mortality) TFR > RLF = pop growth TFR > RLF = pop growth TFR = RLF = steady population TFR = RLF = steady population TFR < RLF = pop slow down TFR < RLF = pop slow down
TFR needs to drop to 2.1 in order to stabilize the population.(Takes into account infant mortality) TFR > RLF = pop growth TFR > RLF = pop growth TFR = RLF = steady population TFR = RLF = steady population TFR < RLF = pop slow down TFR < RLF = pop slow down")
16
Human Population Growth

17
10 Factors affecting Birth rate and Fertility rate 1.Average level of education and affluence 2.Importance of children as a part of the labor force 3.Urban areas (w/rt access to family planning) 4.Cost of raising and educating children 5.Education and employment opportunity for women 6.Infant mortality rate 7.Average age of marriage and 1st child 8.Availability of pension system 9.Availability of legal abortions 10.Birth control/religion
 4.Cost of raising and educating children 5.Education and employment opportunity for women 6.Infant mortality rate 7.Average age of marriage and 1st child 8.Availability of pension system 9.Availability of legal abortions 10.Birth control/religion")
18
Life Expectancy Life Expectancy: –The average number of years a person is likely to live. Affected by: –Infant Mortality: the death rate of infants less than a year old. The Demographic Transition

19
Demographic Transition In this stage, standards of hygiene and more modern medical techniques began to drive the death rate down, leading to a significant upward trend in population size. The birth rate remained high, as much of the economy was based on agriculture. Mexico is currently between this and the following stage. Urbanization decreases the economic incentives for large families. The cost of supporting an urban family grew and parents were more actively discouraged from having large families. In response to these economic pressures, the birth rate started to drop, ultimately coming close to the death rate.

20
Population Density # of indiv. of a species unit of area A better way to describe the size of a population A better way to describe the size of a population ex. 314,000,000 people = 34 people/Km 2 in the US ex. 314,000,000 people = 34 people/Km 2 in the US 9,166,605 Km 2 9,166,605 Km 2

21
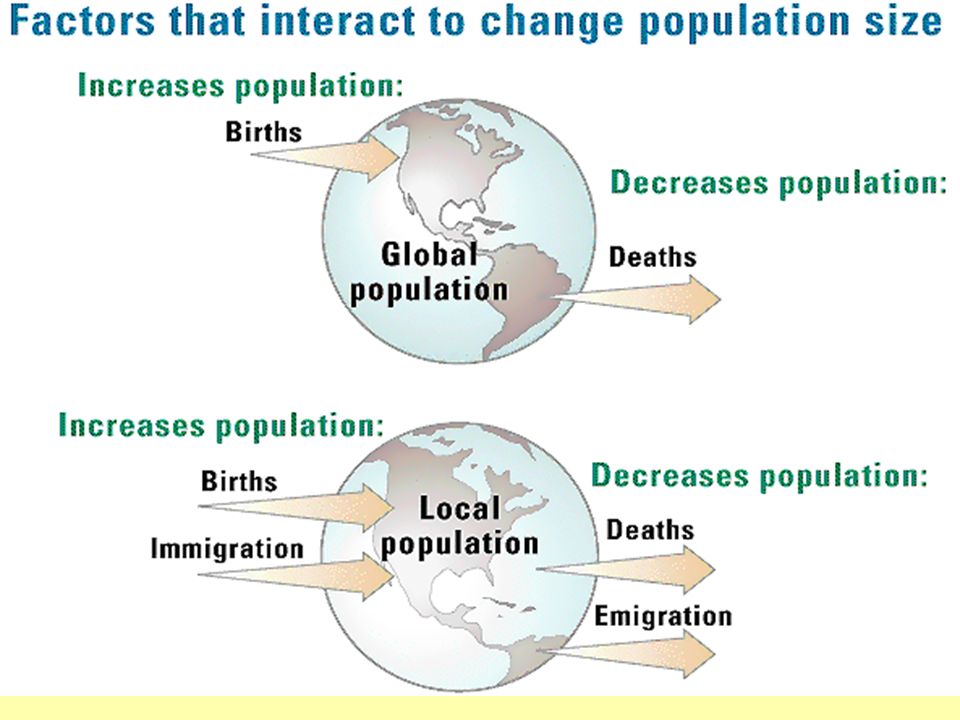
Dependent on: Birth rate (b )Birth rate (b ) Death rate (d )Death rate (d ) Immigration (i )Immigration (i ) Emigration (e )Emigration (e ) What Causes Populations to Change in Size?
Birth rate (b ) Death rate (d )Death rate (d ) Immigration (i )Immigration (i ) Emigration (e )Emigration (e ) What Causes Populations to Change in Size")
22
Migration Migration: Emigration: movement out of an area Immigration: movement into an area Net migration is the number of immigrants minus emigrants

24
Pressures of Changing Population Trends Infrastructure: –The basic facilities and services that support a community. Rapid Growth Problems –Clean Water Sources –Burnable Fuel Availability –Land Use –Food Shortages

25
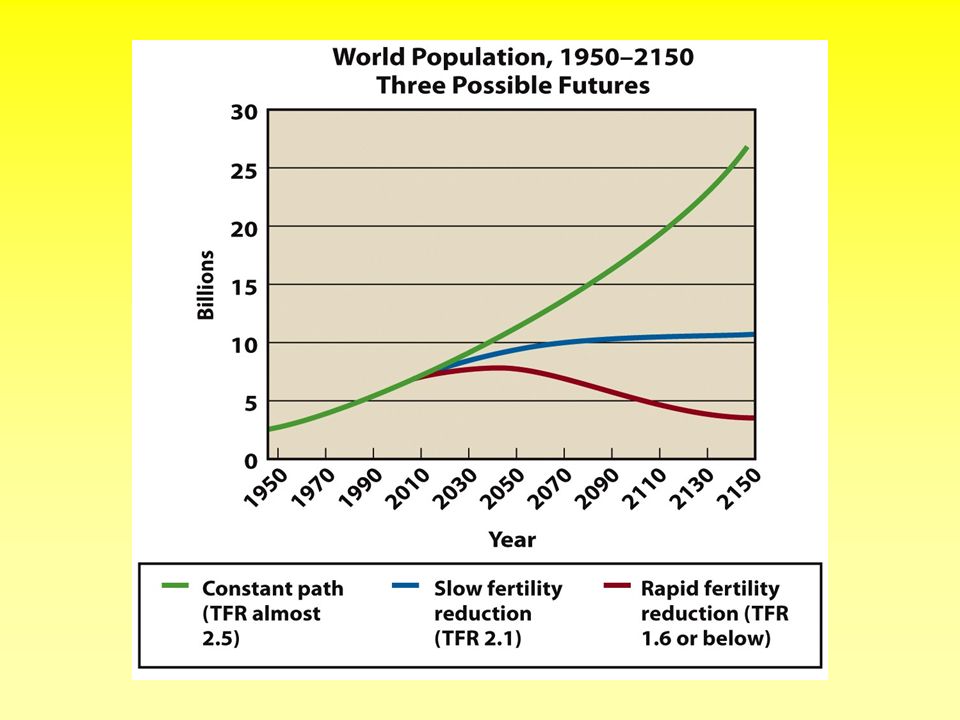
The world population is growing at a rate of about 1.2 per cent; if this rate continues, the population will double in 58 years. Unabated, such a rate would lead to a point about 2000 years hence when the mass of humanity would weigh more, and be larger, than the Earth. However, the growth rate is decreasing see the chart to the right. WHY?

26
Effects of Population Decline As % of 60+ aged people increases, population begins to decline 60+ population increase severe economic & social problems because 60+ consume: –more medical care –Social Security –costly public services Labor shortages require automation & immigration! Tracking the baby-boom generation in the United States

27
Influencing Population Size Most countries restrict immigration –Canada, Australia, U.S. - most immigration Involuntary immigration results from –armed conflict –environmental degradation –natural disaster --> environmental refugees ~1% of developing nations pop. Emigrates Migration from rural to urban areas

28
–Nation With Best Known Population Control Program –China has the highest population in the world, encompassing 1.2 billion or 21% of the world's population. –Projected growth of China's population is estimated to be around 1.5 billion by the year 2025 1. Reasons Chinese Government Initiated Population Control Measures: a.Freshwater & food at a premium for nation’s population b.Country experiencing population momentum 2. Government Perks/Coercive Measures for Citizen Compliance a.Free education & health care b.Increased personal and family incomes c.Increased legal marrying age for women d.Contraceptives, abortions, and sterilizations free of charge e.Preferential housing & retirement income China’s Program

29
Case Studies - China Family planning efforts began in 1970; TFR (Total Fertility Rate) fell from 5.7 to 1.8; infant mortality & illiteracy rates 1/3 to 1/2 of India’s rates Population control program is extensive, intrusive and strict: –postpone childbearing –only one child/family -->benefits –effect b/c China is dictatorship; limited resources would have mean disaster
 fell from 5.7 to 1.8; infant mortality & illiteracy rates 1/3 to 1/2 of India’s rates Population control program is extensive, intrusive and strict: –postpone childbearing –only one child/family -->benefits –effect b/c China is dictatorship; limited resources would have mean disaster")
30
Case Studies - India Family planning efforts began in 1952; fertility rate declined from 5.3 to 3.4 but population grow is still exponential -1.9% Disappointing results due to: –poor planning –bureaucratic inefficiency –low status of women –extreme poverty –lack of administrative & financial support

32
What is the Carrying Capacity of the Earth? While it might be attractive for us to give a definitive number for the carrying capacity of Earth, it simply isn't possible. For example, if you used the "immortal tiger" model which has humans still working as hunter-gatherers, only 100 million humans could be supported by the Earth. However, if you assumed that every possible square kilometer of Earth's arable land was farmed to maximum efficiency and we all crammed together in huge cities, we could have support as many as 30 billion people - 5 times as many as are living now - or more. This is known as the "ant farm" model.

Similar presentations

 G. Tyler Miller’s.>")


