Download presentation
Presentation is loading. Please wait.

1
AN ODYSSEY TO SUSTAINABILITY: THE URBAN ARCHIPELAGO OF INDIA B. Sudhakara Reddy Indira Gandhi Institute of Development Research Mumbai, India We can not solve the problems that we have created with the same thinking that created them --Albert Einstein

2
Rural We We Associated with traditions, superstitions, agriculture, and lower technology Associated with traditions, superstitions, agriculture, and lower technology In rural economy risks are associated with nature (e.g., Plague, famine, earth quakes) In rural economy risks are associated with nature (e.g., Plague, famine, earth quakes) Personalised, local and visible Personalised, local and visible Consequences can be addressed and overcome Consequences can be addressed and overcome Helplessness Helplessness Driving force – I am hungry Driving force – I am hungry Scarcity (community need) Scarcity (community need)Urban I Associated with market economy. Complex, largely self-organizing, show extraordinary resilience Risks are the consequences of human activity (e.g., Ecological risks) Risks are the consequences of human activity (e.g., Ecological risks) Globalised and can not be easily containable. Globalised and can not be easily containable. No time/place limit, not accountable, compensated or insured Blind and deaf to consequences and dangers social distance Driving Force – I am afraid Driving Force – I am afraid Insecurity (Individual anxiety) Rural Vs. Urban societies Urban society differs from rural in terms of acts, attitudes, and behaviors
 Risks are the consequences of human activity (e.g., Ecological risks) Globalised and can not be easily containable. Globalised and can not be easily containable. No time/place limit, not accountable, compensated or insured Blind and deaf to consequences and dangers social distance Driving Force – I am afraid Driving Force – I am afraid Insecurity (Individual anxiety) Rural Vs. Urban societies Urban society differs from rural in terms of acts, attitudes, and behaviors.")
3
Urban Scenario: Developed vs. Developing Countries Developed Countries Megacities have long been large cities and the growth has been much more slow and regular Megacities have long been large cities and the growth has been much more slow and regular Enthusiasm among planners to protect natural environment Enthusiasm among planners to protect natural environment Focus on public transport Focus on public transport Goals of economic growth, equity and employment generation Goals of economic growth, equity and employment generation Believe in science and the domination of religion decreases, give importance to arts and aesthetics Believe in science and the domination of religion decreases, give importance to arts and aesthetics Urbanites are aware of being citizen and take role in community activities Urbanites are aware of being citizen and take role in community activities Developing Countries Explosion of megacities results from population growth as well as the process of migration (economic as well as sociological reasons) Tendency to promote development at the cost of natural destruction Focus on private transport “Growth vs. envt." dichotomy collapses under the "economy" banner often differing interests of workers, corporations, and the general public Irrational behaviors, conservatism, traditions, can be seen in cities easily. Participation into constructive activities is limited. Cities in Developed countries are smarter, greener and healthier. The opposite is true for the cities of Developing countries
 Tendency to promote development at the cost of natural destruction Focus on private transport Growth vs. envt. dichotomy collapses under the economy banner often differing interests of workers, corporations, and the general public Irrational behaviors, conservatism, traditions, can be seen in cities easily. Participation into constructive activities is limited. Cities in Developed countries are smarter, greener and healthier. The opposite is true for the cities of Developing countries.")
4
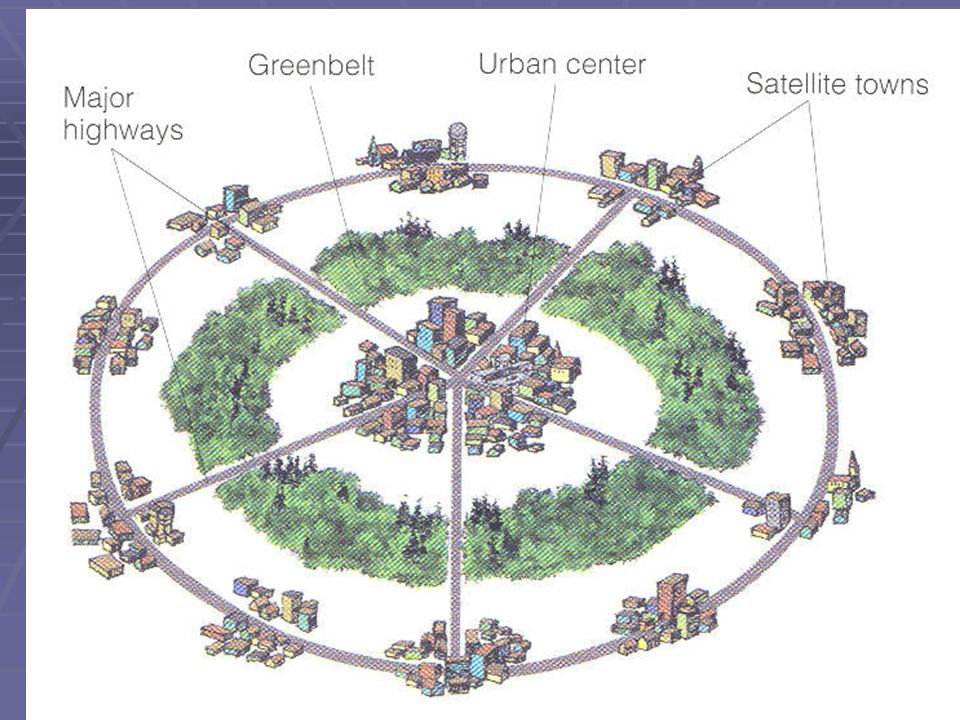
Urban Transitions Urban society becomes an issue and a problem to itself and act to change itself Agriculture Labour intensive Community Urbanization From the center to the outskirts, cities get wider and wider as rings Center ring Second ring Third ring Later suburb rings takes place Urbanization and modernization is a linear and western way of development. American type of urbanisation became the main development road for the developing countries. Industry and service sector Technology intensive Society Geographical enlargement, rise of population density, and improvement of transportation, communication and other infrastructure facilities. Business and trade centers Lower class people, criminals, working class, lower quality buildings and cheaper dwellings Neighbourhoods of middle class

5
Planner's Trilemma Social System (Equity, opportunity and equality) Economic System (Growth and Efficiency) Environmental System (environmental protection) Property Conflict Development Conflict Resource Conflict Urban sustainability Distribution of Resources Production and Consumption Resources and wastes Three conflicting interests: to "grow" the economy, “distribute” this growth fairly, and in the process “not degrade” the ecosystem
 Economic System (Growth and Efficiency) Environmental System (environmental protection) Property Conflict Development Conflict Resource Conflict Urban sustainability Distribution of Resources Production and Consumption Resources and wastes Three conflicting interests: to grow the economy, distribute this growth fairly, and in the process not degrade the ecosystem")
6
City Characteristics jj City size 1950198020052015 Mega cities LUAs Mega cities LUAs Mega cities LUAs Mega cities LUAs World cities 2852620492259 Population (million)23.658.481240292488358615 % of urban population3.284.713.89.215.49.316 % of total population0.92.31.85.44.57.658.6 Cities (Developed countries) 26210514616 Population (million)23.64844.210.7.288147101163 % of urban population5.511.35.914.39.716.210.617.2 % of total population2.95.94.19.97.312.28.213.3 Cities (Developing countries) 231615351643 Population (million) 10.437133204341257452 % of urban population 3.43.713.49158.915.6 % of total population 0.61.143.96.54.37.6 Cities (Least Developed countries) 1214 Population (million) 12.618.317.937.2 % of urban population 6.18.85.711.8 % of total population 1.72.51.93.9 Megacities and large urban Agglomerations (1950-2015)
 % of urban population % of total population Cities (Developed countries) Population (million) % of urban population % of total population Cities (Developing countries) Population (million) % of urban population % of total population Cities (Least Developed countries) 1214 Population (million) % of urban population % of total population Megacities and large urban Agglomerations ( )")
7
Megacities (>10 million inhabitants)
")
8
Urbanisation Scenario in India

9
No. of Class-I Cities(> 1 million) : 58 (2015) % of Urban Population : 35% % of total population : 12% Mega Cities and Urban Agglomerations
 : 58 (2015) % of Urban Population : 35% % of total population : 12% Mega Cities and Urban Agglomerations.")
10
Mega Cities and Urban Agglomerations (2015) CategoryCity Mega - 10 Million+ (3) Delhi, Greater Mumbai, Kolkata, Large - 5 – 10 Million (6)Chennai, Bangalore, Hyderabad, Ahmedabad, Pune, Surat Medium - 3 - 5 Million (3) Kanpur, Jaipur, Lucknow Small - 1 – 3 Million (46)Nagpur, Patna, Indore, Vadodara, Bhopal, Coimbatore, Ludhiana, Kochi, Visakhapatnam, Agra, Varanasi, Madurai, Meerut, Nashik, Jabalpur, Jamshedpur, Asansol, Dhanbad, Faridabad, Allahabad, Amritsar, Vijayawada, Rajkot
 CategoryCity Mega - 10 Million+ (3) Delhi, Greater Mumbai, Kolkata, Large - 5 – 10 Million (6)Chennai, Bangalore, Hyderabad, Ahmedabad, Pune, Surat Medium Million (3) Kanpur, Jaipur, Lucknow Small - 1 – 3 Million (46)Nagpur, Patna, Indore, Vadodara, Bhopal, Coimbatore, Ludhiana, Kochi, Visakhapatnam, Agra, Varanasi, Madurai, Meerut, Nashik, Jabalpur, Jamshedpur, Asansol, Dhanbad, Faridabad, Allahabad, Amritsar, Vijayawada, Rajkot")
11
Urban Growth and Sustainability Five major trends (i)Proportion of global population living in urban areas is increasing (ii) Number and size of urban areas in Asia, in particular, in China and India, are mushrooming Megacities, hypercities Megacities, hypercities (iii) Increase in resource use and wastes (iii) Increase in resource use and wastes (iv) Asymmetric patterns (Urban and rural, and in urban different income groups) (iv) Asymmetric patterns (Urban and rural, and in urban different income groups) (v) Poverty is becoming urbanized ( Cities don’t make people poor; they attract poor people) (v) Poverty is becoming urbanized ( Cities don’t make people poor; they attract poor people)
Proportion of global population living in urban areas is increasing (ii) Number and size of urban areas in Asia, in particular, in China and India, are mushrooming Megacities, hypercities Megacities, hypercities (iii) Increase in resource use and wastes (iii) Increase in resource use and wastes (iv) Asymmetric patterns (Urban and rural, and in urban different income groups) (iv) Asymmetric patterns (Urban and rural, and in urban different income groups) (v) Poverty is becoming urbanized ( Cities don’t make people poor; they attract poor people) (v) Poverty is becoming urbanized ( Cities don’t make people poor; they attract poor people)")
12
The explosion of megacities ● Natural increase (birth rates higher than death rates) ● Migration Push factors Pull factors Pull factors Expanding city limits Shifting economic activity to cities: Industrial protection, cheap credit, and subsidized local services ● The largest city/national capital is becoming a megacity ● High proportion of urban budget for capital city ● Land uses are not separated well because growth has been fast and planning controls are weak. ● Setting up of an un-authorised home is easy ● Based on the notion that urban growth can reduce poverty and can finance rural regions

13
Characteristics of Megacities Colonial heritage Colonial heritage Citadels and Ghettos Citadels and Ghettos So near but so far So near but so far Individuals and groups with wealth & power influence decisions that affect urban populations Individuals and groups with wealth & power influence decisions that affect urban populations Deficient supply of affordable housing and infrastructure Deficient supply of affordable housing and infrastructure Broken link between urban regions and rural hinterland Broken link between urban regions and rural hinterland Informal Employment Informal Employment Client-Patron Relationship Client-Patron Relationship Higher levels of congestion and environmental degradation Higher levels of congestion and environmental degradation Multiple jurisdictions in metropolitan regions with cross-cutting issues Multiple jurisdictions in metropolitan regions with cross-cutting issues Mismatch between location of people & location of jobs Mismatch between location of people & location of jobs Weakened civic leadership Weakened civic leadership Future ? – Let the future worry about the future

14
Keys To Growth or Scars On Earth? Need to study Urban Sustainability + Efficiency and competitiveness - Cities are extremely efficient and competitive + Economic growth engines - Industries and service providers + Access - education, health, social services and cultural activities + Social integration - People of many castes and religions live and work together Economic Concerns Economic Concerns - Explosive population growth due to migration – go forth and multiply - resulting in Alarming increases in the concentration of poor and jobless Massive infrastructure deficits in the delivery of services Massive infrastructure deficits in the delivery of services Pressure on land and housing - Environmental concerns Energy – High consuming life style, no matter what the consequences Energy – High consuming life style, no matter what the consequences Waste - Inefficient use resulting in waste Waste - Inefficient use resulting in waste Social concerns Social concerns Planning - No equity Planning - No equity Happiness – Focus on accumulating material possessions Relationships –Only money matters; No kinship that often ensures physical safety, food security, and the availability of child care areas Relationships –Only money matters; No kinship that often ensures physical safety, food security, and the availability of child care areas

15
Objectives and Methodology Main aim: Investigate whether the present pattern of urban development in India is sustainable. Methodology (i) Identification of 10 Indian cities (ii) Identifying and quantifying indicators (iii) Determining indicator dimensions (iv) Benchmarking sustainable indicator-base and threshold values (maximum and minimum) for the prioritized indicators (v) Developing composite Urban Sustainability Index (category-wise and dimension-wise) Importance of Indicators Indicators turn data into relevant information for policy makers and help in decision-making Easily understood by stakeholders; Related to the interests of various stakeholders; Measurable using the available data at city and national levels; and Clearly related to urban policy goals and capable of being changed
 Identification of 10 Indian cities (ii) Identifying and quantifying indicators (iii) Determining indicator dimensions (iv) Benchmarking sustainable indicator-base and threshold values (maximum and minimum) for the prioritized indicators (v) Developing composite Urban Sustainability Index (category-wise and dimension-wise) Importance of Indicators Indicators turn data into relevant information for policy makers and help in decision-making Easily understood by stakeholders; Related to the interests of various stakeholders; Measurable using the available data at city and national levels; and Clearly related to urban policy goals and capable of being changed.")
16
Society EnvironmentEconomy Institutions Energy and matter Waste and emissions Impacts on people’s health and well-being Urban System Ecological Support Systems SourcesSinks Food Housing Services Products Food Housing Services Products

17
Sustainability Dimensions and Indicators Economic Sustainability – Economic Sustainability – Capture the current as well as the dynamic economic strength of an urban system Income, Consumption, Infrastructure and Services Social Sustainability Social Sustainability – Map the extent of equitable distribution of the benefits of economic development to the people. Demographics, Education, Health, Equity, Poverty, Housing, Access to basic needs Environmental Sustainability – Environmental Sustainability – Assess the conformation of the economic development to the environmental standards Pollution (Air, water and soil), Urban green spaces, Land use pattern Institutional/Governance Sustainability – Institutional/Governance Sustainability – Measure the extent and effectiveness of institutions in creating opportunities Planning and design, Capacities and resources, Citizens’ participation, Ease of process in Govt. services
, Urban green spaces, Land use pattern Institutional/Governance Sustainability – Institutional/Governance Sustainability – Measure the extent and effectiveness of institutions in creating opportunities Planning and design, Capacities and resources, Citizens’ participation, Ease of process in Govt. services.")
18
URBAN SUSTAINABILITY Economic Social Environmental Institution/ Governance Growth Consumption Infrastructure transportation Demographics Education Health Equity Access to basic needs Global Climate Change Air, water and soil pollution Urban greenspace Land use Pattern Planning and design Capacity and resources Citizen’s participation Ease of Process in Govt. service Urban Sustainability Framework DIMENSION Indicator

19
Developing SDI Developing SDI Selection Dimension Judging Normalisation Sub-indices Positive effect InstitutionalEnvironmental Economic Social Sustainability Indicators Negative Effect Normalised Indicators InstitutionalEnvironmental SocialEconomic Composite Sustainability Index

20
Matrix for adopting indicators Available To be used To be modified To be identified To be ignored Potentially Available To be used To be modified To be identified To be ignored Related data Available To be modified To be identified To be ignored Not Available To be ignored Relevance Data availability Relevant Related Indicator Relevant But missing Irrelevant

21
Model

22
City Characteristics City Area (sq.km) Population (million) Population density (Persons/sq.km) Income (US$ ppp) Population class Income class Delhi 129514.511197 9982 11 Mumbai 62114.323027 6326 22 Kolkata 53113.518467 3744 38 Bangalore 5348.4415805 5102 44 Chennai 4147.3617780 4797 55 Hyderabad 5836.7511492 4534 66 Ahmedabad 4666.7214421 4192 77 Pune 7003.745343 6277 83 Lucknow 9763.363443 3158 99 Patna 9432.042163 2540 10 City Characteristics
 Population (million) Population density (Persons/sq.km) Income (US$ ppp) Population class Income class Delhi Mumbai Kolkata Bangalore Chennai Hyderabad Ahmedabad Pune Lucknow Patna City Characteristics")
23
Economic Indicators CategoryIndicators of Urban SustainabilityUnit Contribution Income Per capita incomeUS$/year + ve City GDP growth rate% +ve City product as a % of country’s GDP% +ve Local purchasing power Index +ve Consumer price indexCPI -ve Employment Share of organised employment% +ve Unemployment rate (%)% -ve Employment growth rate% +ve Consumption Per capita water supply (litres)litres/day +ve Per capita water consumption (l/day) +ve Per capita electricity consumption (kWh)kWh/annum +ve Per capita energy consumption (GJ)GJ/annum +ve Per capita food consumption (kg)kg/day +ve Energy intensity (consumption per $ GDP)MJ/$. -ve Infrastructure and urban services Road length km/1000 pop. +ve Hospitals/100,000 population +ve Bank branches No./100,000 pop. +ve No. of telephones landlines per 100,000 popNo./100,000 pop. +ve share of HH with internet connections % +ve HH with access to telephones (Landline) % +ve Transport Public bus transport seats Per 1000 pop. +ve Para-Public (Auto, Taxi, Maxicabs) transport seats Per 1000 pop. +ve Passenger carrying capacity Per 1000 pop. +ve Cars Per 1000 pop. +ve Two-wheelers Per 1000 pop. +ve Non-motorized transport % +ve Transport fuel consumption GJ/capita/year +ve Proportion of total motorised road PKM by public transport% +ve Automobile ownership No/family +ve Share of public transportation (bus, metro, suburban trains % +ve Pedestrians killed (no/million/year) % -ve
 % +ve Transport Public bus transport seats Per 1000 pop. +ve Para-Public (Auto, Taxi, Maxicabs) transport seats Per 1000 pop. +ve Passenger carrying capacity Per 1000 pop. +ve Cars Per 1000 pop. +ve Two-wheelers Per 1000 pop. +ve Non-motorized transport % +ve Transport fuel consumption GJ/capita/year +ve Proportion of total motorised road PKM by public transport% +ve Automobile ownership No/family +ve Share of public transportation (bus, metro, suburban trains % +ve Pedestrians killed (no/million/year) % -ve.")
24
City Characteristics Social Indicators CategoryIndicatorUnitContribution Demographics City populationMillion -ve Population growth rate%/annum -ve Population densityPersons/sq.km -ve Population that are children% +ve Gender ratioFemales/1000 males +ve Child sex ratio +ve Average household sizeNo -ve Slum population% of total -ve Migration rate%/annum -ve Education CollegesPer 100,000 pop. +ve SchoolsPer 1000 pop. +ve Literacy rate% +ve Male literacy %+ve Female literacy %+ve School enrolment rate(%) +ve Health Number of hospital bedsPer 10,000 pop. +ve Number of physiciansPer 10,000 pop. +ve Life expectancy at birthYears +ve Maternal mortality ratePer 100,000 pop -ve Birth rateBirths/1,000 pop. -ve Death ratePer 1000 pop. -ve Infant mortalityNo/1000 -ve Equity Income distribution% -ve HH below poverty line% -ve Population with pucca houses% +ve Basic services HH access to water% +ve HH access to sanitation% +ve Number of housesNo. /1000 pop. +ve HH with piped water connection% +ve HHs with electricity connection(%) +ve HH with LPG connection % +ve Poverty Poor with piped water %+ve Poor with sanitation facility% +ve Poor HH with electricity% +ve Poor with having a dwelling% +ve Safety Number of police officersPer 100,000 pop. +ve Crime rateper 100000 pop. -ve
 +ve Health Number of hospital bedsPer 10,000 pop. +ve Number of physiciansPer 10,000 pop. +ve Life expectancy at birthYears +ve Maternal mortality ratePer 100,000 pop -ve Birth rateBirths/1,000 pop. -ve Death ratePer 1000 pop. -ve Infant mortalityNo/1000 -ve Equity Income distribution% -ve HH below poverty line% -ve Population with pucca houses% +ve Basic services HH access to water% +ve HH access to sanitation% +ve Number of housesNo. /1000 pop. +ve HH with piped water connection% +ve HHs with electricity connection(%) +ve HH with LPG connection % +ve Poverty Poor with piped water %+ve Poor with sanitation facility% +ve Poor HH with electricity% +ve Poor with having a dwelling% +ve Safety Number of police officersPer 100,000 pop. +ve Crime rateper pop. -ve.")
25
City Characteristics Environment indicators CategoryIndicatorUnitContribution Global Climate Change CO 2 Emissions per person Tonne/capita -ve GHG emission/city GDP kg/US$ PPP -ve Renewable Energy in electricity generation% +ve Air Pollution SO 2 emissionsμg/m3 -ve NO 2 emissionμg/m3 -ve PM10 emissionμg/m3 -ve Soil pollutionSolid waste generation kg/cap/year -ve Solid waste that is recycled% +ve Dry waste capita kg/cap/day -ve Water pollutionShare of waste water treated % +ve Urban green spaces Green spacesm 2/ /person +ve

26
City Characteristics Institutional Indicators CategoryIndicatorUnitContribution Citizen participation Voter turnout % +ve Work participation % +ve Citizen participation in decision making Score+ve Quality of city system City competitiveness Score+ve Urban planning and design Score+ve Urban capacities and resources Score+ve Political representation Score+ve Ease of process in govt. services Score+ve

27
Indicator scores of 10 cities

28
Performance Assessment VGGAAVGAVGBAVGPOOR Economic Bangalore Delhi Ahmedabad Mumbai Chennai Hyderabad Pune Kolkata Lucknow Patna Social Ahmedabad Bangalore Chennai Pune Delhi Hyderabad Kolkata Mumbai Lucknow Patna Kolkata Lucknow Environment Ahmedabad Chennai Hyderabad Bangalore Mumbai Pune Patna Delhi Kolkata Lucknow Institutional Chennai Mumbai Ahmedabad Bangalore Delhi Hyderabad Pune Lucknow PatnaP VG = Very Good (> 0.8);, G = Good (0.65 – 0.8); AAVG = Above average (0.55 – 0.64) AVG = Average (0.45 – 0.54); BVG = Below average (0.3 – 0.44); Poor (< 0.3) VG = Very Good (> 0.8);, G = Good (0.65 – 0.8); AAVG = Above average (0.55 – 0.64) AVG = Average (0.45 – 0.54); BVG = Below average (0.3 – 0.44); Poor (< 0.3)
;, G = Good (0.65 – 0.8); AAVG = Above average (0.55 – 0.64) AVG = Average (0.45 – 0.54); BVG = Below average (0.3 – 0.44); Poor (< 0.3) VG = Very Good (> 0.8);, G = Good (0.65 – 0.8); AAVG = Above average (0.55 – 0.64) AVG = Average (0.45 – 0.54); BVG = Below average (0.3 – 0.44); Poor (< 0.3)")
29
City Sustainability Index

30
City Characteristics Sustainable Indices Dimension AhmedabadBangaloreChennaiDelhiHyderabadKolkataLucknowMumbaiPatnaPune Econ.0.460.450.390.460.390.360.370.450.360.39 Social0.700.680.690.64 0.620.590.620.570.68 Envt.0.630.600.620.550.620.540.570.520.560.55 Inst.0.400.340.430.390.360.370.310.430.240.31 CSI0.570.550.560.530.540.510.500.520.480.53

31
Unsustainable Urban regions: What Does It All Mean to Us Today? The most serious problems Destruction or losses of natural resources Ceiling on natural resources (Energy, photosynthetic ceiling) Significant waste generation Population issues (per-capita impact—the resources consumed, and the wastes put out) Migration - Young leave for cities for better opportunities (education and employment) resulting in a loss of entrepreneurship in rural areas All relate to the life style Affluenza: When Too Much is Never Enough
 Significant waste generation Population issues (per-capita impact—the resources consumed, and the wastes put out) Migration - Young leave for cities for better opportunities (education and employment) resulting in a loss of entrepreneurship in rural areas All relate to the life style Affluenza: When Too Much is Never Enough.")
32
Pathways to Sustainable Cities Institution Development - Formal and informal institutions and institutional entrepreneurships New planning paradigms and technology diffusion: Infrastructure for the sustainable provision of urban services (e.g., Mass transport) Behaviour change (Society interest vs. individual interest) : Where interventions can be identified to trigger among individuals to modify their patterns of resource consumption (e.g., incentives and disincentives) TransitionArena Institutional Development Technology/ Planning Behaviour change Rate of Change Slow ModerateFast Focus - planning not only for "green cities and growing cities" but also for "just cities."
 : Where interventions can be identified to trigger among individuals to modify their patterns of resource consumption (e.g., incentives and disincentives) TransitionArena Institutional Development Technology/ Planning Behaviour change Rate of Change Slow ModerateFast Focus - planning not only for green cities and growing cities but also for just cities. .")
33
Sustainability Time Technical Innovation Time Urban Planning Time Behaviour Change Horizon 1: 1- 3 years Capturing maximum potential from existing technologies (lighting, SWH, waste to energy, etc.) Horizon 2: 3- 5 years Required improved technologies, modified policy, governance, regulatory envt., etc. Horizon 3: 5-10 years Technologies that are radically from the existing ones, Overcome barriers. Horizon 1:Basic services Foot paths, parks, waste- water treatment, toilets, etc. Public participation in decision making Horizon 1: Awareness, knowledge, understanding (cleanliness, sanitation, rule of law, etc.) Horizon 2: Sectoral focus Technology/mode shift (personal to public, road to rail, non renewable to reenwable, etc. Horizon 2: Incentives and disincentives (using public transport, encourage walking or the use of small, low-speed, energy- efficient vehicles, taxing on land for actual use. Horizon 3: Institutions Development of new institutions, PPP mode. Make cities self- sustainable by growing food locally, recycling wastes etc.. Horizon 3: Responsibility, Tangible evidence of change in behaviour; participation in resolution of problems. Sustainability Transitions – Three Horizon Thinking
 Horizon 2: Sectoral focus Technology/mode shift (personal to public, road to rail, non renewable to reenwable, etc. Horizon 2: Incentives and disincentives (using public transport, encourage walking or the use of small, low-speed, energy- efficient vehicles, taxing on land for actual use. Horizon 3: Institutions Development of new institutions, PPP mode. Make cities self- sustainable by growing food locally, recycling wastes etc.. Horizon 3: Responsibility, Tangible evidence of change in behaviour; participation in resolution of problems. Sustainability Transitions – Three Horizon Thinking.")
34
Forces and Actors Political stability Rule of law, stable bureaucracy and financial markets S&T ῆ in Resource extraction and use Recycling of waste Social and economic conditions Access to clean envt. Population size, culture and values International Institutions (i)Funds for investment towards RETs (ii)Enforce multilateral envt. agreements (iii) Shape and enforce trade practices that harm or protect envt. Individuals (i)Demand basic needs at affordable prices (ii)Shape social norms for resource use (iii)Avoid product that damage envt. (iv)Use eco systems as places of recreation Government (i)Establish new institutions and encourage entrepreneurship (ii)Determine the resources to be taxed and subsidized (iii)Incentives and disincentives for conservation and over use (iv) Redistribute resources among various sections Business/Industry (i)Use ῆ technologies and reduce energy intensity (ii)Drive innovation (iii)Determine which goods/services are produced and how (envt. friendly or detrimental) Voice Right to express opinion, information access, organise and take part in decision making
Funds for investment towards RETs (ii)Enforce multilateral envt. agreements (iii) Shape and enforce trade practices that harm or protect envt. Individuals (i)Demand basic needs at affordable prices (ii)Shape social norms for resource use (iii)Avoid product that damage envt. (iv)Use eco systems as places of recreation Government (i)Establish new institutions and encourage entrepreneurship (ii)Determine the resources to be taxed and subsidized (iii)Incentives and disincentives for conservation and over use (iv) Redistribute resources among various sections Business/Industry (i)Use ῆ technologies and reduce energy intensity (ii)Drive innovation (iii)Determine which goods/services are produced and how (envt. friendly or detrimental) Voice Right to express opinion, information access, organise and take part in decision making.")
35
Sustainable Urban Development – The three Pillars Provide conditions of spatial design Limitations of system design Development of Participation Building Capacity envt. consciousness In planning in Envt. Education Hard ware (Economic Growth - Urban structure, Land use) Soft ware (Social Equity- Regulation, Leadership) Heart ware (Environmental awareness- Resource conservation, ethics) collaboration of citizens, enterprises and public administration Adopted from Sachihiko Harashina
 Soft ware (Social Equity- Regulation, Leadership) Heart ware (Environmental awareness- Resource conservation, ethics) collaboration of citizens, enterprises and public administration Adopted from Sachihiko Harashina.")
36
A New Beginning Economic sustainability-productive use for the long-term benefit of the community, without damaging or depleting the natural resource base Social sustainability - inclusiveness of all stakeholders Environmental sustainability - carrying capacity Institutional sustainability - quality of governance Link Urban sustainability with rural sustainability (Need for a mutually supporting life systems) Most important – Change in the attitude - Retaining the traditional values and the living standards. Billions of people are going to make their homes in cities over the next few decades — many in megacities and in slums where devastating poverty persists. We are going to spend tens, if not hundreds, of trillions on city building ( Indian Govt. initiated a smart city programme to spend $16 billion in the next 5 years). It is crucial that we get it right.
. It is crucial that we get it right..")
37
1954 – one cookbook, 2000 an entire library 1954 – simple equipment, 2000 a whole battery of machines

38
The Sunday dinner: 1954 a feast; 2000 MacDonalds!

39
In circles?

40
Think Q & A Q & A

41
Economic Indicators Categories of Sustainability Indicators of Urban SustainabilityUnit Max.Min. Ahme dabad Banga lore Chenn aiDelhi Hyderab adKolkata Luckn ow Mumbai PatnaPune Income Per capita incomeUS$/year 42,2572,0044,1924,1024,7979,9825,53437443,1586,3262,5406,277 City GDPUS$.billion 1479 10 50.8836515052901416810.448 City GDP growth rate% 13.3 1.1 10.18.36.28.46.85.34.58.55.67.4 City product as a % of country’s GDP% 35.730.401.402.291.794.131.432.480.394.630.291.32 Employment Consumer price indexCPI 191.15 21.5 27.6828.8427.3530.22626.8127.2137.3324.8328.18 Share of organised employment% 80 15 51.53132.229.2026.53222.3181932.8 Unemployment rate (%)% 50 4.2 14.71514.615.515.920.425.51723.214.5 Employment growth rate% 7.2 -5 0.86.121-4-0.8-0.040.152.9-0.5-0.6 Consumption Water supplyl/d/cap 52753.195129701899611685208125115 Water consumption l/d/cap 450458085588178120761309694 Electricity consumptionkWh/y/cap 17619352182815761379188813241104108616006951552 Energy consumptionGJ/y/cap 9005.21817.1916.121.215.512.211.515.149.115.5 Food consumption (kg)kg/d/cap 1.90.650.90.870.970.931.331.171.41.411.41.2 Energy intensity of GDPMJ/$. 14.80.622.201.682.152.30 1.91 1.661.751.61 Infrastructure and urban services Road length km/1000 pop. 12.30.040.170.650.612.40.200.110.150.1020.130.25 Hospitals/100,000 population 74.40.26.313.45.911.64.62.9112.10.81.1 Bank branches/100,000 pop. 95.873.1411.41724.915.1168.847.93.610.4 No. of telephones landlines per 100,000 pop. 28000350960010,8234780145005600280047301297327006540 share of HH with internet connections 100237.1045.6851.7249.0861.0431.2111.665.2215.240.0 Share of HH with access to telephones (Landline) 1001248.0024.123.9072.5028.0014.0023.6538.213.5032.70 Transport Public bus transport seats (per 1000 population) 205 6 105.635138.184.136.333.64438.27261.1 Para-Public (Auto, Taxi, transport seats (per 1000 population) 265 5.6 30.535.259.43037.712.519.115.611.335 Passenger carrying capacity per 1000 population 740 90 354393335678333196231198215314 Cars per 1000 population 587.1 9.5 284756.68626.225.51826.511.519.7 Two-wheelers per 1000 population 258 12 171.3258219188157.329.1201.249.120.6130.9 Share of non-motorized transport (including walking) 65 8.1 27382835304249335131 Share of walking (%) 92 6 1934221926 35273825 Transport fuel consumption (GJ/capita/year) 60.8 0.72 2.032.781.73.411.60.651.10.9212.34 Proportion of total motorised road PKM on public transport (%) 902.971.872.27674.26184.570.165.567.877.6 Automobile ownership (no/family) 2 0.1 1.011.71.391.410.940.281.170.360.540.77 Superior public transportation network (metro, suburban trains, etc.) 1 0 0.030.020.110.080.040.020.010.170.010.03 Pedestrians killed (no/million/year) Delhi/StockhomDelhi/Stockhom 130 9 358978130483229192874
% Employment growth rate% Consumption Water supplyl/d/cap Water consumption l/d/cap Electricity consumptionkWh/y/cap Energy consumptionGJ/y/cap Food consumption (kg)kg/d/cap Energy intensity of GDPMJ/$ Infrastructure and urban services Road length km/1000 pop Hospitals/100,000 population Bank branches/100,000 pop No. of telephones landlines per 100,000 pop , share of HH with internet connections Share of HH with access to telephones (Landline) Transport Public bus transport seats (per 1000 population) Para-Public (Auto, Taxi, transport seats (per 1000 population) Passenger carrying capacity per 1000 population Cars per 1000 population Two-wheelers per 1000 population Share of non-motorized transport (including walking) Share of walking (%) Transport fuel consumption (GJ/capita/year) Proportion of total motorised road PKM on public transport (%) Automobile ownership (no/family) Superior public transportation network (metro, suburban trains, etc.) Pedestrians killed (no/million/year) Delhi/StockhomDelhi/Stockhom")
42
Social Indicators Category Indicators of Urban Sustainability Max.Min. Ahmedabad Bangalore ChennaiDelhi Hydera badKolkataLucknow Mumbai PatnaPune Demographics City population (million) 350.0766.28.18.716.37.714.12.3218.425 Population growth rate (%/annum) 11.40.292.43.251.683.42.21.742.542.33.73.1 Population density (persons/sq.km) 111002180021000109312670210984739324252336715646180313908 % of population that are children 15 5 11.210.318.9411.7610.466.6911.378.3413.111.6 Gender ratio (Females/1000 males) 1176 734 945922986875945899915810882897 Child sex ratio 980 840 848941964866938930905910883892 Average household size (no) 6.8 2 4.733.244.024.94.644.395.264.55.854.19 Slum population (% of total) 45 0 4.11028.8110.0431.21244.13.112 Migration rate (%/annum) 20 0.1 2.913.43.55.82.52.8 4.32.74.5 Education Colleges/100,000 eligible population 563.220.121.2115.813.421.76.45108.59.533 Schools/1000 population 0.9550.050.350.5210.240.3080.390.180.080.2250.120.28 Literacy rate (%) 100 48 89.688.4890.1886.383.287.1477.390.970.791.6 Male literacy 100 60 9491.8293.7918789.0882.694.978.595.1 Female literacy 100 45 84.8 86.680.979.484.172.586.96288 School enrollment rate (No) 100 45 969792 98937595.258098 Health Number of hospital beds per 10,000 population 13732640393464171124842 Number of physicians per 10,000 population 42319251624.8218915.21220 Life expectancy at birth (years) 83.7548.6966.570817367.271.3607167.170.5 Maternal mortality rate (per 100,000 pop) 540258245425157532196315056 Birth rate (births/1,000 population) 50.066.8521.22712.321.721.525.528.513.829.212.6 Death rate 17.231.555.55.43.84.64.86.3 6.95.66 Infant mortality (no/1000) 75.27 2.65 6431284135497134.66235 Equity Income distribution [GINI Coefficient] 0.75 0.22 0.310.380.330.35 0.380.320.350.320.34 Households below poverty line (%) 70 3.8 5.4 18 1714131430.42035.714.5 % of HH access to water 100 40 99 99.2 7885988096.198.48597 % of HH access to sanitation 100 25 87.1 53 90633371.647.44249.276 Number of houses/1000 population 420 154 206.1317235205219.2291.6171.2237157.2228.5 Share of population with pucca houses 1003075.686181.9055.5680.1066.8865.124859.0078.00 % of HH having piped water connection 100269379.006556.543.272.480.56983.688.3 Households with electricity connection (%) 10086.398.498.69587.192.296.291.29890.398 Basic services HH with LPG connection (%) 1002674.375.982.390.365.964.759.66557.582.6 Population with access to sanitation (%) 1001287.194.8290633371.677.44979.276 Poverty % of poor with piped water 1000949189869270 907396 % of poor with sanitation facility 100084929095769482807175 % of poor households with electricity 100099989799988288978198.5 % of poor with LPG connection 1000402425302518925430 Safety Number of police officers per 100,000 population 55855115283160513155788214064125 Crime rate per 100000 population 1508643263181231220228110444440455272
 Population growth rate (%/annum) Population density (persons/sq.km) % of population that are children Gender ratio (Females/1000 males) Child sex ratio Average household size (no) Slum population (% of total) Migration rate (%/annum) Education Colleges/100,000 eligible population Schools/1000 population Literacy rate (%) Male literacy Female literacy School enrollment rate (No) Health Number of hospital beds per 10,000 population Number of physicians per 10,000 population Life expectancy at birth (years) Maternal mortality rate (per 100,000 pop) Birth rate (births/1,000 population) Death rate Infant mortality (no/1000) Equity Income distribution [GINI Coefficient] Households below poverty line (%) % of HH access to water % of HH access to sanitation Number of houses/1000 population Share of population with pucca houses % of HH having piped water connection Households with electricity connection (%) Basic services HH with LPG connection (%) Population with access to sanitation (%) Poverty % of poor with piped water % of poor with sanitation facility % of poor households with electricity % of poor with LPG connection Safety Number of police officers per 100,000 population Crime rate per population")
43
Environment Indicators Categories of Sustainability Indicators of Urban Sustainability Unit Maxim um Minim um Ahmed abad Bangal ore Chenn aiDelhi Hyder abad Kolkat a Luckno w Mumb ai PatnaPune Global Climate Change CO2 Emissions per person [tonne per capita] 9.7 0.5 1.21.30.9121.081.830.640.780.731.31 GHG emission/city GDP (kg/US$ PPP) 0.690240.050.130.120.060.100.180.100.17 0.08542 90.190.13 Share of Renewable Energy in electricity generation % 61114.652.00361.334.61514.52111.521 Air Pollution SO2 emissions (μg/m3) 90516182261312834726 NO2 emission (μg/m3) 1301224412255256224863642 PM10 emission (μg/m3) 260119612059259819820413213065 Soil pollution Percapita Solid waste (kg/cap/year) 995.6100135.05166.5165167.17154102114209135.05128 % of solid waste that is recycled 100811.722.516.315.521.611.515.516.712.616.7 Dry waste capita (kg/cap/day) 80.050.15170.820.25420.24750.30780.290.10340.270.1924 0.285 2 Water pollution Share of waste water treated (%) 100104442.4355539203067.62951 Urban green spaces Green spaces/person (m2) 166.30.562410.818.80.61.8146.61614
![Environment Indicators Categories of Sustainability Indicators of Urban Sustainability Unit Maxim um Minim um Ahmed abad Bangal ore Chenn aiDelhi Hyder abad Kolkat a Luckno w Mumb ai PatnaPune Global Climate Change CO2 Emissions per person [tonne per capita] GHG emission/city GDP (kg/US$ PPP) Share of Renewable Energy in electricity generation % Air Pollution SO2 emissions (μg/m3) NO2 emission (μg/m3) PM10 emission (μg/m3) Soil pollution Percapita Solid waste (kg/cap/year) % of solid waste that is recycled Dry waste capita (kg/cap/day) Water pollution Share of waste water treated (%) Urban green spaces Green spaces/person (m2)](http://images.slideplayer.com/35/10406319/slides/slide_43.jpg "Environment Indicators Categories of Sustainability Indicators of Urban Sustainability Unit Maxim um Minim um Ahmed abad Bangal ore Chenn aiDelhi Hyder abad Kolkat a Luckno w Mumb ai PatnaPune Global Climate Change CO2 Emissions per person [tonne per capita] GHG emission/city GDP (kg/US$ PPP) Share of Renewable Energy in electricity generation % Air Pollution SO2 emissions (μg/m3) NO2 emission (μg/m3) PM10 emission (μg/m3) Soil pollution Percapita Solid waste (kg/cap/year) % of solid waste that is recycled Dry waste capita (kg/cap/day) Water pollution Share of waste water treated (%) Urban green spaces Green spaces/person (m2)")
44
Institutional Indicators Categories of Sustainability Indicators of Urban Sustainability Unit Maxim um Minim um Ahme dabad Banga lore Chenn aiDelhi Hyder abad Kolkat a Luckn ow Mumb ai PatnaPune Quality of city system City competitiveness 100266361.162.369.761.861.534.567.838.559.9 Citizen participation Voter turnout (%) 953562566865.153.36153.025345.354.1 Work participation (%) 10024.529.237.834.337.734.537.622.839.320.240.8 Citizen participation 8.90.91.532.91.24.42.91.33.31.53.5 Governance Urban planning and design 8.80.52.52.92.23.92.94.20.82.60.73 Urban capacities and resources 9.90.62.50.92.22.92.121.42.71.62.8 Political representation 9.413.21.94.12.22.63.52.23.52.33.9 Ease of process in govt. services 9.50.24.52.931.52.82.51.12.31.22.2

Similar presentations


 increases, scarcities => prices rise => impact on European economy 20th cent.: 12-fold.>")


