Download presentation
Presentation is loading. Please wait.

1
Yayuk H. Mahendradhata Program Studi S1 Gizi Kesehatan FK – UGM

2
By the end of this lecture the reader should be able to: know the different methods for assessing the nutritional status understand the basic anthropometric techniques, applications, & reference standards

3
The nutritional status of an individual is often the result of many inter-related factors. It is influenced by food intake, quantity & quality, & physical health. The spectrum of nutritional status spread from obesity to severe malnutrition

4
Introduction Identifying nutritional problems of a population in a clear and measurable way will help to: Define needs, opportunities and constraints, and prioritize solutions. Evaluate programme impact and improve efficiency. Influence decision making in strategic planning, policy formulation and resource allocation. Raise community awareness and participation to maximize long-term impact.

5
To define the nutritional problem of the targeted population, it is necessary to measure its nutritional status. Introduction Nutritional status assessments enable to determine whether the individual is well- nourished or undernourished. ASSESSMENT of the nutritional situation in target population ASSESSMENT of the nutritional situation in target population ACTION based on the analysis & available resources ACTION based on the analysis & available resources Source: UNICEF, Triple-A Cycle ANALYSIS of the causes of the problem ANALYSIS of the causes of the problem

6
Nutrition is assessed by two types of methods; direct and indirect. The direct methods deal with the individual and measure objective criteria, while indirect methods use community health indices that reflects nutritional influences.

7
These are summarized as ABCD Anthropometric methods Biochemical, laboratory methods Clinical methods Dietary evaluation methods

8
These include three categories: Ecological variables including crop production Economic factors e.g. per capita income, population density & social habits Vital health statistics particularly infant & under 5 mortality & fertility index

9
It is an essential features of all nutritional surveys It is the simplest & most practical method of ascertaining the nutritional status of a group of individuals It utilizes a number of physical signs, (specific & non specific), that are known to be associated with malnutrition and deficiency of vitamins & micronutrients.
, that are known to be associated with malnutrition and deficiency of vitamins & micronutrients.")
10
ADVANTAGES Fast & Easy to perform Inexpensive Non-invasive LIMITATIONS Did not detect early cases

11
Thyroid gland in mountainous areas and far from sea places Goiter is a reliable sign of iodine deficiency.

12
Anthropometry is the measurement of body height, weight & proportions. It is an essential component of clinical examination of infants, children & pregnant women. It is used to evaluate both under & over nutrition. The measured values reflects the current nutritional status & don ’ t differentiate between acute & chronic changes.

13
Anthropometry It is precise and accurate; It uses standardized technique; It is suitable for large sample sizes, such as representative population samples; It does not require expensive equipment, and skills can be learnt quickly. Anthropometry is the most frequently used method to assess nutritional status.

14
Technique of measuring people Measure Index Indicator Reference Information

15
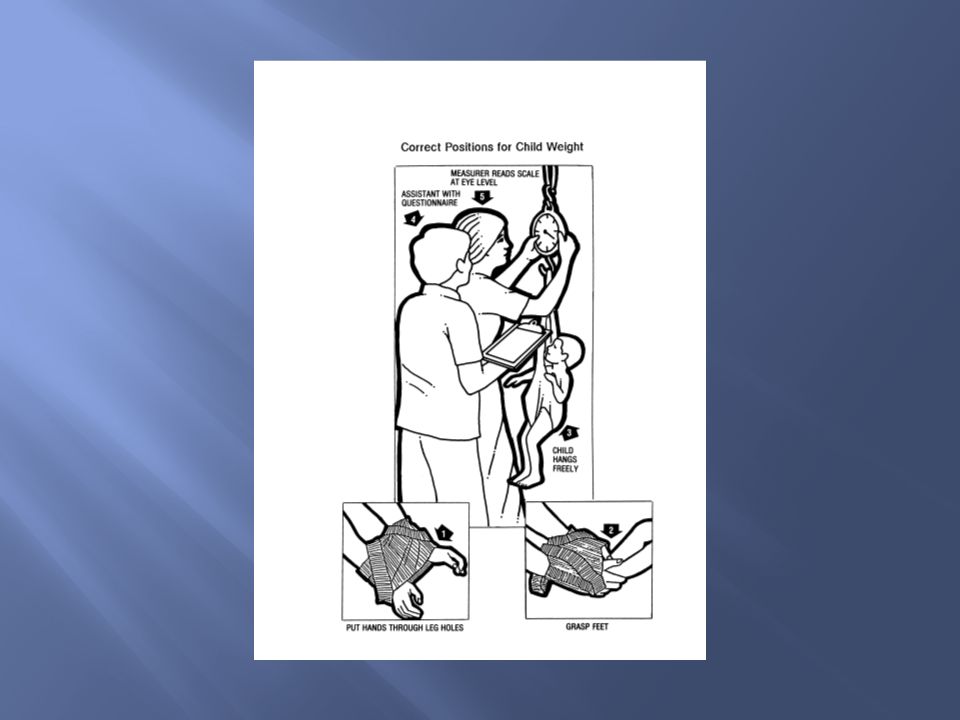
Weight Height Length and stature or height Mid Upper Arm Circumference MUAC Characteristics we need: easy cheap acceptable reproducible

16
Relation between two measurements weight for age W/A or W//A general appreciation of nutritional status height for age H/A or H//A measure of linear growth deficit or STUNTING weight for height/length W/H or W//H measure of weight deficit according to length WASTING

17
Sensitive to changes Changes in two directions up and down Fast change Usually easy to collect Standardisation of scales needed, calibration Small changes are difficult to measure: food intake of the child, urine, dehydration, temp, etc: not very specific can be difficult: co-operation of children

22
Difficult to measure, accuracy, large variations Differences are small: 24 cm increment in the first year of life, 11 cm second year, 8 third Low sensitivity Large measurement errors Measure to the nearest mm

27
Usually the most difficult and inaccurate measurement Less of a problem if a trend in the same child is measured, the mistake is repeated every time and thus cancels out

28
Accurate measurement of height and weight is essential. The results can then be used to evaluate the physical growth of the child. For growth monitoring the data are plotted on growth charts over a period of time that is enough to calculate growth velocity, which can then be compared to international standards

29
Body Mass Index (BMI) Waist to Hip Ratio (WHR) Circumference measures 29
 Waist to Hip Ratio (WHR) Circumference measures 29")
30
compares a person's weight and height usually used for adults (kids have BMI for age) does not actually measure the percentage of body fat, it is a useful tool to estimate a healthy body weight BMI = weight (kg)/height 2 (m) Normal 18.5 – 25.0 (over 30-obese, under 17-anorexia)
 does not actually measure the percentage of body fat, it is a useful tool to estimate a healthy body weight BMI = weight (kg)/height 2 (m) Normal 18.5 – 25.0 (over 30-obese, under 17-anorexia)")
31
Used in large population studies Measure of obesity Index of weight relative to height – Quetelet index (kg/m2) Overweight – 25.0 – 25.9 kg/m2 – obesity-related health problems increase beyond d a BMI of 25 kg/m2 Obesity - > 30 kg/m2
 Overweight – 25.0 – 25.9 kg/m2 – obesity-related health problems increase beyond d a BMI of 25 kg/m2 Obesity - > 30 kg/m2")
32
Easy to measure Difficult to interpret to patients – wt loss Not useful in athletic, muscled individuals Not a sensitive indicator of changes in body composition

33
Waist Circumference Waist circumference should be measured at a level midway between the lower rib margin and iliac crest with the tape all around the body in horizontal position. The tape measure should not cause compressions on the skin. There is an increased risk of metabolic complications for men with a waist circumference ≥102 cm, and women with a waist circumference ≥88.

34
Hip Circumference Hip circumference should be measured as the maximal circumference over the buttocks. Hip circumference measurement procedure Same as for waist circumference, except for tape position.

35
Regional fat distribution Type of obesity – Android obesity (upper body obesity) – apple – Gynoid obesity (lower body obesity) – pear Males vs Females Pattern of fat distribution – good predictor of health risks of obesity
 – apple – Gynoid obesity (lower body obesity) – pear Males vs Females Pattern of fat distribution – good predictor of health risks of obesity")
36
The waist-to-hip ratio is calculated by dividing the waist measure by the hip measure. The cut off point for cardiovascular risk factors is less than 0.85 for women and 0.90 for men. A higher number denotes more risk

37
37 Layers of subcutaneous fat are measured at different sites of body to estimate total body fat levels Cross sectional view

38
It is one simple mean of measuring subcutaneous fat and therefore body composition. It is based on the assumption that 50% of body fat is subcutaneous. Skin fold caliper and techniques employed should be standardized. It is measured at Triceps, Biceps(left arm), and Supra-Iliac or Sub-scapular regions
, and Supra-Iliac or Sub-scapular regions.")
39
Fairly accurate Easy to perform Inexpensive 39

40
40 Harpenden Calipers Lange Calipers

41
Objective with high specificity & sensitivity Measures many variables of nutritional significance (Ht, Wt, MAC, HC, skin fold thickness, waist & hip ratio & BMI). Readings are numerical & gradable on standard growth charts Readings are reproducible. Non-expensive & need minimal training

42
Inter-observers errors in measurement Limited nutritional diagnosis Problems with reference standards, i.e. local versus international standards. Arbitrary statistical cut-off levels for what considered as abnormal values.

Similar presentations


 Body volume(l) %body fat.>")


 Endomorph Mesomorph Ectomorph.>")


 A formula that includes height and weight to measure a person’s lean-to- fat composition.>")
, and varies with gender and age. Extra metabolic energy is consumed.>")
