Download presentation
Presentation is loading. Please wait.

1
Integrating Quantitative Literacy into Your Course

2
What is QL? Quantitative Reasoning is a habit of mind that effectively understands, investigates, communicates, and contextualizes numerical and graphical information in the evaluation and construction of arguments.

3
QL Learning Outcomes (1) Discuss quantitative results (e.g. how precise, how reasonable, how typical, how useful) in context of both the problem and general, real- world knowledge.
 in context of both the problem and general, real- world knowledge..")
4
QL Learning Outcomes (2) Interpret multiple representations of quantitative information and draw inferences from them. Representations of quantitative information can be symbolic (e.g., a formula or symbolic language), visual (e.g., a graph, diagram or schematic), numerical (e.g., a table of values or calculation), or verbal (e.g., written or oral work).
, visual (e.g., a graph, diagram or schematic), numerical (e.g., a table of values or calculation), or verbal (e.g., written or oral work)..")
5
QL Learning Outcomes (3) Communicate quantitative information effectively incorporating symbolic, numeric, and/or graphical representations within verbal communication.
 Communicate quantitative information effectively incorporating symbolic, numeric, and/or graphical representations within verbal communication.")
6
QL Learning Outcomes (4) Assess problems quantitatively by identifying relevant quantitative evidence, stating issues in numerical terms, and selecting appropriate quantitative methods.
 Assess problems quantitatively by identifying relevant quantitative evidence, stating issues in numerical terms, and selecting appropriate quantitative methods.")
7
QL Learning Outcomes (5) Solve problems and make decisions using multiple quantitative methods. Quantitative methods of problem solving include any of those among arithmetic, algebraic, geometric, algorithmic, and statistical methods.

8
QL Learning Outcomes (6) Analyze solutions to quantitative problems. Methods of analysis may include plausible estimation, testing for reasonableness, verifying the solution by using alternate methods of problem solving, and testing the solution to see if it is optimal.

9
QL Learning Outcomes (7) Demonstrate recognition of the value and the limitations of quantitative methods.
 Demonstrate recognition of the value and the limitations of quantitative methods.")
10
Curry College QL/QR Our learning objectives were originally developed at the request of Gen Ed. The initial bases for our Quantitative Reasoning objectives are the recommendations provided by the Mathematical Association of America and the American Association of Colleges and Universities, as implemented by Simpson’s College.

11
How to Integrate Quantitative Literacy into Your Course Example 1. Project from a History Course (15 minutes) Example 2. Project from a Mathematics Course (15 minutes) Group Work. Initial Ideas for a Project in Your Course (15 minutes)
 Example 2. Project from a Mathematics Course (15 minutes) Group Work. Initial Ideas for a Project in Your Course (15 minutes).")
12
How Can We Demonstrate to Students When Quantitative Information May Be Useful in Framing or Evaluating Arguments?

13
1. What do the numbers show? 1.1. How can numbers help describe something more precisely? 1.2. How can numerical information be used to establish the context or significance of a topic?

14
2. How typical is that? 2.1. What is the base rate? 2.2. What are the odds of that?

15
3. Compared to what? 3.1. What is the unit of measurement? 3.2. What is the order of magnitude?

16
4. Are the findings those of a single study/source or of multiple studies/sources? 4.1. What is the source of the numbers? 4.2. Who is sponsoring the research? 4.3. Can the results of the literature be summarized quantitatively?

17
5. How were the main characteristics measured? 5.1. How were key variables operationalized? 5.2. What meaning and degree of precision does the measurement procedure justify?

18
6. Who or what was studied? 6.1. What domain is being studied? 6.2. How was the sample constituted? 6.3. What is random?

19
7. Is the outcome of the study anything more than noise or chance? 7.1. Does the study support your research? 7.2. Does the study provide useful information?

20
8. How large is the result of study? 8.1. How substantial is the result? 8.2. How practically important is that?

21
9. What was the design of the study? 9.1. Was the experiment double-blind? 9.2. Is the design that of a true experiment?

22
10. What else might be influencing the findings? 10.1. What other variable(s) might be affecting the findings? 10.2. What do we not know, and how were uncertainties acknowledged?
 might be affecting the findings What do we not know, and how were uncertainties acknowledged .")
23
Example 1: Project from a History Course Quantitative and Information Literacy Enhancements: United States History II (1865-present) Goal: Marginally improve students’ quantitative and information literacy skills Strategies: Gradually increase exposure to and information from outside required readings/sources Gradually increase difficulty of finding and analyzing data Measure Results Class structure: four required essays, BlackBoard discussion
 Goal: Marginally improve students’ quantitative and information literacy skills Strategies: Gradually increase exposure to and information from outside required readings/sources Gradually increase difficulty of finding and analyzing data Measure Results Class structure: four required essays, BlackBoard discussion")
24
UNIT I Essay Question: Students directed to specific sources (textbook, course reader, and specific US Census tables) 6) The United States has always been a nation of immigrants, but the period between 1870 and 1910 witnessed a significant expansion of immigration and changes in immigration patterns that dramatically transformed the country. How did the demographic profile, particularly with respect to national origin, change for immigrants to the U.S. between 1870 and 1910? What areas of the country had the highest percentages of immigrants, and why? What opportunities and difficulties were immigrants presented with in the United States? What roles did industrialization and immigration play in transforming the cities, particularly with respect to labor? Sources: Class notes, American Promise, Reading the American Past, Ch. 17-1, 19-2, 19-3, 19-4, 19-5 U.S. Census Bureau, Tech Paper 29, esp. Table 4, Region and Country or Area of Birth of the Foreign-Born Population…. and Table 14, Foreign-Born Population by Historical Section and Subsection of the United States: 1850 to 1990 (also available on BlackBoard).U.S. Census Bureau, Tech Paper 29Table 4, Region and Country or Area of Birth of the Foreign-Born Population…Table 14, Foreign-Born Population by Historical Section and Subsection of the United States: 1850 to 1990
.U.S. Census Bureau, Tech Paper 29Table 4, Region and Country or Area of Birth of the Foreign-Born Population…Table 14, Foreign-Born Population by Historical Section and Subsection of the United States: 1850 to")
25
Quant/Info Lit Self-Assessment I-Week 3 (Unit I) 1)When you opened the links to the Census data, what kind of information were you looking for? 2) What parts of the question can you answer from the data? 3) Once you accessed the Census data, what strategies did you use to make meaning of the data as it related to the question? Did you need to do further research to use the Census data in this question? If so, what did you do? 4) What conclusions did you draw from the data that are relevant to the question ?
 What parts of the question can you answer from the data. 3) Once you accessed the Census data, what strategies did you use to make meaning of the data as it related to the question. Did you need to do further research to use the Census data in this question. If so, what did you do. 4) What conclusions did you draw from the data that are relevant to the question .")
26
UNIT IV Essay Question: Students required to use external sources, given general assignment to use Census data 5) The Immigration and Naturalization Act of 1965 led to a dramatic change in the U.S. population. How did the country change demographically and culturally as a result? What controversies have arisen around this wave of immigration? (Sources: U.S. Census Data, American Promise, external sources).
..")
27
Quant/Info Lit Self-Assessment I-Week 3 (Unit I) 1)When you opened the links to the Census data, what kind of information were you looking for? 2) What parts of the question can you answer from the data? 3) Once you accessed the Census data, what strategies did you use to make meaning of the data as it related to the question? Did you need to do further research to use the Census data in this question? If so, what did you do? 4) What conclusions did you draw from the data that are relevant to the question? Quant/Info Lit Self-Assessment I-Week 11 (Unit IV) 1)When you began your search, what kind of information were you looking for? 2) What parts of the question can you answer from the data? 3) Once you accessed the data, what strategies did you use to make meaning of the data as it related to the question? Did you need to do further research to use the data you found in this question? If so, what did you do? 4) What conclusions did you draw from the data that are relevant to the question?
 What parts of the question can you answer from the data. 3) Once you accessed the Census data, what strategies did you use to make meaning of the data as it related to the question. Did you need to do further research to use the Census data in this question. If so, what did you do. 4) What conclusions did you draw from the data that are relevant to the question. Quant/Info Lit Self-Assessment I-Week 11 (Unit IV) 1)When you began your search, what kind of information were you looking for. 2) What parts of the question can you answer from the data. 3) Once you accessed the data, what strategies did you use to make meaning of the data as it related to the question. Did you need to do further research to use the data you found in this question. If so, what did you do. 4) What conclusions did you draw from the data that are relevant to the question .")
28
Reflecting on QL Learning Outcomes/Questions

29
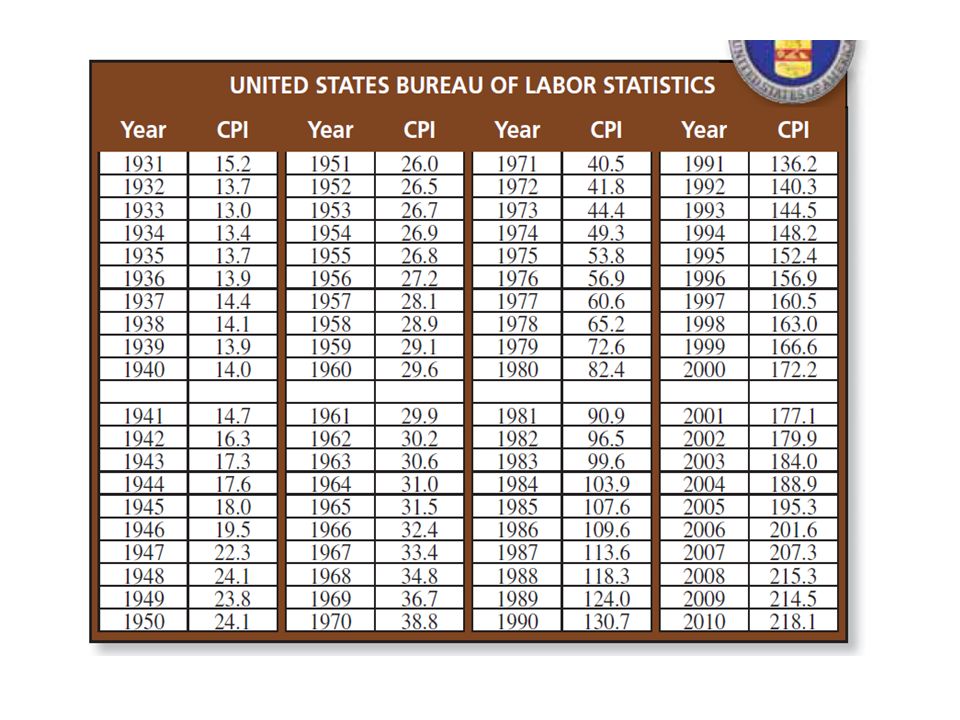
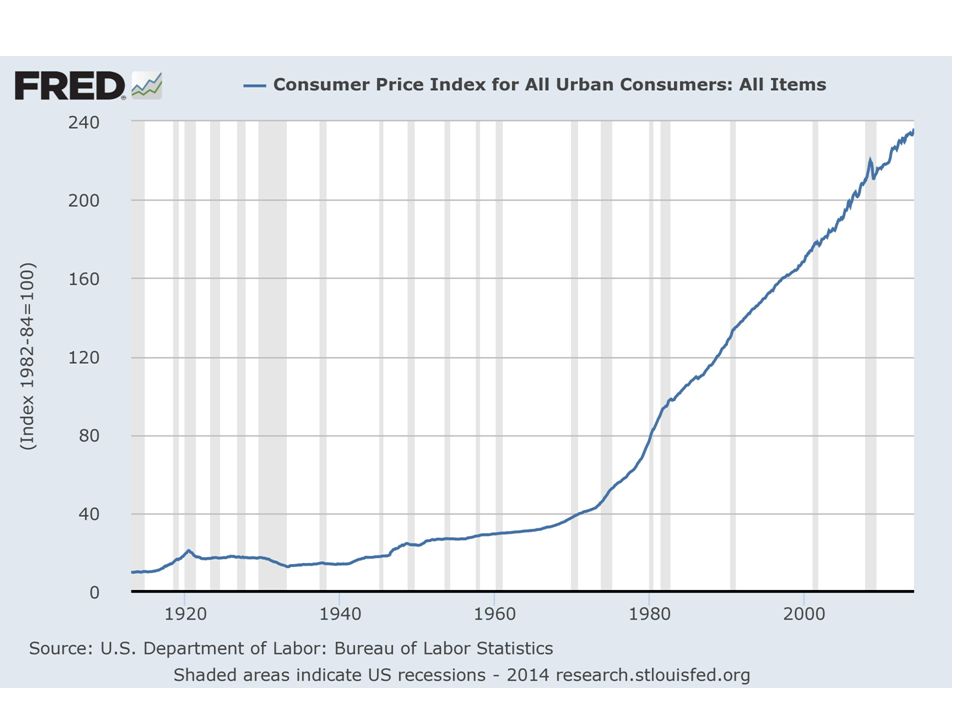
Example 2: Project from a Math Course Your grandfather bought a condo in Back Bay area in Boston in 1960 for $14,000. You inherited the property in 2010. The property was evaluated to be worth $790,000. Did the value of the property “keep up with inflation” or did it exceed inflation? Explain your reasoning. (This is one of the projects that we do in Math 1000 course.)
.")
32
Reflecting on QL Learning Outcomes/Questions

33
Initial Ideas for a Project from Your Course

34
Reflecting on QL Learning Outcomes/Questions

35
Summary

Similar presentations


 STUDENT WILL BE ABLE TO… 1. Define the domain of science.>")


 (published by ETS)>")


