Download presentation
Presentation is loading. Please wait.

1
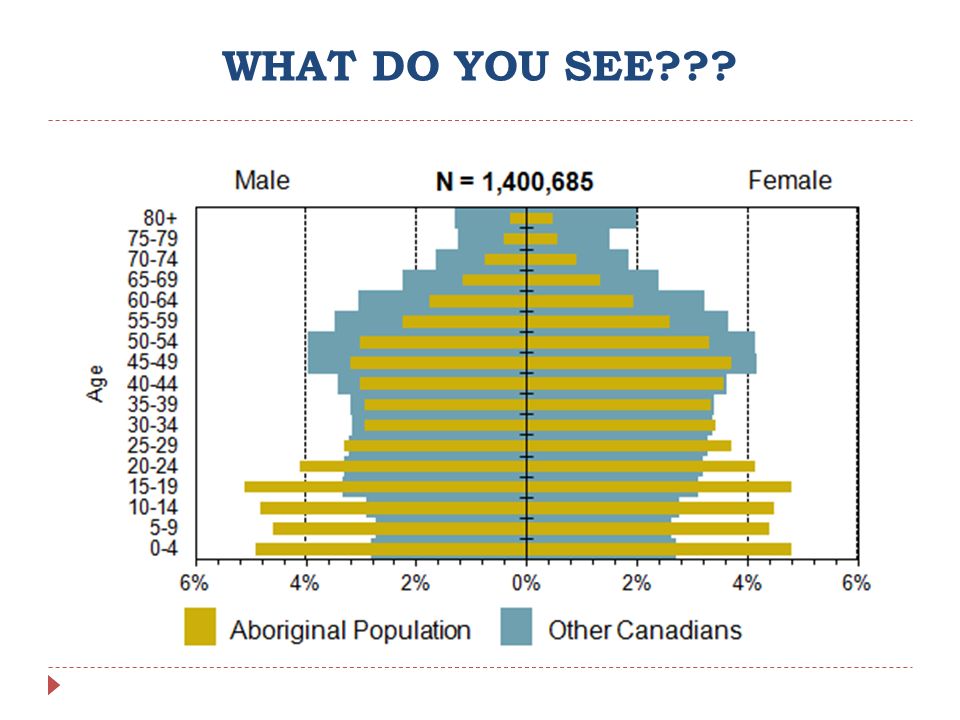
WHAT DO YOU SEE???

2
A Revolution In Population The Demographic Transition Model & Population Pyramids

3
The Demographic Transition Model Understanding Population Change

4
THE EFFECTS OF MIGRATION It is important to keep accurate numbers on a country’s population to build and maintain government infrastructure and create/implement business plans and marketing. In the last 30 years, Canada has experienced a fairly low birth rate, thus migration (immigration) has become the main contributor to our population growth.
 has become the main contributor to our population growth..")
5
NET MIGRATION RATE To get an accurate picture of Canada’s population (or another country’s population), we need to calculate the net migration rate. Net Migration Rate: the difference between the number of people immigrating to a country and the number of people emigrating.

6
NET MIGRATION EQUATION The equation is as followed: Immigration rate (people arriving in Canada) – Emigration rate (people leaving Canada) = Net Migration Rate
 – Emigration rate (people leaving Canada) = Net Migration Rate")
7
ANNUAL POPULATION CHANGE To calculate the annual (yearly) change in population, the equation is as followed: Birth Rate – Death Rate + or – Net Migration Rate = Population Growth Rate (annually) The multicultural populations of Canada and the USA are the result of migrations.
 change in population, the equation is as followed: Birth Rate – Death Rate + or – Net Migration Rate = Population Growth Rate (annually) The multicultural populations of Canada and the USA are the result of migrations.")
8
Review: What is Net Migration? What is the equation for Population Growth Rate?

10
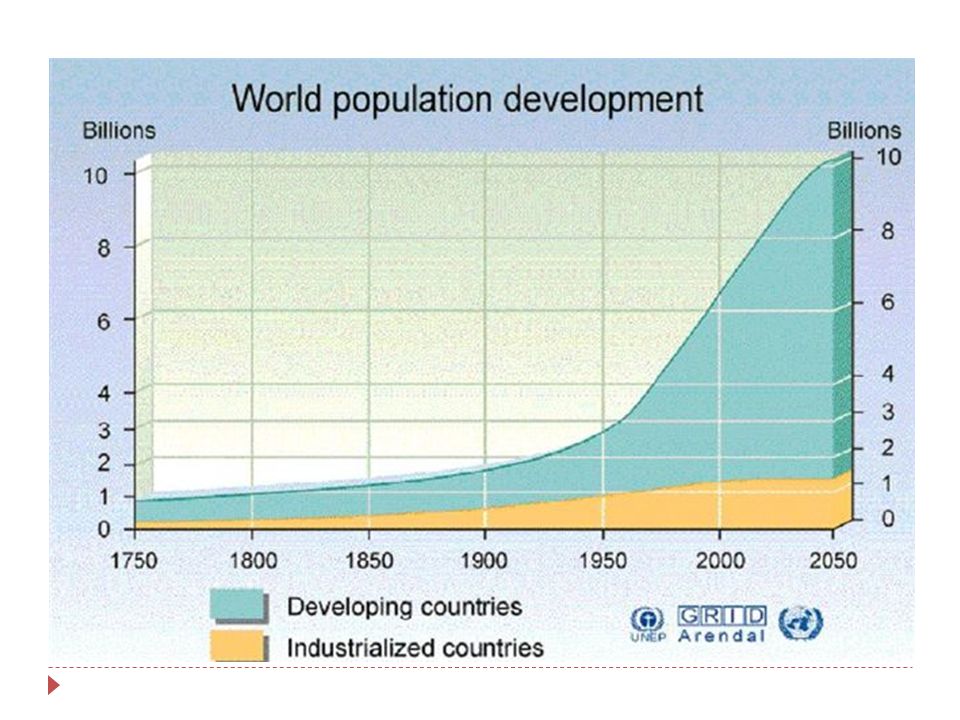
THE DEMOGRAPHIC REVOLUTION For most of human history birth rates have been high. Yet, the population grew slowly before the 1700s because death rates were also very high, particularly among infants and young children. Life, according to Thomas Hobbes (an English philosopher) in 1651, was “poor, nasty, brutish and short.”
 in 1651, was poor, nasty, brutish and short. .")
11
THE DEMOGRAPHIC REVOLUTION People had a life expectancy of little more than thirty years. Life Expectancy: the average number of years that an individual is expected to live.

12
To Ponder Review: What factors do you think contributed to the high death rates in the early part of human civilization?

13
A.D. 2000 A.D. 1000 A.D. 1 1000 B.C. 2000 B.C. 3000 B.C. 4000 B.C. 5000 B.C. 6000 B.C. 7000 B.C. 1+ million years 8 7 6 5 2 1 4 3 Old Stone Age New Stone Age Bronze Age Iron Age Middle Ages Modern Age Black Death—The Plague 9 10 11 12 A.D. 3000 A.D. 4000 A.D. 5000 1800 1900 1950 1975 2000 2100 Future Billions Source: Population Reference Bureau; and United Nations, World Population Projections to 2100 (1998). World Population Growth Through History
. World Population Growth Through History.")
14
THE DEMOGRAPHIC REVOLUTION Factors that contributed to high death rates: Lack of understanding of disease or hygiene Little or no medical care Poor nutrition Contaminated water Unsanitary living conditions

15
THE SHIFT Starting in Western Europe, spreading to North America, and then to developing countries, the rapid increase in population growth after 1750 was mainly due to falling death rate due to: The agricultural revolution increased food production so that people had better diets. Hygiene and medical knowledge improved (clean drinking water, nutritious diet, vaccinations).
..")
16
THE SHIFT Birth rates, however, remained high for a number of years, producing a wide gap between birth and death rates and a rapid growth in population. Three likely reasons for this gap are economic development, the move to cities, and rising standards of living.

17
THE REVOLUTION TODAY Today in Canada life expectancy is approximately eighty years: Life expectancy at birth of total population = 81.38 years Male = 78.81 years Female: = 84.1 years (2011 est.)
")
18
THE REVOLUTION TODAY Better control and understanding of disease, access to good medical care, improved nutrition and sanitary living conditions have contributed to our low death rates.

19
To Ponder Review: What happened in the demographic revolution?

20
World Health Organization (WHO) The WHO is the directing and coordinating authority for health within the United Nations system. It is responsible for providing leadership, shaping research, setting norms and standards, articulating policy options, providing technical support to countries, and monitoring and assessing health trends.

21
WHO After WWII, the United Nation’s WHO and other aid programs made improved health measures available to all countries. Death rates fell but birth rates are still high in many developing countries.

22
THE DEMOGRAPHIC TRANSITION MODEL Demographers often use models to represent a particular reality. Demographers also use models to represent a theory. Both are done in order to simplify information and make it understandable.

23
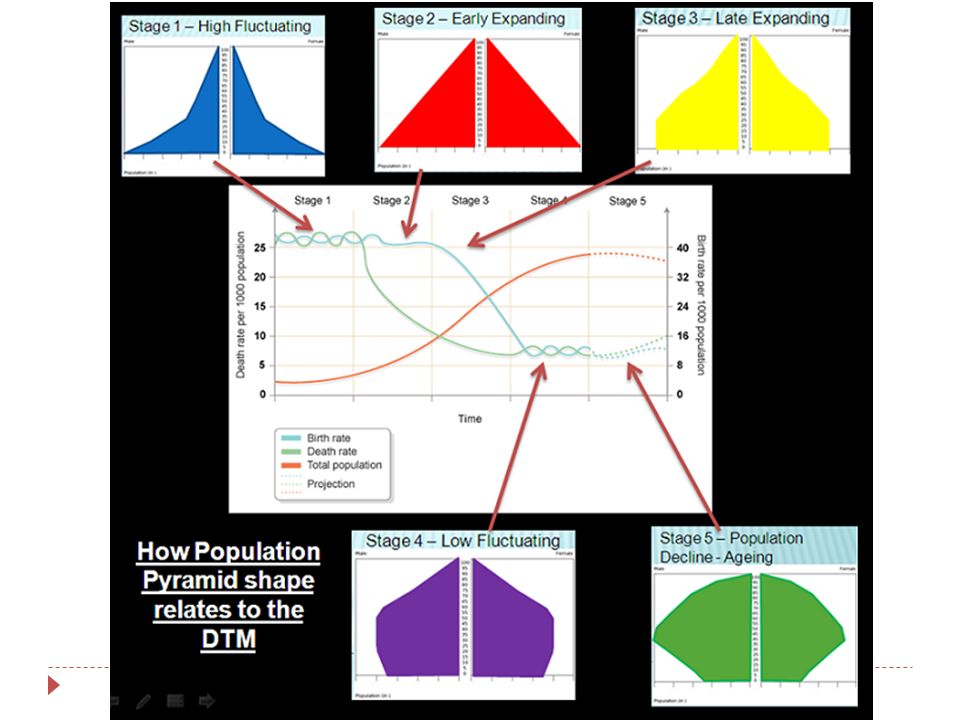
THE DEMOGRAPHIC TRANSITION MODEL One useful way of explaining population change is the Demographic Transition Model: It shows the changes in a population’s birth rates and death rates, and growth based on its technological development. The is model has five stages.

24
THE DEMOGRAPHIC TRANSITION MODEL

25
DTM - THREE ELEMENTS The Demographic Transition Model changes over a period of time in three elements: Birth Rates Death Rates Trends in overall population numbers

26
To Ponder Review: What is the demographic transition model?

28
THE 5 STAGES STAGE 1: High birth rates and high death rates result in small population growth. Why? Plagues, diseases, and poor nutrition keep mortality high (many countries in Africa today).
..")
29
THE 5 STAGES STAGE 2: Birth rates are still high as are death rates yet both are fluctuating so there is a rapid increase in population numbers. Why? Slightly improved health care, sanitation, and increased food supplies lead to a rapid fall in death rates (Kenya + Aboriginal people in Canada).
..")
30
THE 5 STAGES STAGE 3: Population growth begins to decline = birth rates begin to fall as do death rates; beginning to balance at a low level. Why? Industrialization, urbanization, and improved living standards lead to less desire for large families (China).
..")
31
THE 5 STAGES STAGE 4: The transition is complete to a low growth rate with low birth rates and low death rates = in balance. Why? Modernization/Industrialization. The birth rate may fluctuate in special circumstances, such as the post-war « baby boom » (Canada).
..")
32
THE 5 STAGES STAGE 5: Birth rates drop below death rates - no or very little population growth. Why? Modernization/Industrialization, dual income earners, want + need to have small families. Where? This is happening in some European countries (Germany) and in Japan. It is not known if this trend will extend to other regions (Australia).
 and in Japan. It is not known if this trend will extend to other regions (Australia)..")
33
THE DEMOGRAPHIC TRANSITION MODEL Early Expanding Expanding Late Expanding/ Stable Contracting

34
To Ponder Review: What are the 5 stages of the demographic transition model? Describe what happens in each of the stages.

35
THE DTM: VIDEO The Demographic Transition Model http://www.youtube.com/watch?v=0dK3mL35nkk &feature=related http://www.youtube.com/watch?v=0dK3mL35nkk &feature=related 1:08 minutes

36
BIRTH RATES Fertility Rate: The number of children a woman can have over her lifetime; connected to birth rates.

37
BIRTH RATES Problems: Very High Birth Rates Insufficient medical services + high infant mortality. Insufficient government funds for education of a large, young population.

38
BIRTH RATES Problems: Very Low Birth Rates A shortage of workers and entrepreneurs for the future, unless countries accept high levels of immigration. Fewer young people to care for aging parents, resulting in expensive care facilities.

39
BIRTH RATES Canada now has a low death rate and a falling birth rate: Canada is in Stage 4 right now in the Demographic Transition Model.

40
THE AGE AND STRUCTURE OF POPULATIONS The age structure of a population helps us understand the reasons for changes in population. Age structure: is the composition of the population of a country based on the age groups/cohorts of a population.

41
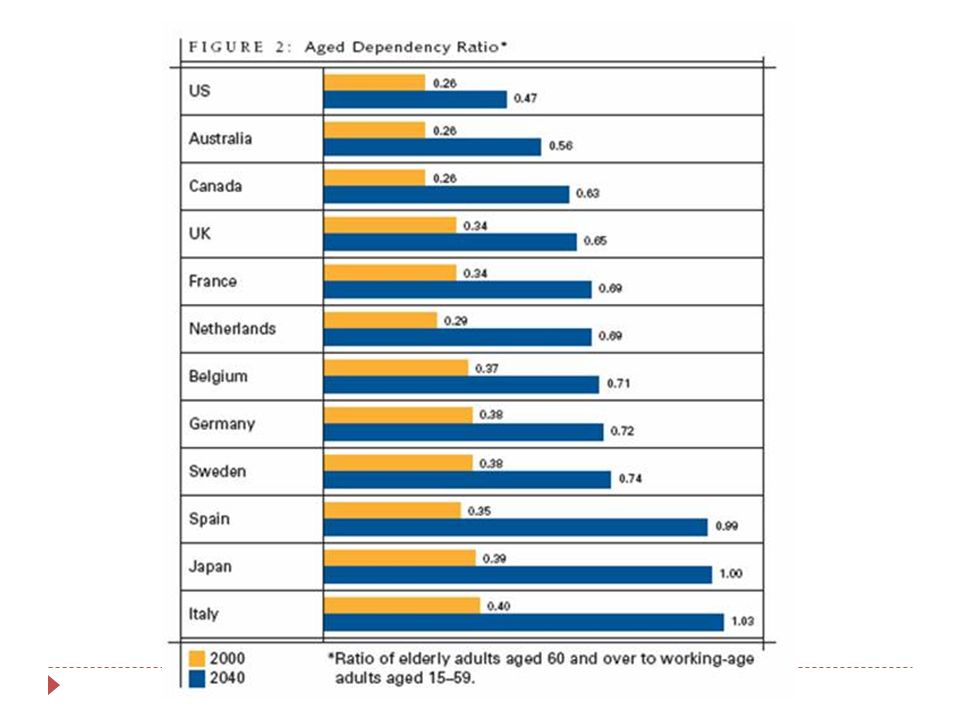
WORLD TRENDS IN AGING

42
DEPENDENCY RATIO Demographers divide populations into three groups to give the dependency ratio: Children up to the age of 15. Working adults from ages sixteen to sixty-four. Adults sixty-five and older.

43
DEPENDENCY RATIO Dependency Ratio: the proportion of the population that is being supported by the working age group. Dependency ratio = ((% under 15) + (% over 65)) / (% 15 to 64) x 100
 + (% over 65)) / (% 15 to 64) x 100.")
45
To Ponder Review: What is meant by the term dependency ratio?

47
WHAT DO YOU SEE???

50
Population Pyramids Understanding Population Change

51
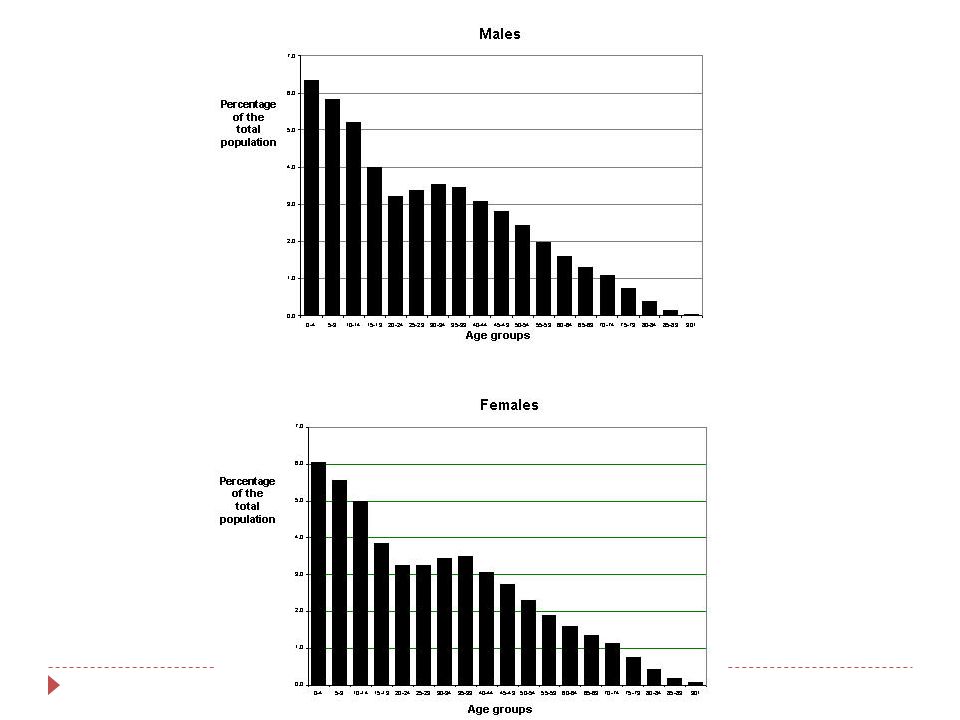
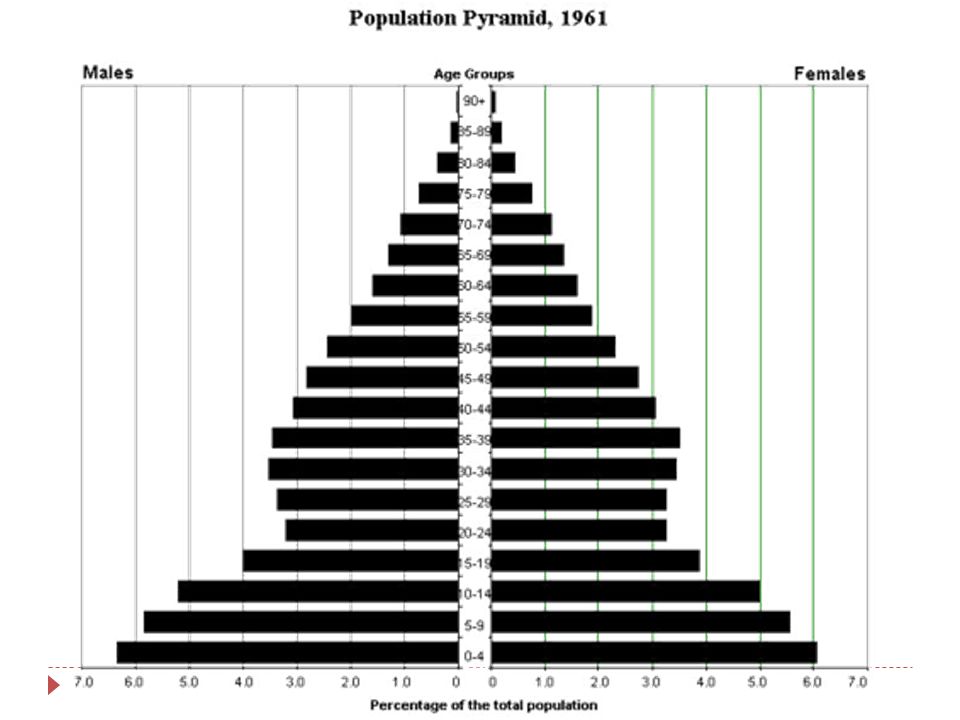
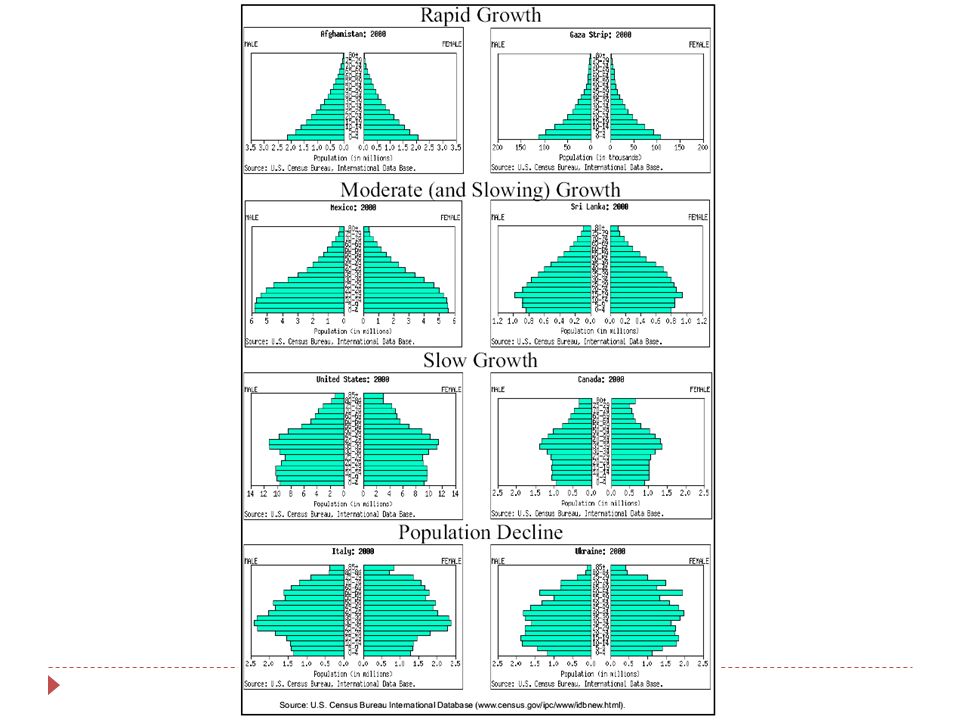
POPULATION PYRAMIDS A population pyramid (aka “age pyramid”): Is a graph (essentially two bar graphs) that shows the age and sex structure of a population. A series of horizontal bars graphs for the male and female populations are placed back to back called cohorts.

52
EXPANDING, STABLE, & CONTRACTING POPULATIONS Population pyramids graphically represent: Expanding Stable Contracting populations

53
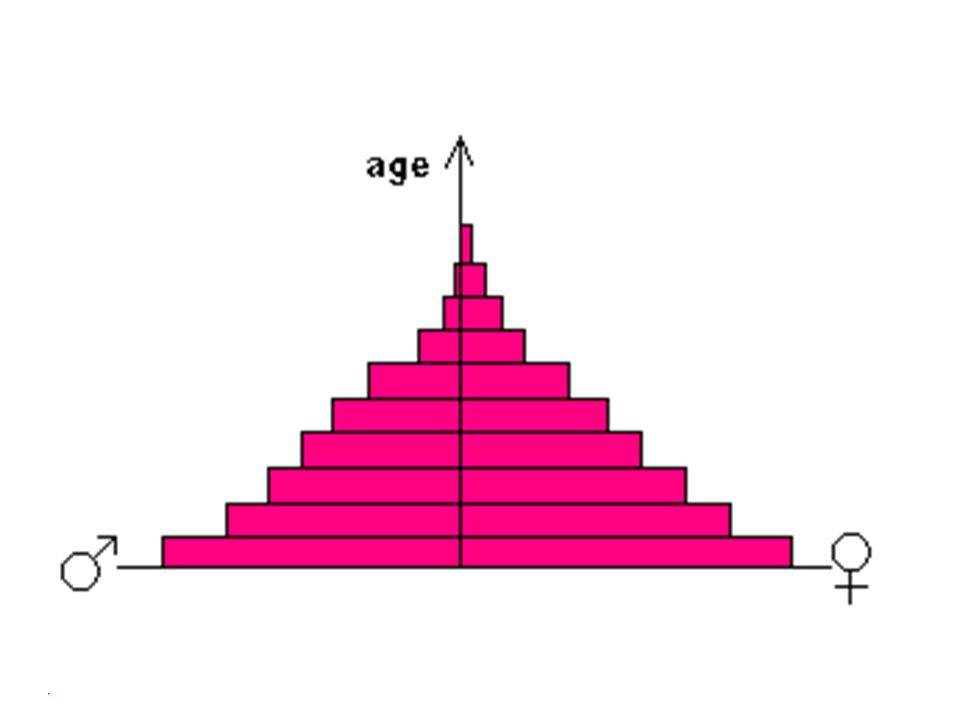
EXPANDING, STABLE, & CONTRACTING POPULATIONS Expanding population pyramid = Countries with high birth rates and death rates have many children being born and many dying; sometimes they fluctuate and create rapid population growth.

54
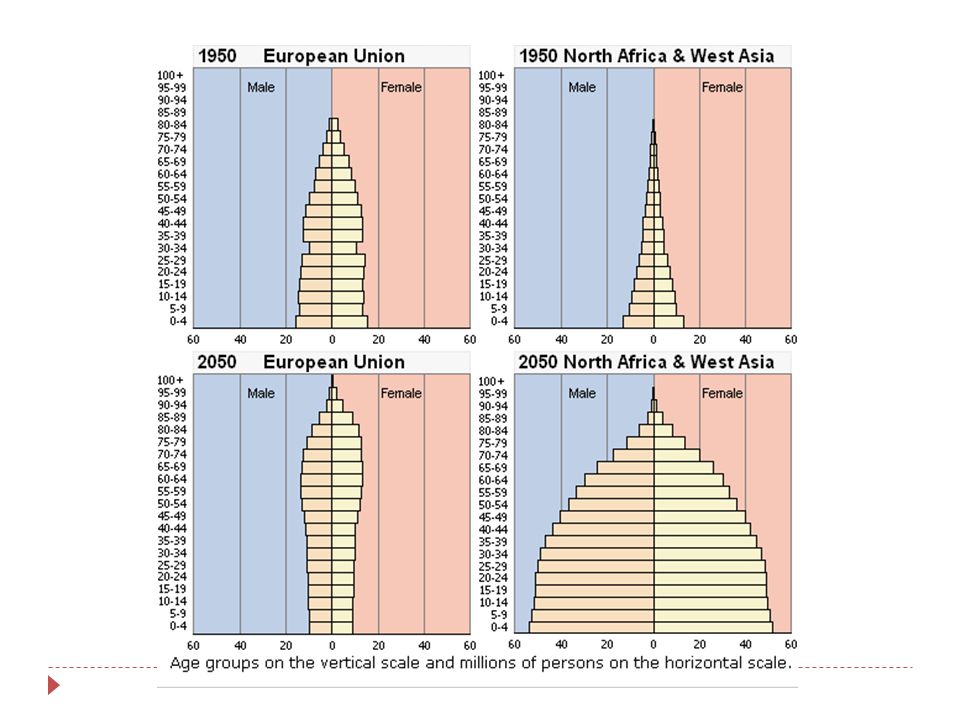
EXPANDING, STABLE, & CONTRACTING POPULATIONS Stable population pyramid = will have birth rates and death rates in balance; both are low; little population growth – immigration necessary.

55
EXPANDING, STABLE, & CONTRACTING POPULATIONS Contracting population pyramid = will have birth rates below death rates, both very low; minuscule or no population growth.

56
EXPANDING, STABLE, & CONTRACTING POPULATIONS In general Expanding pyramids = developing nations Stable pyramids = developed countries Contracting = developed nations

57
To Ponder Review: What is a population pyramid? Describe each of the three main types of population pyramids.

61
Contracting Expanding Early Expanding Stable

62
Contracting Expanding Early Expanding Stable

63
Expanding Stable Contracting Early Expanding

64
(early expanding) (stable)
 (stable)")
65
Early Expanding Expanding Late Expanding / Stable Stable Contracting

66
earlystable

67
THE PYRAMIDS: Early/Expanding Early Expanding/ Expanding Pyramid (Stage 1 +2): A population pyramid showing a broad base, indicating a high proportion of children, a rapid rate of population growth, and a low proportion of older people.
: A population pyramid showing a broad base, indicating a high proportion of children, a rapid rate of population growth, and a low proportion of older people.")
68
THE PYRAMIDS: Early/Expanding This wide base indicates a large number of children. A steady upwards narrowing shows that more people die at each higher age band.

69
THE PYRAMIDS: Early/Expanding This type of pyramid indicates a population in which there is a high birth rates, a high death rate and a short life expectancy. This is the typical pattern for less economically developed countries, due to little access to and incentive to use birth control, negative environmental factors (for example, lack of clean water) and poor access to health care.
 and poor access to health care..")
70
THE PYRAMIDS: Stable Stable Pyramid (Stage 3/4): A population pyramid showing an unchanging pattern of fertility and mortality – in balance.
: A population pyramid showing an unchanging pattern of fertility and mortality – in balance.")
71
THE PYRAMIDS: Contracting Contracting Pyramid (Stage 4 + 5): A population pyramid showing lower numbers or percentages of younger people. The country will have a greying population which means that people are generally older.

72
Early Expanding Expanding Late Expanding / Stable Stable Contracting

75
Which Type of Pyramid / Country / + Stage? Which Type of Pyramid/ Country / + Stage? Which Type of Pyramid/ Country / = Stage?

77
EXPANDING, STABLE, & CONTRACTING POPULATIONS Again, in general Expanding pyramids = developing nations Stable pyramids = developed countries Contracting = developed nations

78
REVIEW What is a population pyramid? What is its purpose? Provides statistics population divided into sex and ages of people in area.

79
REVIEW Shows rate of population growth. Shows ‘‘balance’’ between males/females. Displays the dependency ratio. Shows the stages of demographic transition.

80
THE DEMOGRAPHIC TRANSITION MODEL Early Expanding Expanding Late Expanding/ Stable Contracting

81
What is the best way to reduce population growth? EDUCATION! Specifically the education of girls and women = High Education/Literacy of W High Income/High Per Person/Capita GDP Low Fertility/Low BR Low Infant Mortality/Low DR = Low Population Growth

82
What is the best way to reduce population growth? NO EDUCATION Specifically the education of girls and women = Low Education/Literacy of W Low Income/High Per Person/Capita GDP High Fertility/High BR High Infant Mortality/High DR = High Pop Growth

83
What will happen to Canada’s Population in the Future? What is happening today?

84
What will happen to the Aboriginal Population in Canada in the Future?

85
CANADA’S POPULATION IN THE FUTURE Canada’s general population is aging (baby boomers well into their 60s). The Aboriginal population in Canada is getting younger and growing (fastest rising population; majority (28%) of population is under 15 years old).
 of population is under 15 years old)..")
86
CANADA’S POPULATION IN THE FUTURE: Aging Why is an aging population considered a problem? Increase in medical and social services government will need to spend money on services. What happens with the dependency ratio?

87
CANADA’S POPULATION IN THE FUTURE: Youth What are some issues with a young population? Increase in medical, education and social services government will need to spend money on services. What happens with the dependency ratio?

88
CANADA’S POPULATION: Immigration What are the effects of migration? Increase in immigrants Increase in workers & entrepreneurs. Increase in immigrants Payment of social and medical services due to taxes.

89
CANADA’S POPULATION: Immigration What if there was no immigration? Population decreases; contracts. Aging population increases; few youth; few people in the working ages.

90
THROUGH THE EYES OF A PYRAMID: CANADA’S POPULATION GROWTH 1871-2051 http://www.footwork.com/pyramids.asp http://www.footwork.com/pyramids.asp

91
To Ponder Review: What is happening to Canada’s population? What are the impacts of this trends?

Similar presentations


>")


