Download presentation
Presentation is loading. Please wait.

1
Measuring Watershed Health – Part I Biological Indicators

2
B A Is stream A healthy or unhealthy? Is stream B healthy or unhealthy?

3
What do we mean by healthy?

4
What is biodiversity? Bio means life; Diversity means variety, or different kinds; So … Biodiversity is the number of different plants and animals living within an ecosystem. Biodiversity is an important measure of an ecosystem’s health.

5
How do we calculate biodiversity? We count the number of different kinds of plants and animals.

6
We do not count everything. We look at biological indicators. What are they? Remember, bio means life; Indicators means a signal for attracting attention; So simply put: biological indicators are life forms that attract our attention.

7
Biological indicators are plant or animal species that are used to monitor the health of an environment or ecosystem. Specific plants or animals attract our attention within an ecosystem because their presence or absence tells us whether an environment is healthy or unhealthy.

8
Species that cannot tolerate pollutants (are sensitive to pollutants) Species that can tolerate pollutants Pollution Tolerant Species Biological Indicators Sensitivity to Pollution Biological indicator species are plants or animals that are either sensitive to pollutants or can tolerate pollutants. Pollution Intolerant Species

9
Our biological indicators: Vegetation and aquatic macroinvertebrates Plants and aquatic macros are good as measures of watershed health because … Different plants and macroinvertebrates display different pollution tolerances. They are easy to find and monitor. They stay in the same area, providing info of stream health over long periods of time.

10
Riparian vegetation: the community of plants growing along the banks of streams, rivers, lakes and ponds. Our Biological Indicators Riparian vegetation, stream or river banks, and the water of the stream or river together make up the riparian zone.

11
What do healthy riparian zones look like? Structurally complex, with diverse plant species that cover the banks; High Structural Diversity and Biodiversity Low Diversity of wildlife including fish, aquatic macroinvertebrates, birds, and mammals. Cold, clear stream water with leaves, twigs or logs, that provide habitat for aquatic animals;

12
Fieldtrip Practice Identifying Riparian Vegetation

13
Identify Riparian Vegetation (cont’d) Measuring Structural Diversity and Biodiversity Structural Diversity Part of Your Datasheet
 Measuring Structural Diversity and Biodiversity Structural Diversity Part of Your Datasheet")
14
Structural Diversity The structural layers of riparian vegetation Understory Layer (0.5 to 3 meters) Ground Cover Layer (up to 0.5 meters) Overstory Layer (over 3 meters) 0.5 m 3.0 m Identify Riparian Vegetation (cont’d)
 Ground Cover Layer (up to 0.5 meters) Overstory Layer (over 3 meters) 0.5 m 3.0 m Identify Riparian Vegetation (cont’d)")
15
Measuring Structural Diversity and Biodiversity (cont’d) Biodiversity Part of Your Datasheet Identify Riparian Vegetation (cont’d)
 Biodiversity Part of Your Datasheet Identify Riparian Vegetation (cont’d)")
16
Types of Plants in the Understory and Overstory Layers Identify Riparian Vegetation (cont’d) Coniferous (C) Deciduous (D) Mixed (M)
 Coniferous (C) Deciduous (D) Mixed (M)")
17
Identify Riparian Vegetation (cont’d) Coniferous (C) Plant Types needle- or scale-like, leaves; many are evergreen includes trees or shrubs seeds produced in cones General characteristics:
 Coniferous (C) Plant Types needle- or scale-like, leaves; many are evergreen includes trees or shrubs seeds produced in cones General characteristics:")
18
Identify Riparian Vegetation (cont’d) Deciduous (D) Plant Types General characteristics: include trees, shrubs & non-woody plants shed leaves seasonally produce seeds through flowers
 Deciduous (D) Plant Types General characteristics: include trees, shrubs & non-woody plants shed leaves seasonally produce seeds through flowers")
19
Sedges & rushes (SR) Grasses & forbs (G) Pollution tolerant (P) Identify Riparian Vegetation (cont’d) Plant Types of the Ground Cover Layer
 Grasses & forbs (G) Pollution tolerant (P) Identify Riparian Vegetation (cont’d) Plant Types of the Ground Cover Layer")
20
Sedges, rushes and grasses Sedges (SR): stems are triangular, so they have 3 edges; found in very moist soils Rushes (SR): stems are round; found in very moist soils Grasses (G): stems are hollow and flattened; leaves also flat and hug stem to ground; found in dry to moist soils Identify Riparian Vegetation (cont’d) Sedges have edges; rushes are round; Grasses wear robes down to the ground.
: stems are triangular, so they have 3 edges; found in very moist soils Rushes (SR): stems are round; found in very moist soils Grasses (G): stems are hollow and flattened; leaves also flat and hug stem to ground; found in dry to moist soils Identify Riparian Vegetation (cont’d) Sedges have edges; rushes are round; Grasses wear robes down to the ground.")
21
Forbs (G) Forbs: herbaceous (non-woody stems) flowering plants that are NOT sedges, rushes and grasses Identify Riparian Vegetation (cont’d) Pollution tolerant grasses (P) Saltgrass Tufted hairgrass
 Forbs: herbaceous (non-woody stems) flowering plants that are NOT sedges, rushes and grasses Identify Riparian Vegetation (cont’d) Pollution tolerant grasses (P) Saltgrass Tufted hairgrass")
22
Other Choices for Ground Cover Layer Bare/disturbed ground (B) = bare soil or dead plant matter (no living plant cover) Tailings (T) = soil contaminated with tailings Rock (R) = rock Identify Riparian Vegetation (cont’d)
 = bare soil or dead plant matter (no living plant cover) Tailings (T) = soil contaminated with tailings Rock (R) = rock Identify Riparian Vegetation (cont’d)")
23
#1 #2 Write your answers on worksheet

24
Identify Riparian Vegetation (cont’d) #3 #4 #5
 #3 #4 #5")
25
Identify Riparian Vegetation (cont’d) #6 #7 #8
 #6 #7 #8")
26
Aquatic macroinvertebrates: animals without backbones that are large enough to see with the naked eye, and that live all or most of their lives in water. Our Biological indicators (cont’d) Aquatic macroinvertebrates
 Aquatic macroinvertebrates.")
27
Aquatic macroinvertebrates include the … Midge larvae Mayfly nymph Snipe fly larva Stone fly nymph Riffle beetle larva Caddisfly larva Alderfly larva Black fly larva Blood midge larva Dragonfly nymph Crane fly larva Insects Crayfish Sowbug Scud Crustaceans Annelids Leech Segmented worms Gilled snail Mussel Clam Pouch snail Mollusks

28
Fieldtrip Practice Identifying Aquatic Macroinvertebrates

29
Identify Aquatic Macroinvertebrates Use Key to Macroinvertebrate Life in the River to identify macros

30
FirstShells OR No Shells Practice how to use Key to Macro Life NextLegs OR No Legs

31
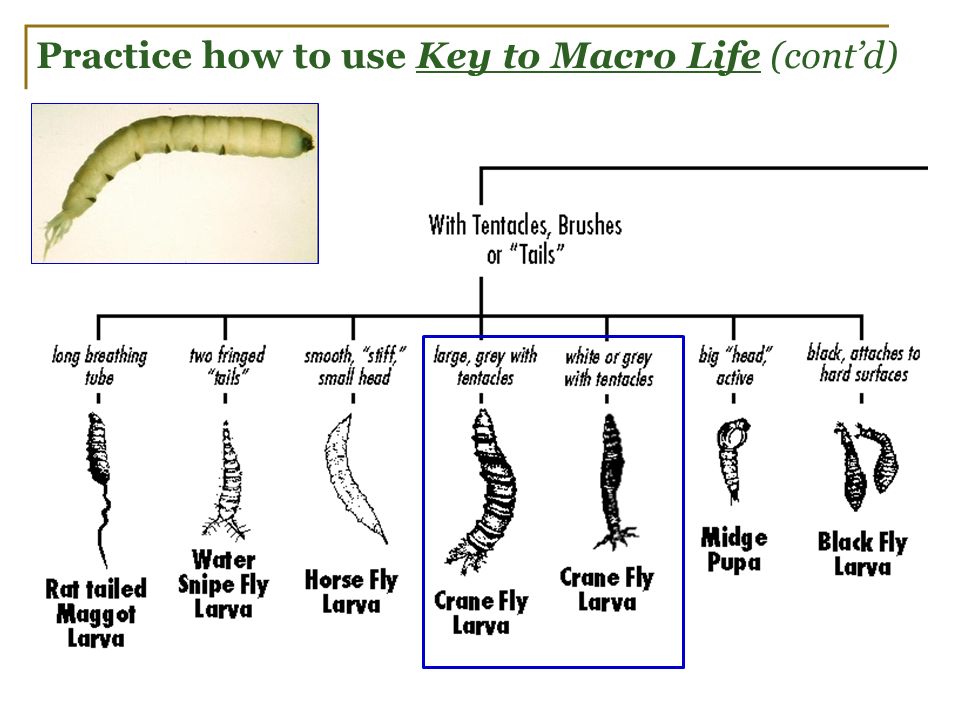
NextWith Tentacles, Brushes or “Tails” OR Worm-Like OR Microscopic Practice how to use Key to Macro Life (cont’d)
")
33
#9 #10 Identify Aquatic Macroinvertebrates Write your answers on worksheet

34
#11 Identify Aquatic Macroinvertebrates (cont’d)
")
35
Let’s Check Your Worksheets If you did not get something right or did not know the answer, that’s okay. This is practice.

36
Identify Riparian Vegetation (cont’d) #1 #2 D (deciduous) C (coniferous)
 #1 #2 D (deciduous) C (coniferous)")
37
Identify Riparian Vegetation (cont’d) #3 #4 #5 SR (rush) SR (sedge) G (grass)
 #3 #4 #5 SR (rush) SR (sedge) G (grass)")
38
Identify Riparian Vegetation (cont’d) #6 #7 #8 P (saltgrass) G (forb) P (tufted hairgrass)
 #6 #7 #8 P (saltgrass) G (forb) P (tufted hairgrass)")
39
#9 #10 Identify Aquatic Macroinvertebrates (cont’d) Mayfly Black fly
 Mayfly Black fly")
40
#11 Practice how to use Key to Macro Life (cont’d) Caddisfly
 Caddisfly")
41
Which stream is healthier? B A

42
To review … The number of different plants and animals living within an ecosystem is called … Biodiversity

43
Plant or animal species that are used to monitor the health of an environment or ecosystem … Biological indicators

44
Aquatic macroinvertebrates are … Animals … without backbones large enough to see with the naked eye live all or most of their lives in water

45
Riparian vegetation Riparian zone Plants growing along stream or river banks are collectively called … About plants … Together, the riparian vegetation, stream banks, and the water are called the …

46
Why are plants and macros used to measure stream health? They are easy to find and monitor. They stay in same area, providing stream health information over a long period. They show differences in pollution tolerance. A species that can live in a polluted environment is called a … Pollution-tolerant species

47
Questions?

Similar presentations


 Form base of.>")


