Download presentation
Presentation is loading. Please wait.

1
Your Name Geography Mrs Worsfold Year 8 What is the plan? 1.People everywhere! 2.Oh I do like to be beside the seaside 3.Wish you were here 4.Extreme Antarctica 5.Mega cities

2
Plan Change Distribution with choropleth Density Pyramids Management Migration

4
Population People everywhere! Unit 1

5
What does population mean? Write a definition! http://www.poodwaddle.com/earthclock.swf

7
Population Learning Objective - To identify what population means and the impact on the World. -All pupils to identify what population means. 3 -Most pupils can state how population can change. 4 -Some pupils can start to identify what might influence population. 5/6

8
What 3 questions would you like to answer from the graph. 1. Annotate (label) the graph with description of what has/is happening. 2. Now suggestion why you think it has happened.
 the graph with description of what has/is happening. 2. Now suggestion why you think it has happened..")
10
The World Population Page 6 in Geog.2 Draw a cartoon to describe the change in the World’s population.

11
Your homework was to …… Birth Rate 1.Write a Definition Death Rate 1.Write a Definition COMPLETE THE FIRST COLUMN OF THE TABLE!

12
What changes Birth and death rate? Change Does it increase or decrease the birth or death rate? Use symbols if you like! How does it change it? EXPLANATION Better Healthcare A terrible war Clean water is available More women working More healthy food is available Deadly disease spreads Birth control is provided

13
What changes Birth and death rate? Change Does it increase or decrease the birth or death rate? Use symbols How does it change it? EXPLANATION Better Healthcare A terrible war Clean water is available More women working More healthy food is available Deadly disease spreads Birth control is provided

14
The population of Spain is approximately 47,270000 wikipedia The population of Andalucia is: 8,450000

15
Population Change Learning Objective To identify what natural change is and the factors that influence it. -All pupils to identify what birth and death rate mean. 4 -Most pupils can state a reason why the birth and death rate may increase and decrease. 5 -Some pupils can state the reasons why Spain´s population has started to decrease. 6

18
Create your own image to explain the Natural change in Population

19
Do the factors increase or decrease natural change? Many young children die due to poor health care Famine causing lots of people to die due to lack of food Parents wanting lots of children to help provide an income (such as working on farms) Disease (for example HIV/AIDS) causing lots of people to die. War/Conflict Lack of birth control/family planning No education about the benefits of a smaller family In many rural areas it can be the tradition to have lots of children Government policies which want to strengthen their population Better health care. Drug use, alcoholism and sexually transmitted diseases (STD’s)Lack of resources Peaceful conditions within the country Government policies (such as the One Child Policy in ) A culture which means men have a high status for having lots of children Education about the benefits of a smaller family
 Disease (for example HIV/AIDS) causing lots of people to die. War/Conflict Lack of birth control/family planning No education about the benefits of a smaller family In many rural areas it can be the tradition to have lots of children Government policies which want to strengthen their population Better health care. Drug use, alcoholism and sexually transmitted diseases (STD’s)Lack of resources Peaceful conditions within the country Government policies (such as the One Child Policy in ) A culture which means men have a high status for having lots of children Education about the benefits of a smaller family.")
20
Many young children die due to poor health careFamine causing lots of people to die due to lack of food Parents wanting lots of children to help provide an income (such as working on farms) Disease (for example HIV/AIDS) causing lots of people to die. War/Conflict Lack of birth control/family planning No education about the benefits of a smaller familyIn many rural areas it can be the tradition to have lots of children Government policies which want to strengthen their population Better health care. Drug use, alcoholism and sexually transmitted diseases (STD’s)Lack of resources Peaceful conditions within the countryGovernment policies (such as the One Child Policy in ) A culture which means men have a high status for having lots of children Education about the benefits of a smaller family
Lack of resources Peaceful conditions within the countryGovernment policies (such as the One Child Policy in ) A culture which means men have a high status for having lots of children Education about the benefits of a smaller family.")
22
Think about Spain’s population........ Do you think the population is increasing or decreasing? Media Reports might make you think it is increasing, but it actually is decreasing. Why do you think Spain’s population is decreasing? Link your answer to the birth and death rate. (Remember to gain the higher levels you need to explain Why, How and use examples!) http://www.youtube.com/watch?v=UFDZvMrqA38
 v=UFDZvMrqA38.")
25
THINK! Why are some places really crowded and others not?

26
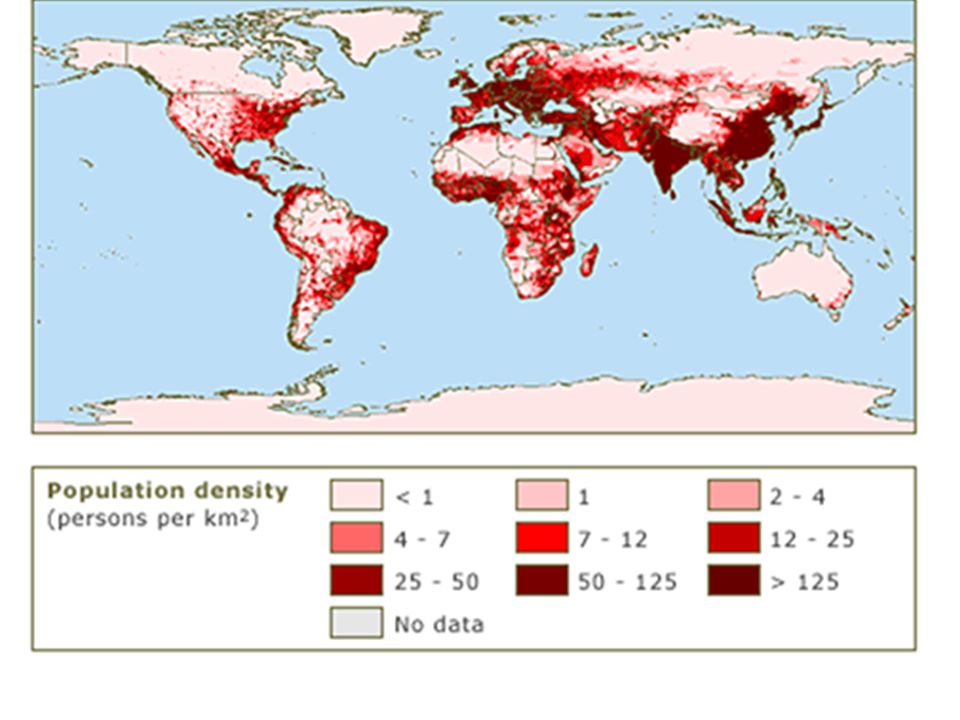
Population Density and distribution Learning Objective -To learn how population density is calculated and why some places are densely populated whilst others are sparsely populated. -All pupils to define what densely and sparsely populated mean. -All pupils can contrast between Population density and distribution. 4 -Most pupils can identify reasons why people do or do not want to live in a place. -Most pupils can confidently interpret a choropleth map. 5 -Some pupils can identify places where there are high or low populations --Some pupils can suggest why some areas have a high population distribution. 6

27
Where would you prefer to live in a densely or sparsely populated place ? Why?

28
What’s the density? Some areas of the world are more populated than others. We use population density as a measure of how many people live in a set area. Population density is measured in people per square kilometre (km 2 ). Population density = Number of people/Area(km 2 ) India has a population of 1,103,371,000 and covers 3,287,263km 2. The population density of India is 336.
. Population density = Number of people/Area(km 2 ) India has a population of 1,103,371,000 and covers 3,287,263km 2. The population density of India is")
29
What is the population density of England? The population is 52,095,895 England covers 30395 kilometres squared. Population density = Number of people / Area(km 2 ) 1713 PER KM2 is the population density of England. This is pretty high!
 1713 PER KM2 is the population density of England. This is pretty high!.")
30
What is the population density of Spain? The population is 47,270,000 Spain covers 504,782 kilometres squared. Population density = Number of people / Area(km 2 ) 93 per km squared is the population density of Spain.
 93 per km squared is the population density of Spain..")
31
THINK! Is this a good way to calculate population?

32
Density vs distribution Density figures only tell us how many people live in an area. The population can be evenly spread. Often, distribution of the population is affected by factors of physical and human geography. To describe the way people are distributed around an area we need to talk about the population distribution. Alternatively, the population can be randomly distributed. The population can also be clustered around one specific location.

33
When describing population distribution there are guidelines that should be followed. Describe the obvious pattern. Where do most people live? What areas are most populated? Give figures, if available, and locations. Using accurate figures helps support your description. Give any exceptions to the ‘obvious pattern’. Are there areas that do no fit in with the general population distribution? A choropleth map is a very accurate tool to use when describing population distribution. Describing distribution

34
Task For the Choropleth map describe the population distribution in Spain. To reach the higher levels include: -Use Key words -Values e.g it is 2.5 – 6.3% -Compass Directions -Towns and Major cities (use an atlas to help you)
.")
37
Keywords General Trend Anomaly Results that do not fit the pattern General pattern

38
World Population Density Learning Objectives -To explore areas in the world where there is a dense and sparse population density. - All pupils can state an area that is sparsely populated in the world. 3 -Most pupils can identify an area in the world that is densely populated and why. 4/5 -Some pupils can describe the world population density. 5/6

40
World Population Density – by country Western Europe and Asia are densely populated North America, South America and Africa have a low population density

41
Out of every 100 persons added to the population in the coming decade, 97 will live in developing countries.

42
Reminder Population Density People are unevenly distributed around the world. The difference in distribution is measured by comparing population density - the number of people per square kilometre (km²) if it were even! Population density is determined more by environmental factors which make an area more or less attractive to settlers than by economic development.
 if it were even. Population density is determined more by environmental factors which make an area more or less attractive to settlers than by economic development..")
43
The way in which people are spread across a given area is known as population distribution. Patterns of population distribution tend to be uneven. For example, in Spain there are more people living in the coastal areas than in the central plains. Reminder Population Distribution

44
In the World come up with 2 for each... Densely Populated areas in the World Sparsely Populated areas in the World WHY? What impact will the following have on population distribution? EXPLAIN! CLIMATE WORK RELIEF TRANSPORT GIVE EXAMPLES FOR EACH ONE! CAN YOU THINK OF ANY MORE FACTORS? HDI: A mixture of different indicators signs which tell us about how developed a country is GDP: How much money a country has

45
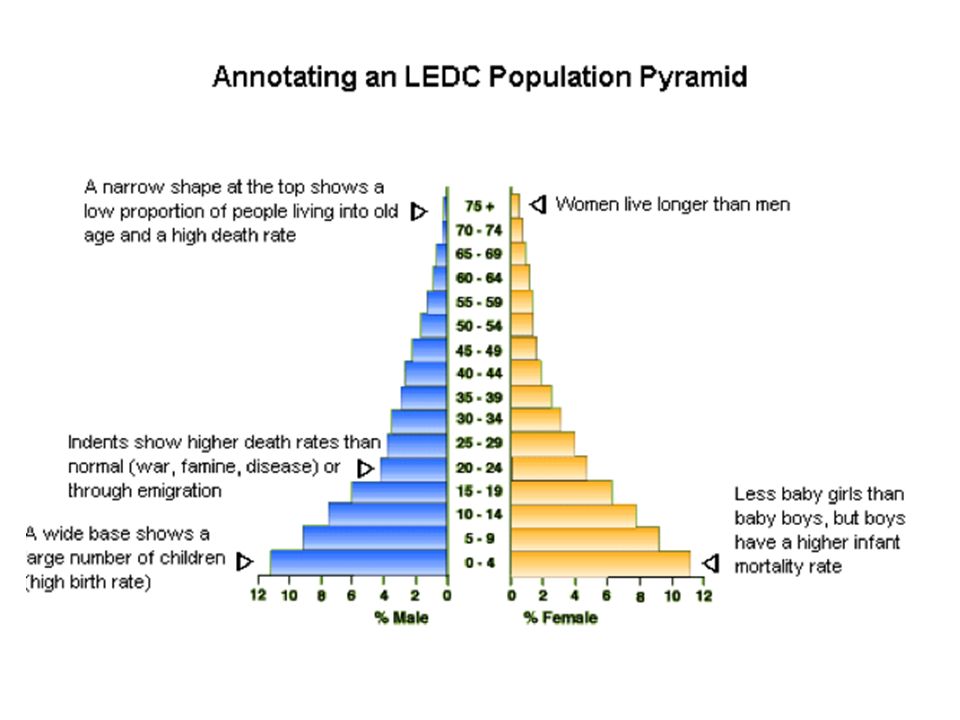
What is this? What does it tell us about the population of a place?

46
Population Pyramids To explain what Population pyramids show us and how they may differ. -All pupils can explain a population pyramid shows us. 4 -Most pupils can correctly analyse a population pyramid. 5 -Some pupils can compare the differences in pyramids for LEDCs and MEDCs, offering reasons. 6

47
Keywords: Census: a count of the number of people in a place Demography: The study of the population of a place Population pyramid: A way of presenting population data Sex-ratio: The number of men compared to the number of women Age distribution: The amount of different age groups in a country Dependent Population: The amount of population below the age of 16 and above the age of 65 (who are dependent on the government) Economically Active: The number of people working and contributing to the country
 Economically Active: The number of people working and contributing to the country")
48
http://populationpyramid.net/WORLD/2015/ Demography is the study of people and populations. Governments carry out a census to find out who lives in their country. They use the information to produce population structures However, they are taken at different times in different countries and often country boundaries change so it is difficult for a census to be accurate. Some countries can not afford to do a census and people do not always fill in the forms so the population of the world can only be an estimate. Demographers use census information to create population pyramids

49
What do they show? Sex-ratio: the amount of males to females in a location Males are shown on the left. Females are shown on the right.

50
What do they show? Age distribution of a country Age categories split into 5 year stages

51
Dependent Population: The population under the age of 15 and over 65 What do they show? Children 0-14 years of age Elderly population 65+ years of age

52
Economically Active: 15-60 years old who have the potential to contribute economically What do they show? Workforce

53
What do they show? In this country there is a high Birth Rate There is also a high Death Rate.

54
What should you annotate? Sex-ratio: what is the male/female ratio Birth Rate: Is the BR increasing or decreasing

55
How would the population pyramid look if it was a developing country (LEDC)?
")
58
What do population pyramids look like for different stages of the DTM? Stage 5?

59
Task: Population pyramid analysis 1)Where is the country? 2)Annotate the pyramid to show what it tells us about: - Sex ratio - dependants - economically active - birth rate - Death rate 1)Why could this population structure look like this? 2)What problems could this cause for the country? 3)How could these problems be solved?
Annotate the pyramid to show what it tells us about: - Sex ratio - dependants - economically active - birth rate - Death rate 1)Why could this population structure look like this. 2)What problems could this cause for the country. 3)How could these problems be solved .")
69
Population Pyramids To explain what Population pyramids show us and how they may differ. -All pupils can explain a population pyramid shows us. 4 -Most pupils can correctly analyse a population pyramid. 5 -Some pupils can compare the differences in pyramids for LEDCs and MEDCs, offering reasons. 6

71
Overpopulation Learning Objective -To consider what impacts overpopulation will have on the planet. -All pupils to identify what overpopulation means. -Most pupils can state two impacts on the Earth from Overpopulation. -Some pupils can suggest ways in which the population can be reduced.

73
What does ‘Overpopulation’ mean? Overpopulation means there are too many people living in a certain area, which can create environmental and social problems.

74
Is Overpopulation good or bad for the Planet?

75
Are there any problems in the UK due to overpopulation?

77
Overpopulation Learning Objective -To consider what impacts overpopulation will have on the planet. -All pupils to identify what overpopulation means. -Most pupils can state two impacts on the Earth from Overpopulation. -Some pupils can suggest ways in which the population can be reduced.

78
Population Management Learning Objective -To identify how one country has managed its population -All pupils can state why population needs to be managed. 4 -Most pupils will identify how China manages its population. 5 -Some pupils can analyse whether they agree or disagree with Chinas Policy. 6

79
What does ‘Overpopulation’ mean? Overpopulation means there are too many people living in a certain area, which can create environmental and social problems.

80
China’s One Child Policy http://www.bbc.co.uk/learningzone/clips/liu-xiao-di-and-the-single-child-policy/8001.html

81
http://www.vimeo.com/421461

82
Write a news paper article informing other pupils what the One child policy is in China and whether it has been successful (Evaluation) Include facts, map, photos, quotes and your opinion !
 Include facts, map, photos, quotes and your opinion !")
83
Remember No more than 140 characters What is the One Child Policy In China & Why is it in place ?

84
Population Management Learning Objective -To identify how one country has managed its population -All pupils can state why population needs to be managed. 4 -Most pupils will identify how China manages its population. 5 -Some pupils can analyse whether they agree or disagree with Chinas Policy. 6

85
Hu Jintao The President of China What two questions would you ask the Chinese government about the One Child policy? Mr Jintao has 2 children !

86
Write a news paper article informing other pupils what the One child policy is in China and whether it has been successful (Evaluation) Include facts, map, photos, quotes and your opinion !
 Include facts, map, photos, quotes and your opinion !")
88
Population Management Learning Objective -To identify how one country has managed its population -All pupils can state why population needs to be managed. 4 -Most pupils will identify how China manages its population. 5 -Some pupils can analyse whether they agree or disagree with Chinas Policy. 6

89
Share your solutions with your table. Do you agree with them? As a group decide the BEST Solution

90
Match the key words with the definitions Population density Is when there are relatively few people living in one area Under/optimum population When the number of people living in an area exceeds the amount of resources needed for them the balance in population needed with the number of available resources Sparsely populated The number of people living within a given area Population distribution overpopulation means the way or pattern in which people are spread across the world

91
What on earth is going on in these pictures? Detective Agency

97
Migration To describe how migration can impact both negatively and positively on population. - All to define migration and identify its various forms. -Most pupils can describe 2 ways migration can be viewed as a positive in an area. -Some pupils can evaluate the negative aspects on a population from migration and can begin to provide solutions to migration concerns.

98
Migration is the movement of people from one place to another It can be temporary, permanent, legal, illegal, internal and international http://www.youtube.com/watch?v=lOZmqIw qur4 Have you ever moved house /city / country / planet? WHY?

100
Can you explain why these things would PUSH or PULL people! Does this happen in Spain?

101
Positives Positives Negatives Negatives

102
Money Loss of skilled workers Diverse culture Over crowding Disagreements between different cultures Money sent home Reduce unemployment Women and children left behind Helps fill jobs no one else wants Many low paid jobs available Pressure on health care and education You decide!

103
If you were the Prime Minister, What would your Immigration policy be?

104
Migration To describe how migration can impact both negatively and positively on population. - All to define migration and identify its various forms. -Most pupils can describe 2 ways migration can be viewed as a positive in an area. -Some pupils can evaluate the negative aspects on a population from migration and can begin to provide solutions to migration concerns.

105
What would be the main push or pull factors in the following situations…? Conflict in Iraq Migrant from Poland

106
Migration Case Study Mexico to the USA To investigate a case study of migration to highlight why and how people migrate. - All pupils can state and explain one reason why Mexicans are migrating to the USA. Level 4 -Most pupils can describe how Mexicans cross the border and the problems they may face. Level 5 -Some pupils can evaluate the effectiveness of the USA Border patrol. Level 6

107
Discuss in pairs and then write down 5 question s you would like to know about it

108
-The border's total length is 3,169 km (1,969 miles) -It is the most frequently crossed international border in the world, with approximately three hundred fifty million (350,000,000) crossings per year.international border
 -It is the most frequently crossed international border in the world, with approximately three hundred fifty million (350,000,000) crossings per year.international border")
110
400 immigrants a year die trying to cross the Mexican border

111
I wanted to go to the USA because… Two Mexicans have been caught and put in a cell… (include good points about the USA) I wanted to leave Mexico because… (include bad points about Mexico) Two Mexicans have been caught and put in a cell…
 I wanted to leave Mexico because… (include bad points about Mexico) Two Mexicans have been caught and put in a cell…")
112
Who are these men and what are they doing? Who is this man and what is he doing? Where is this? What is he carrying? What is he carrying and why?

113
http://www.bbc.co.uk/learningzone/clips/im migration-to-the-usa/5627.html http://www.bbc.co.uk/learningzone/clips/im migration-to-the-usa/5627.html http://www.bbc.co.uk/learningzone/clips/illeg al-border-crossings-from-mexico-to-the- usa/412.html http://www.bbc.co.uk/learningzone/clips/illeg al-border-crossings-from-mexico-to-the- usa/412.html

Similar presentations