Download presentation
Presentation is loading. Please wait.

1
Reanalysis: Data assimilation aspects
Paul Poli ECMWF Meteorological Training Course Data Assimilation and Use of Satellite Data 29 April 2009

2
Data assimilation in reanalysis
Outline Definition Data assimilation in reanalysis Analysis scheme Bias correction Error assignment Data usage Reanalysis in the real world Projects Users European Reanalysis: ERA-Interim Conclusions and Future prospects

3
WHY Reanalysis ? (+ a short definition)
Cannot use operational NWP products for long studies! ECMWF operational system RE-analyse past observations with a fixed data assimilation system and model reanalysis

4
Other strong underlying reasons for reanalysis
Advantages of concentrating and analyze all sources of information [observations] in a unified framework: We should be able to draw more benefits from all this information than from one subset of it We don’t have too many observations of the Earth system to help solve the puzzle of natural variability Reanalyses produce four-dimensional fields which are consistent In space and in time Between the various geophysical parameters Discrepancies point to un-understood areas The validity of this approach is proven By validating reanalysis products with independent observations

5
Data assimilation in reanalysis
Outline Definition Data assimilation in reanalysis Analysis scheme Bias correction Error assignment Data usage Reanalysis in the real world Projects Users European Reanalysis: ERA-Interim Conclusions and Future prospects

6
Changes in operational NWP systems and input that affect product quality (usually for the better)
Data Observing system (instrumentation – raw data) Forcing data: SST, sea-ice, greenhouse gases… Data processing Data assimilation Analysis scheme Bias correction Data usage: blacklist, thinning, active/passive (! ) Observation error assignment (! ) NWP forecast model Physics Dynamics Resolution Misc: computer (! ), code (! ), compiler (! ), settings (! ) Changes that can be minimized in a reanalysis Requires additional efforts and collaboration
 Forcing data: SST, sea-ice, greenhouse gases… Data processing. Data assimilation. Analysis scheme. Bias correction. Data usage: blacklist, thinning, active/passive (! ) Observation error assignment (! ) NWP forecast model. Physics. Dynamics. Resolution. Misc: computer (! ), code (! ), compiler (! ), settings (! ) Changes that can be minimized in a reanalysis. Requires additional efforts and collaboration.")
7
Reanalysis in practical terms: NWP forecast model
Use a fixed version (dynamics, physics) To benefit from the best available parametrizations and modeling Use a fixed resolution Must be computationally affordable to cover say 20 years Implies to run about 10 days of assimilation and forecast per day of reanalysis run Practical choice, before starting reanalysis production: Use the near-latest operational model version Use the resolution that was operational 6-8 years ago Do not change setup during the run Be extra careful when changing machine, compiler… In a reanalysis, one picks a model configuration version and resolution which is best for the purpose – and one tries to stick to it!!
 To benefit from the best available parametrizations and modeling. Use a fixed resolution. Must be computationally affordable to cover say 20 years. Implies to run about 10 days of assimilation and forecast per day of reanalysis run. Practical choice, before starting reanalysis production: Use the near-latest operational model version. Use the resolution that was operational 6-8 years ago. Do not change setup during the run. Be extra careful when changing machine, compiler… In a reanalysis, one picks a model configuration version and resolution which is best for the purpose – and one tries to stick to it!!")
8
Reanalysis in practical terms: data assimilation system
Data assimilation combines information from Observations A short-range “background” forecast that carries forward the information extracted from prior observations Error statistics Dynamical and physical relationships 4DVAR This produces the “most probable” atmospheric state (maximum-likelihood estimate)*** ***if background and observation errors are Gaussian, unbiased, uncorrelated with each other; all error covariances are correctly specified; model errors are negligible within the 12-h analysis window background constraint observation constraint simulates the observations In a reanalysis, one tries to use the best data assimilation approach available
*** ***if background and observation errors are Gaussian, unbiased, uncorrelated with each other; all error covariances. are correctly specified; model errors are negligible within. the 12-h analysis window. background constraint. observation constraint. simulates the observations. In a reanalysis, one tries to use the best data assimilation approach available.")
9
Reanalysis in practical terms: data assimilation system
4D-Var CONTROL 3D-Var 4D-Var 15 February UTC All observations Surface pressure Observations only Advances in data assimilation can help extract more information from historic data that could ever be thought possible at the time the observations were collected

10
Reanalysis in practical terms: data assimilation system
Data assimilation combines information from Observations A short-range “background” forecast that carries forward the information extracted from prior observations Error statistics Dynamical and physical relationships 4DVAR ***if background and observation errors are Gaussian, unbiased, uncorrelated with each other; all error covariances are correctly specified; model errors are negligible within the 12-h analysis window This produces the “most probable” atmospheric state (maximum-likelihood estimate)*** ***if background and observation errors are Gaussian, unbiased, uncorrelated with each other; all error covariances are correctly specified; model errors are negligible within the 12-h analysis window background constraint observation constraint simulates the observations
*** ***if background and observation errors are Gaussian, unbiased, uncorrelated with each other; all error covariances. are correctly specified; model errors are negligible within. the 12-h analysis window. background constraint. observation constraint. simulates the observations.")
11
Reanalysis in practical terms: bias correction
Variational bias correction (see lecture by Niels Bormann) Aims at correcting observation and observation operator biases in an automatic, consistent and time-smooth manner Requires data that are considered not biased: All in situ: surface stations, radiosondes, aircraft GPS radio occultation (see lecture by Sean Healy) So far, only applied to satellite radiance data in reanalysis Caveat: Not designed to handle model biases! Variational bias correction has become an important component of global reanalysis because it minimizes the impact of changes in radiance data (new instruments, re-calibration during flight…)
 Aims at correcting observation and observation operator biases in an automatic, consistent and time-smooth manner. Requires data that are considered not biased: All in situ: surface stations, radiosondes, aircraft. GPS radio occultation (see lecture by Sean Healy) So far, only applied to satellite radiance data in reanalysis. Caveat: Not designed to handle model biases! Variational bias correction has become an important component of global reanalysis because it minimizes the impact of changes in radiance data (new instruments, re-calibration during flight…)")
12
Example 1 of variational bias correction: Instrument recalibration
Instrument recalibration (AMSU-A sensor on METOP-A) changes mean behaviour of the instrument automatically corrected by the variational bias correction scheme. global (AQUA) An example where the bias correction is responding to instrument recalibration
 changes mean behaviour of the instrument automatically corrected by the variational bias correction scheme. global. (AQUA) An example where the bias correction is responding to instrument recalibration.")
13
Example 2 of variational bias correction: Bias in the observations
Satellite orbit drift changes sun angle on the satellite changes satellite heat budget changes in-satellite blackbody used for warm target calibration automatically corrected by the variational bias correction scheme. From Grody, Vinnikov, Goldberg, Sullivan, and Tarpley global global Before bias correction After bias correction An example where the bias correction is acting properly – and for the good reason

14
Example 3 of variational bias correction: MSU instrument bias due to satellite reference calibration blackbody fluctuations Variational bias estimates for NOAA-14 Actual warm-target temperatures on board NOAA-14 (Grody et al. 2004) This illustrates the power of reanalysis in identifying instrument errors based on all available information [model and observations]
 This illustrates the power of reanalysis in identifying instrument errors based on all available information [model and observations]")
15
Example 4 of variational bias correction: Bias in the forecast model
Mt Pinatubo eruption introduced aerosols in stratosphere stratosphere got warmer Forecast model uses fixed quantity of aerosols bias considered to be an observation bias by the bias correction scheme, and hence was corrected for. tropics tropics Before bias correction After bias correction An example where the bias correction is reacting – but for the wrong reason

16
Reanalysis in practical terms: data usage
Usage / no usage of data, besides variational QC and first-guess checks, is controlled using simple switches: Data extraction Thinning/sub-sampling Blacklisting/whitelisting Each of these steps can be a source of error in a reanalysis which concentrates many varied sources of information, whose observation characteristics sometimes even vary over time Observation monitoring is critical in a reanalysis: it is there to try to catch all the possible things that can go wrong with data usage

17
Observations assimilated in ERA-Interim 4DVAR
Total number of observations over 20 years: exceeds 30x109 Reanalyses have to deal with very large numbers of observations, whose quantity vary over time

18
Key changes to the observing system
1957: Radiosonde network enhanced in Southern Hemisphere for International Geophysical Year 1973: NOAA-2 – First operational sounding of temperature and humidity from polar-orbiting satellite NOAA-2 15 Oct 1972 1979: Improved sounding from polar orbiters Winds from geostationary orbit More data from commercial aircraft Drifting buoys Today: Additional satellite, aircraft and buoy data. Poorer radiosonde coverage, but better quality The input data change all the time … but the root problem doesn’t: obtain the best estimate of the atmosphere given all available observations

19
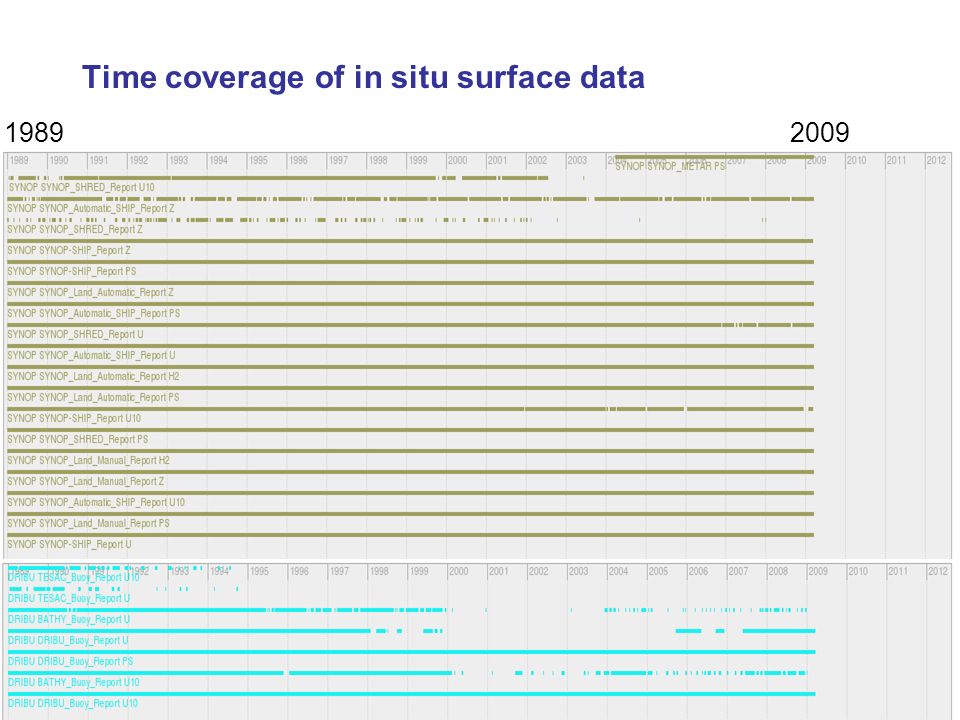
Time coverage of in situ surface data
1989 2009
20
Radiosonde coverage for 1958
B C D E H I J K M N P Q U V Ships maintaining fixed locations Average number of soundings per day: 1609

21
Radiosonde coverage for 1979
B C D E H I J K M N P Q U V Average number of soundings per day: 1626 Average number of soundings per day: 1626

22
Radiosonde coverage for 2001
Average number of soundings per day: 1189

23
Time coverage of Atmospheric Motion Vector (AMV) data
1989 2009

24
Early 1980s Expanded Low-resolution Winds
Example of improved data coverage: Reprocessed Atmospheric Motion Vectors from Meteosat Early 1980s Expanded Low-resolution Winds Early 1980s Expanded Low-resolution Winds

25
Time coverage of radiance data
1989 2009 Time coverage of radiance data Comparatively many more sources … Comparatively fewer sources

26
Observations available for ERA-Interim 4DVAR
“Conventional” “Satellite” Radiosondes TOTAL Radiances Surface Atmospheric motion vectors Aircraft Radiosondes (wind only) Scatterometers GPS radio occultation Drifting buoys Surface pressure pseudo-observations from Australian Bureau of Meteorology (PAOB)
 Scatterometers. GPS radio occultation. Drifting buoys. Surface pressure pseudo-observations from Australian Bureau of Meteorology (PAOB)")
27
Percentage of data assimilated in ERA-Interim
Sat Conv Sat Conv Sat Conv Conv Conv Sat A large number of satellite data are still not assimilated – these represent as many yet untapped resources for future reanalyses of the present

28
Data assimilation in reanalysis
Outline Definition Data assimilation in reanalysis Analysis scheme Bias correction Error assignment Data usage Reanalysis in the real world Projects Users European Reanalysis: ERA-Interim Conclusions and Future prospects

29
Atmospheric reanalysis: Starting points
Has its origins in datasets produced for the Global Weather Experiment (FGGE) Widely used, but superseded by use of multi-year operational NWP analyses Proposed by Roger Daley in 1983 for monitoring the impact of forecasting system changes on the accuracy of forecasts Adrian Simmons (personal communication) Proposed for climate-change studies in two journal articles: Bengtsson and Shukla (1988), Trenberth and Olson (1988)
 Widely used, but superseded by use of multi-year operational NWP analyses. Proposed by Roger Daley in 1983 for monitoring the impact of forecasting system changes on the accuracy of forecasts. Adrian Simmons (personal communication) Proposed for climate-change studies in two journal articles: Bengtsson and Shukla (1988), Trenberth and Olson (1988)")
30
Atmospheric reanalysis: Global products
Three centres took initiative in mid 1990s ERA-15 ( ) from Europe – with significant funding from USA NASA/DAO ( ) from USA NCEP/NCAR ( present) from USA Second round followed ERA-40 ( ) from Europe – with significant funding from FP5 JRA-25 ( ) from Japan NCEP/DOE ( present) from USA Now in third generation of comprehensive global reanalysis ERA-Interim ( present) from Europe JRA-50 ( ) from Japan NASA/GMAO-MERRA ( present) from USA NCEP-CFSRR ( ) from USA
 from Europe – with significant funding from USA. NASA/DAO ( ) from USA. NCEP/NCAR ( present) from USA. Second round followed. ERA-40 ( ) from Europe – with significant funding from FP5. JRA-25 ( ) from Japan. NCEP/DOE ( present) from USA. Now in third generation of comprehensive global reanalysis. ERA-Interim ( present) from Europe. JRA-50 ( ) from Japan. NASA/GMAO-MERRA ( present) from USA. NCEP-CFSRR ( ) from USA.")
31
Atmospheric reanalysis: The user base
Many users: 12000 registered users of ERA public data server ≳5M fields retrieved daily by ECMWF and Member-State users National mirror sites for ERA in many countries And many citations: Paper on NCEP/NCAR reanalysis is most cited paper in geosciences Paper on ERA-40 is most cited recently in the geosciences Many references in IPCC Fourth Assessment report

32
Atmospheric reanalysis: Becoming more diverse
Regional reanalysis and downscaling Long-term reanalysis using only surface-pressure observations Short-term reanalysis for chemical composition North American Regional Reanalysis Maximum gusts 26 December 1999 2m temperature 6UTC, 1 January 1999

33
Atmospheric reanalysis: Some uses
Monitoring of the observing system Providing feedback on observational quality, bias corrections and a basis for homogenization studies of long data records that were not assimilated Development of climate models Providing data for verification, diagnosis, calibrating output,, … Driving data for users’ models/applications For smaller-scales (global→regional; regional→local), ocean circulation, chemical transport, nuclear dispersion, crop yield, health warnings, … Providing climatologies for direct applications Ocean waves, resources for wind and solar power generation, … Study of short-term atmospheric processes and influences Process of drying of air entering stratosphere, bird migration, … Study of longer-term climate variability/trends Preferably used with caution in conjunction with observational studies
, ocean circulation, chemical transport, nuclear dispersion, crop yield, health warnings, … Providing climatologies for direct applications. Ocean waves, resources for wind and solar power generation, … Study of short-term atmospheric processes and influences. Process of drying of air entering stratosphere, bird migration, … Study of longer-term climate variability/trends. Preferably used with caution in conjunction with observational studies.")
34
ERA-Interim: after ERA-40 and before the next reanalysis

35
Under the hood of the ERA-Interim reanalysis
Grab observations from archive Basic pre-processing Ingest observations to assimilation database Run 4DVAR (atmosphere) and surface/sea/snow data assimilations Run the forecast model Generate monitoring and diagnostics plots
 and surface/sea/snow data assimilations. Run the forecast model. Generate monitoring and diagnostics plots.")
36
Reanalysis and climate monitoring
Benefits of reanalysis products as a proxy for observations are well established Reanalysis for climate monitoring: physically consistent ECVs (essential climate variables) In the climate community, reanalysis is still regarded as unsuitable for trend estimation (IPCC) This view evolves as reanalyses become more consistent and rely on more observations
 In the climate community, reanalysis is still regarded as unsuitable for trend estimation (IPCC) This view evolves as reanalyses become more consistent and rely on more observations.")
37
(“Atmospheric reservoir”)
Global water cycle ERA-40: Excessive precipitation over tropical oceans, exacerbated by Pinatubo eruption (“Atmospheric reservoir”) Pinatubo eruption
 Pinatubo eruption.")
38
Drifts in AMSU-A tropospheric radiance data
Globally averaged bias estimates for AMSU-A radiances AQUA There are clear inconsistencies among the AMSU-A observations -> some instrument issues Decreasing bias estimates: Reanalysis trend > AMSU-A trend This is not a drift toward the model climate (model has a cold bias in the troposphere) Why is the reanalysis getting warmer rather than colder?
 Why is the reanalysis getting warmer rather than colder")
39
Anchoring data for the troposphere: Radiosondes
Global mean departures and data counts for radiosonde temperature data NOAA-15 NOAA-16 Warm bias relative to radiosondes Data count

40
Anchoring data for the troposphere: Aircraft reports
Global mean departures and data counts for aircraft temperature data NOAA-15 NOAA-16 Unbiased relative to aircraft reports Data count Aircraft data biased?

41
Conclusions on the AMSU-A bias drifts
Drift in NOAA-15 Ch6 (0.5K per decade) is probably due to instrument errors (Mears et al 2008) Smaller drifts in other channels are due to warm bias in aircraft reports (Ballish and Kumar 2008) Slight excess warming in the upper troposphere is probably present in all reanalyses Aircraft data need bias correction ERA-Interim ERA-40 JRA-25 NCEP Global mean temperature anomalies
 is probably due to instrument errors. (Mears et al 2008) Smaller drifts in other channels are due to warm bias in aircraft reports (Ballish and Kumar 2008) Slight excess warming in the upper troposphere is probably present in all reanalyses. Aircraft data need. bias correction. ERA-Interim. ERA-40. JRA-25. NCEP. Global mean temperature anomalies.")
42
Validation: Fit to radiosonde wind observations

43
Validation: Forecast skill
Operations % Anomaly Correlation (%) for the 500 hPa Geopotential Height 100% = perfect forecast 60% = limit of use ERA-Interim % Updated by Simmons, from Simmons & Hollingsworth (2002)
 for the 500 hPa Geopotential Height. 100% = perfect forecast 60% = limit of use. ERA-Interim. % Updated by Simmons, from Simmons & Hollingsworth (2002)")
44
Validation: Fit to 2m land temperature anomalies (K)
Differences of monthly values from CRUTEM3 CRUTEM3 K ERA sampled as CRUTEM3 (Brohan et al., 2006) following Simmons et al. (2004)
 following Simmons et al. (2004)")
45
Validation: Fit to temperature profiles from radiosondes
Fit to temperature observations for ERA-Interim and ERA-40 analysis departures background departures Based on January 2000 radiosonde temperature reports north of 70N

46
Progress in time consistency: analysis increments
Zonal mean temperature analysis increments for August 2001 ERA-Interim ERA-40

47
Data assimilation in reanalysis
Outline Definition Data assimilation in reanalysis Analysis scheme Bias correction Error assignment Data usage Reanalysis in the real world Projects Users European Reanalysis: ERA-Interim Conclusions and Future prospects

48
Summary & Important concepts
Reanalysis does not produce “gridded fields of observations” But it enables to extract information from observations in one, unique, theoretically consistent framework Reanalysis sits at the end of the meteorological research and development chain that encompasses observation collection [measurement], observation processing, numerical weather prediction modelling, and data assimilation Unlike NWP, a very important concept in reanalysis is the consistency in time Reanalysis is bridging slowly, but surely, the gap between the “weather scales” and the “climate scales” Resolution gets finer Covers longer time periods

49
Current status of reanalysis & Future outlook
Reanalysis has developed into a powerful tool for many users and applications It relies on the combined expertise of a large user community and feedback An extended reanalysis project such as ERA-40 takes 7-10 years to complete It is worth repeating as all ingredients continue to evolve: Models are getting better Data assimilation methods are getting better Observation processing is improving The technical/scientific infrastructure for running & monitoring improves constantly With ERA-Interim, we made good progress in key problematic conceptual areas: Dealing with biases and changes in the radiance observing system Major challenges for a future reanalysis project: Bringing in additional observations (not dealt with in ERA-Interim) Dealing with model bias (ultimately responsible for problems with trends) Coupling with ocean and land surface Providing meaningful uncertainty estimates for the reanalysis products
 Dealing with model bias (ultimately responsible for problems with trends) Coupling with ocean and land surface. Providing meaningful uncertainty estimates for the reanalysis products.")
50
Further reading and on-line material
European reanalysis (ERA): Uppala et al. (2005), “The ERA-40 reanalysis”, Q. J. R. Meteorol. Soc., 131 (612), , doi: /qj NCEP/NCAR reanalysis: SciDAC Review (2008), “Bridging the gap between weather and climate”, on the web at with contributions from G. P. Compo and J. S. Whitaker Japanese 25-year reanalysis (JRA-25): NASA GMAO Modern Era Retrospective-analysis for Research and Applications (MERRA) Bengtsson et al. (2007), “The need for a dynamical climate reanalysis”, Bull. Am. Meteor. Soc., 88 (4),
: Uppala et al. (2005), The ERA-40 reanalysis , Q. J. R. Meteorol. Soc., 131 (612), , doi: /qj NCEP/NCAR reanalysis: SciDAC Review (2008), Bridging the gap between weather and climate , on the web at with contributions from G. P. Compo and J. S. Whitaker. Japanese 25-year reanalysis (JRA-25): NASA GMAO Modern Era Retrospective-analysis for Research and Applications (MERRA) Bengtsson et al. (2007), The need for a dynamical climate reanalysis , Bull. Am. Meteor. Soc., 88 (4),")
51
ERA-Interim product availability
Currently 1989 Jan until 2009 Feb, with monthly updates Resolution: T255L60, 6-hourly (3-hourly for surface) Analysis + forecast products; monthly averages Access to products: Member state users: full access via MARS All users: web access via ECMWF Data Server
 Analysis + forecast products; monthly averages. Access to products: Member state users: full access via MARS. All users: web access via ECMWF Data Server")
Similar presentations


 The Global Observing System Overview of data sources Data coverage Data.>")


, Brian Hoskins.>")


