Download presentation
Presentation is loading. Please wait.

1
Bandwidth Monitoring & Measurement (tools and services)
Olatunde Abiona Lecturer/Computer Engineer Department of Computer Science & Engineering Obafemi Awolowo University, Ile-Ife, NIGERIA

2
In this presentation Introduction What are Network Monitoring Tools
Bandwidth Monitoring Techniques/Services Setting up some monitoring Tools Conclusion

3
Introduction:- Why do we need to monitor and measure Bandwidth
Cost of Bandwidth is expensive for developing countries Bandwidth in developing countries is expensive. In a report for the Partnership for Higher Education in Africa, Mike Jensen calculates that Makerere University pays about $22,000/month for 1.5Mbps/768Kbps (in/out), Eduardo Mondlane pays $10,000/month for 1Mbps/384Kbps, while the University of Ghana pays $10,000/month for 1Mbps/512Kbps. These figures indicate that African universities, outside of South Africa, are paying over $55,000/month for 4Mbps inbound and 2Mbps outbound. These figures are about 100 times more expensive than equivalent prices in North America or Europe.
, Eduardo Mondlane pays $10,000/month for 1Mbps/384Kbps, while the University of Ghana pays $10,000/month for 1Mbps/512Kbps. These figures indicate that African universities, outside of South Africa, are paying over $55,000/month for 4Mbps inbound and 2Mbps outbound. These figures are about 100 times more expensive than equivalent prices in North America or Europe.")
4
Cont… To Know if the ISP is providing us with the required bandwidth paid for. To be able to optimize the available bandwidth 59% of institutions do not monitor or manage bandwidth at all (Belcher, 2005) For details See the ATICS Report: African research and Education Networking sept CERN
 For details See the ATICS Report: African research and Education Networking sept CERN.")
5
Ways to improve network performance
Upgrade infrastructure, to install faster, larger, and higher performing systems, lines and facilities. Look for cheaper provider and Increase/upgrade your bandwidth. Alternative approach is to recognize that ‘bandwidth’ is a valuable institutional resource or asset that needs to be managed, conserved, and shared as effectively as possible.

6
How do we measure Bandwidth?
Network Monitoring Tool

7
What are Network Monitoring Tools?
Allows the administrator to know the health status of the network. It provides information about collected data and the analysis of such raw data with a view to using scarce or limited resources effectively. Uses network probe. Probes let you isolate traffic problems and congestions slowing your network to a crawl.

8
What can we use the tools for?
Identifying unofficial services or servers Monitoring usage and traffic statistics Troubleshooting your network Investigating a security incident Keeping logs of users activities for accountability

9
Who? What? Where? How? When? Who is accessing your network?
students, academics, staff, visitors or others What are they accessing your network for? academic study, social use, business use, illegal use Where are they accessing your network from? internal, external How are they accessing your network? remote user, local Ethernet, WAN, dial-up, Wi-Fi, VPN When did they access your network? today, yesterday, last week, last month…

10
Network Monitoring Techniques
Fraleigh et al, (2001) describe two techniques for network measurement. Active Measurement Passive Measurement Design and Development of Passive monitoring infrastructure
 describe two techniques for network measurement. Active Measurement. Passive Measurement. Design and Development of Passive monitoring infrastructure.")
11
Active vs. Passive Active – relies upon data gathered from probe packets injected into the network. Passive – relies upon data gathered from active network traffic.

12
Active and Passive Tools
Network Monitoring Tools

13
Passive Network Monitoring Tools
Multi-Router Traffic Grapher Is a tool for monitoring traffic loads on a network link. MRTG generates HTML pages that provide a live, visual representation of the network traffic. It can be used to monitor any SNMP MIB. Limitations It cannot provide information that shows which host or application may be causing a traffic bottleneck. MRTG does not provide information about traffic type or protocol statistics

14
MRTG Example MRTG Example

15
Cont… Etherfind The software opens the network card in the promiscuous mode and writes a summary line of each packet to a file. Information include protocol type, size, source and destination addresses. The tool extract information from each packet. The data is presented as a text-based user interface Only users with root permission can access the tool.

16
CONT…… NFS watch It monitors all incoming network traffic destined to NFS file servers, and divides it into several categories. The number and percentages of packets received is displayed on the screen This tool was originally designed to monitor a single host

17
CONT… TCPdump Uses the packet capture library (libpcap).
Prints the headers of packet on a network interface, user analyses network status using this header manually Has many option for capturing raw data, but it does not provide any analysis capability for the captured data.

18
CONT….. Argus - It is a generic auditing tool.
- It runs as an application level daemon, promiscuously reading network packets from a specified interface - it generate network traffic audit records for the network activity. - it extract info from each packet in promiscuous mode, save the info to a file and later analyzes the file - It shows information about protocols, but does not show source or destination host information, it only provides a text based user interface.

19
CONT… Etherload It is a freely LAN traffic analyzer for MS-DOS with an Ethernet or Token Ring controller It basically captures each packet running through a LAN and provides various information on the packet. It can be used to check which host is generating the most traffic, which host is sending to which host, and what kind of protocols are in use in a specific Ethernet segment Since it is DOS based it provides character-based user interface for displaying traffic information

20
CONT….. IPTraf IPTraf is a console-based network statistics utility for Linux. It gathers a variety of figures such as TCP connection packet and byte counts, interface statistics and activity indicators, TCP/UDP traffic breakdowns, and LAN station packet and byte count Protocols Recognized IP TCP UDP ICMP IGMP IGP IGRP OSPF ARP RARP

22
CONT…… NTOP ntop is a network traffic probe that shows the network usage, similar to what the popular top Unix command does. ntop is based on libpcap and it has been written in a portable way in order to virtually run on every Unix platform and on Win32 as well. ntop users can use a a web browser (e.g. netscape) to navigate through ntop (that acts as a web server) traffic information and get a dump of the network status.
 to navigate through ntop (that acts as a web server) traffic information and get a dump of the network status.")
25
CONT… PRTG PRTG Traffic Grapher is an easy to use Windows software that monitors bandwidth usage and other network parameters via SNMP. PRTG Traffic Grapher monitors network and bandwidth usage as well as various other network parameters like memory and CPU usages, providing system administrators with live readings and periodical usage trends to optimize the efficiency, layout and setup of leased lines, routers, firewalls, servers and other Simple Network Management Protocol (SNMP) enabled network components.
 enabled network components.")
26
PRTG Example

27
CONT… Webalizer The Webalizer is a fast, free web server log file analysis program. It produces highly detailed, easily configurable usage reports in HTML format, for viewing with a standard web browser.

29
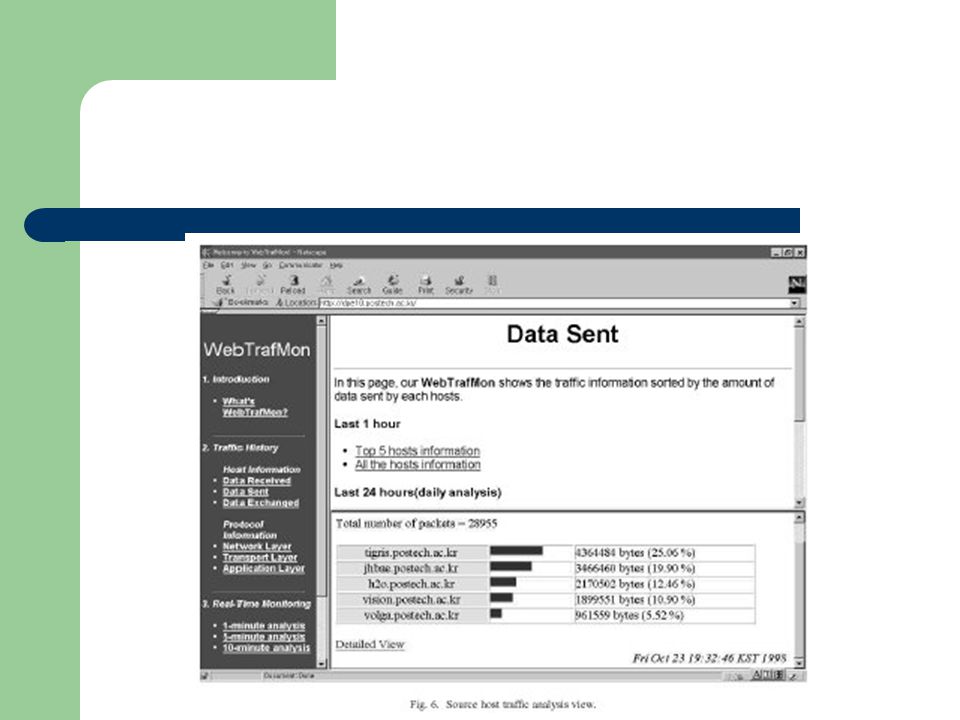
CONT… WebTrafMon Web-based network traffic monitoring and analysis system. Displays a list of hosts that are currently using the network and reports information concerning the IP(Internet Protocol) traffic generated and exchanged by each host. Limitations…. Can not Monitor and analyze the Fast Ethernet and Gigabit Ethernet Can not Analyze large log files
 traffic generated and exchanged by each host. Limitations…. Can not Monitor and analyze the Fast Ethernet and Gigabit Ethernet. Can not Analyze large log files.")
31
Bandwidth measurement services
Bluefield WV Boston, speakeasy bandwidth speed test Box 54 Server Brevard Users Group server Speed Test Chicago, speakeasy networked server speed test Cookeville TN Denver, speakeasy bandwidth speeds Dallas, speakeasy bandwidth speeds Speed test - text download, Norway Elk Grove CA (Nice test site) BrowserSpy, How fast is your connection... RoadRunner of Austin, Texas Lars-Magnus Lier Brad's RoadRunner networked server speeds Corley's RoadRunner Test page Eric's own RoadRunner Bandwidth Test 2 tests available. Mcafee's SpeedOmeter (resurrected) Speed test, Located in northern Sweden (Sweden - Borlange) Sweden, bandwidth speedtest RoadRunner of Tampa Bay, FL CNET's test. 2Wire Bandwidth Meter. 2Wire Bandwidth Meter. AIT -- Services -- Speed Test Online Speedtest etc. speedtest home of Cincinati, Ohio RoadRunner home of Austin, Texas Bandwidth Place Welcome! Beeline Bandwidth Test, Amsterdam bandwidth speedtest By mhmd, 4SURE.com bandwidth Norway online services bandwidth speed test DSL Reports in Megapath, CA
 BrowserSpy, How fast is your connection... RoadRunner of Austin, Texas Lars-Magnus Lier Brad s RoadRunner networked server speeds Corley s RoadRunner Test page Eric s own RoadRunner Bandwidth Test 2 tests available. Mcafee s SpeedOmeter (resurrected) Speed test, Located in northern Sweden (Sweden - Borlange) Sweden, bandwidth speedtest RoadRunner of Tampa Bay, FL tag=tm CNET s test. 2Wire Bandwidth Meter. kbps=1863 2Wire Bandwidth Meter. AIT -- Services -- Speed Test Online Speedtest etc. speedtest home of Cincinati, Ohio RoadRunner home of Austin, Texas Bandwidth Place Welcome! Beeline Bandwidth Test, Amsterdam bandwidth speedtest iid=154 By mhmd, 4SURE.com bandwidth Norway online services bandwidth speed test loc=1 DSL Reports in Megapath, CA.")
32
Cont… Sweden bandwidth speed test internet performance speedtest University of Cincinnati Elk Industries Server Test Information Technologies Lakeview Terrace, CA Lakeview Terrace, CA broadband connection test RoadRunner of the Mid-South Speed Test Netherlands internet speedtest connection performance United Kingdom speed test page for Fort Wayne,IN PC Pitstop's Internet Connection Center RoadRunner Speed Tests Networked Speed test, Amsterdam Netherlands cable speeds near Toronto, Canada Bandwidth Speed Test & Broadband Forum-Chat Zen's Web test

33
Setting up Ntop Download Ntop Using a tar ball http://rpm.pbone.net
tar xpfz ntop tar.gz ./configure make make install Installing with RPM is also easy. The package name may vary, but you simply use the command: rpm –uvh ntop-3.0-4mdk.i586.rpm Run ntop (service ntop start) Go to a web browser type
 Go to a web browser type")
34
Setting up MRTG Net-snmp Mrtg Snmpd.conf # define RO community
rocommunity bow rwcommunity bow #First Map the community name “bow" into a "security name“ # sec.name source community com2sec oaunet default bow # Second, map the security name into a group name: # groupName securityModel securityName group oaugroup v oaunet group oaugroup v2c oaunet

35
Snmpd.conf cont… # Third, create a view for us to let the group have rights to: # name incl/excl subtree mask(optional) #view systemview included system view all included # Finally, grant the group read-only access to the systemview view. # group context sec.model sec.level prefix read write notif access notConfigGroup "" any noauth exact systemview none none
 #view systemview included system. view all included # Finally, grant the group read-only access to the systemview view. # group context sec.model sec.level prefix read write notif. access notConfigGroup any noauth exact systemview none none.")
36
Sample snmpd.conf file rocommunity bow com2sec local localhost bow
com2sec mynetwork /24 bow group myRwgroup any local group myRogroup any mynetwork view all included access myRogroup "" any noauth all none none access myRwgroup "" any noauth all all all

37
Start your Snmp server and test it
# chkconfig snmpd on Start the service snmpd (#service snmpd start) Run snmpwalk utility to request for a tree of info about network entity (query snmp server for your IP address assigned to etho, eth1, lo) #snmpwalk -c bow -v 1 localhost
 Run snmpwalk utility to request for a tree of info about network entity (query snmp server for your IP address assigned to etho, eth1, lo) #snmpwalk -c bow -v 1 localhost.")
38
Install mrtg Installing with RPM is also easy. The package name may vary, but you simply use the command: rpm –Uvh mrtg mdk Create a work directory mkdir /var/www/mrtg chmod 755 /var/www/mrtg Create the mrtg configuration file # cfgmaker --global "WorkDir: /var/www/mrtg" \ --global "Options[_]: growright,bits" \ --ifref=ip \ > mrtg.cfg

39
Run mrtg using the Configuration file
#mrtg /var/www/mrtg/mrtg.cfg Note: You may get few warning message for first time; ignore them. Run mrtg about 3 times View the graph using a browser file//mrtg

40
THANK YOU

Similar presentations


 © Abdou Illia, Spring 2006.>")


>")