Download presentation
Presentation is loading. Please wait.

1
Chapter 6 – Political Participation

2
A Closer Look at Nonvoting
The Problem? – 50% of Americans vote in Presidential Election, 35%-40% in Congressional Elections In Europe 80% vote in most elections Apathy the cause or are we just plain lazy? This info is slightly exaggerated - 1984 Survey Says - voting age population turnout 52.6% Registered voters 86.8% 86.8% clearly rules out apathy as a cause The real problem low percentage of adults are registered to vote

3
A Closer Look at Nonvoting
Apathy? I don’t care about apathy. The book says a cause is the high cost to register to vote. Congressional solution Motor Voter (Mixed results in states) Republicans 95% oppose Motor Voter Democrats 95% approve Help America Vote Act - Republican “scheme”
 Republicans 95% oppose Motor Voter Democrats 95% approve. Help America Vote Act - Republican scheme")
4
In this painting, we see the judge (top center) administering an oath to a voter. The voter (in red) is swearing, with his hand on the bible, that he is entitled to vote and has not already done so. There was no system of voter registration, so this oath and the possibility that the judge or someone else in the vicinity of the polls might recognize him if he came back was all that prevented a voter from voting again and again.
 is swearing, with his hand on the bible, that he is entitled to vote and has not already done so. There was no system of voter registration, so this oath and the possibility that the judge or someone else in the vicinity of the polls might recognize him if he came back was all that prevented a voter from voting again and again..")
6
The first official use of a lever type voting machine, known then as the "Myers Automatic Booth," occurred in Lockport, New York in Four years later, they were employed on a large scale in the city of Rochester, New York, and soon were adopted statewide. By 1930, lever machines had been installed in virtually every major city in the United States, and by the 1960’s well over half of the Nation’s votes were being cast on these machines.

7
The Rise of the American Electorate
white male landowners 1829 Andrew Jackson expanded the electorate to include all adult males 21+ Most other minorities and women in most states continued to not have suffrage You cannot vote if convicted of a felony or if former occupation is a Confederate General

8
From State to Federal Control
Elections were a mess at first – Congressional candidates were picked by district, at large, plurality, majority, even/odd years Federal government steps in to create control – Districts only, even years, majority vote, first Tuesday in November.

9
From State to Federal Control
15th Amendment – States cannot deny the right to vote 19th Amendment – Women gain suffrage 17th Amendment - direct election of Senators by the electorate 23rd Amendment - District of Columbia gets to vote for the President 24th Amendment - no poll taxes in federal elections 26th Amendment - 18 year-olds get the right to vote (Vietnam War is the key issue) Literacy tests, Poll Tax, Grandfather Clause, White Primaries
 Literacy tests, Poll Tax, Grandfather Clause, White Primaries.")
10
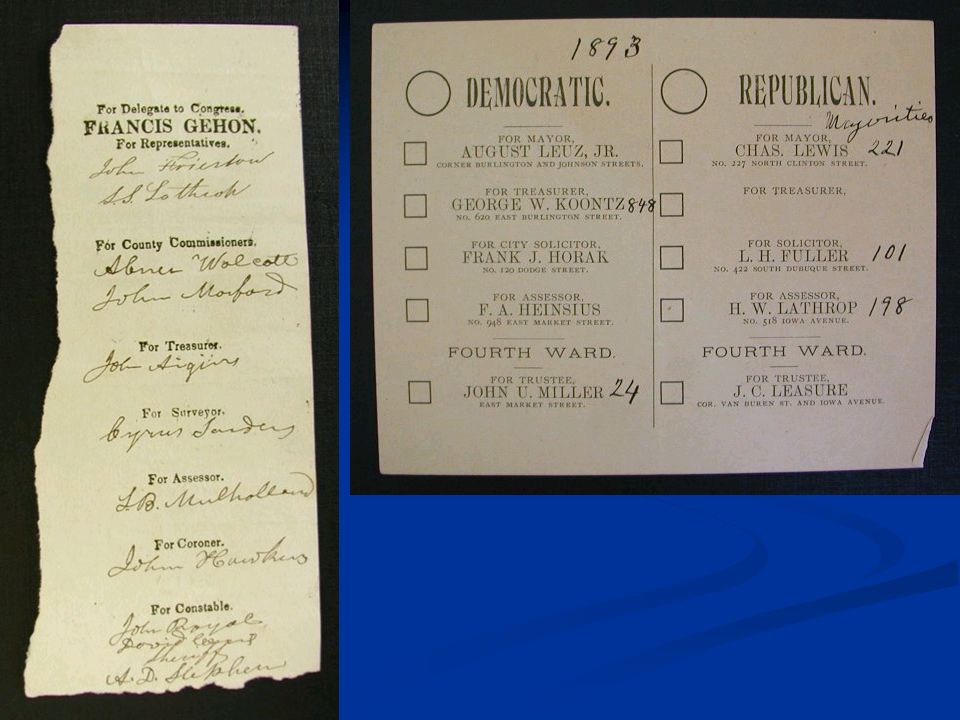
Voter Turn Out Between 50%-60% turn out still very low Theory 1 – Really… no one cares, political parties are to similar In the late 1800’s Republican domination of national politics made races boring Statistics are very skewed because “vote early vote often” applied (Boss Tweed) Australian Ballot – Government Printed Standardized ballot more and more regulations made voting more burdensome
 Australian Ballot – Government Printed Standardized ballot more and more regulations made voting more burdensome.")
11
Who Participates in Politics?
Forms of Participation 22% - Completely inactive - Do nothing (poor, uneducated, young, usually A.A.) Voting Specialists – Vote but do little else (older, less schooling, poorer) Campaigners – get involved in campaigns, know what they want and how the side Communalists – very involved in community but not politics (to much conflict) Parochial Participants – don’t vote but feel the need to contact elected officials 11% - Activists - Do everything (well educated, high incomes, middle aged
 Voting Specialists – Vote but do little else (older, less schooling, poorer) Campaigners – get involved in campaigns, know what they want and how the side Communalists – very involved in community but not politics (to much conflict) Parochial Participants – don’t vote but feel the need to contact elected officials 11% - Activists - Do everything (well educated, high incomes, middle aged.")
20
The Causes of Participation
People with more schooling more likely to vote Churchgoers vote more Men and women vote the same Whites vote more than AA In equal socio-economic backgrounds, blacks vote more (A.A have less faith in the system) If AA all came out and voted, the power structure in America would shift
 If AA all came out and voted, the power structure in America would shift.")
21
1960 109,159,000 68,838,204 63.06% 1964 114,090,000 70,644,592 60.92% 1968 120,328,186 73,199,998 60.83% 1972 140,776,000 77,718,554 55.21% 1976 152,309,190 81,555,789 53.55% 1980 164,597,000 86,515,221 52.56% 1984 174,466,000 92,652,680 53.11% 1988 182,778,000 91,594,693 50.11% 1992 189,529,000 104,405,155 55.09% 1996 196,511,000 96,456,345 49.08% 2000 205,815,000 105,586,274 51.31% 2004 215,694,000 122,295,345 56.70% 2008 126,500, ,500,000 (estimate[1]) 64.10%
 64.10%")
22
The Meaning of Participation Rates
Percentages are lower here than other countries however we hold more elections and elect more representatives than any other country Americans also participate more in the political process here than abroad

23
Summary Americans do not vote – false
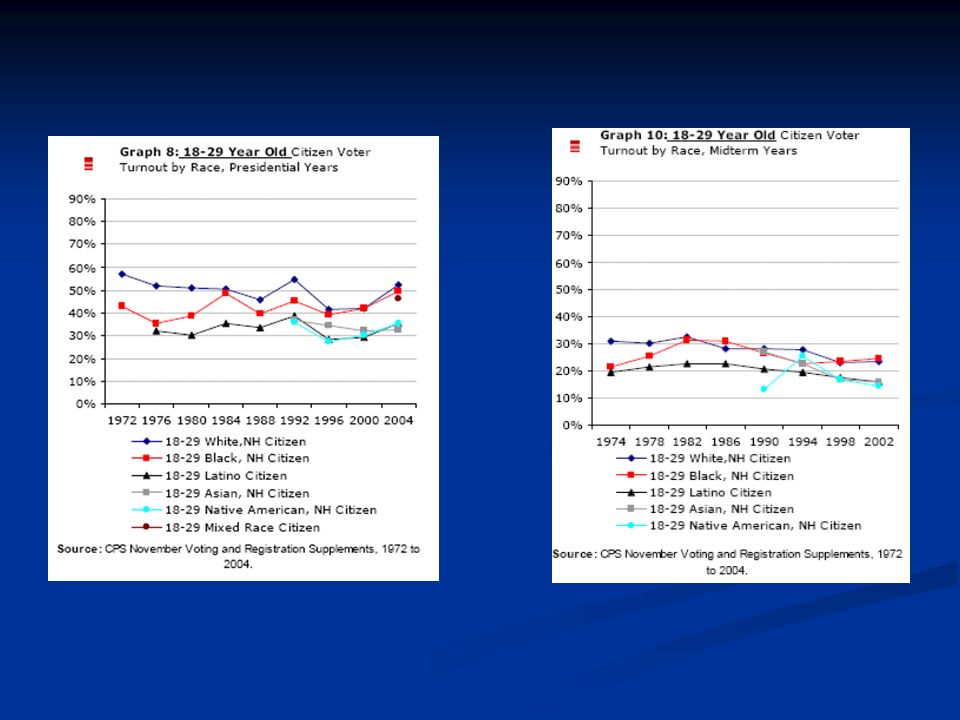
Americans do not register to vote – true Once registered age, race and party organization determine rates Schooling and information are most powerful determinations If you depend on the youth of this nation to vote you will lose

Similar presentations


: Voting Age Population = 57% / 38% Voting Eligible Population = 61% / 41%>")


