Download presentation
Presentation is loading. Please wait.

1
INFRARED ABSORPTION SPECTROSCOPY
Semester Dec – Apr 2010 INFRARED ABSORPTION SPECTROSCOPY

2
Learning Outcomes By the end of this topic, students should be able to: Explain the principles and the working mechanism of infrared (IR) absorption spectroscopy Identify the molecular species that absorb IR radiation Interpret IR spectrum Explain stretching and bending vibrations in relation to IR absorption Determine unknown qualitatively using IR absorption Draw a schematic diagram of a conventional IR instrument and a fourier transform IR instrument and explain the function of each component of the instrument Differentiate between a dispersive IR instrument and a FTIR spectrometer
 absorption spectroscopy. Identify the molecular species that absorb IR radiation. Interpret IR spectrum. Explain stretching and bending vibrations in relation to IR absorption. Determine unknown qualitatively using IR absorption. Draw a schematic diagram of a conventional IR instrument and a fourier transform IR instrument and explain the function of each component of the instrument. Differentiate between a dispersive IR instrument and a FTIR spectrometer.")
3
Infrared spectroscopy
Mostly for qualitative analysis Absorption spectra is recorded as transmittance spectra Absorption in the infrared region arise from molecular vibrational transitions Absorption at specific wavelengths Thus, IR spectra provides more specific qualitative information IR spectra is called “fingerprints” - because no other chemical species will have identical IR spectrum

4
Comparison between transmittance (upper) vs absorbance (lower) plot
The transmittance spectra provide better contrast btw intensities of strong and weak bands compared to absorbance spectra

5
Electromagnetic Spectrum
Energy of IR photon insufficient to cause electronic excitation but can cause vibrational excitation

6
INTRODUCTION Comparison between UV-vis and IR
Energy: UV > vis > IR Frequency: UV > vis > IR Wavelength: UV < vis < IR

7
INFRARED SPECTROSCOPY
Infrared (IR) spectroscopy deals with the interaction of infrared radiation with matter IR spectrum provides: Important information about its chemical nature and molecular structure IR applicability: Analysis of organic materials Polyatomic inorganic molecules Organometallic compounds
 spectroscopy deals with the interaction of infrared radiation with matter. IR spectrum provides: Important information about its chemical nature and molecular structure. IR applicability: Analysis of organic materials. Polyatomic inorganic molecules. Organometallic compounds.")
8
IR region of EM spectrum: λ: 780 nm – 1000 μm
Wavenumber: 12,800 – 10cm-1 IR region subdivided into 3 subregions: 1. Near IR region (Nearest to the visible) - 780 nm to 2.5 μm (12,800 to 4000 cm-1) 2. Mid IR region - 2.5 to 50 μm (4000 – 200 cm-1) 3. Far IR region - 50 to 1000 μm (200 – 10cm-1) visible NEAR MID infrared FAR 8 microwave
 nm to 2.5 μm (12,800 to 4000 cm-1) 2. Mid IR region to 50 μm (4000 – 200 cm-1) 3. Far IR region to 1000 μm (200 – 10cm-1) visible. NEAR. MID. infrared. FAR. 8. microwave.")
9
When IR absorption occur?
1. IR absorption only occurs when IR radiation interacts with a molecule undergoing a change in dipole moment as it vibrates or rotates. 2. Infrared absorption only occurs when the incoming IR photon has sufficient energy for the transition to the next allowed vibrational state Note: If the 2 rules above are not met, no absorption can occur

10
What happen when a molecule absorbs infrared radiation?
Absorption of IR radiation corresponds to energy changes on the order of 8 to 40 kJ/mole. - Radiation in this energy range corresponds to stretching and bending vibrational frequencies of the bonds in most covalent molecules. In the absorption process, those frequencies of IR radiation which match the natural vibrational frequencies of the molecule are absorbed. The energy absorbed will increase the amplitude of the vibrational motions of the bonds in the molecule.

11
NOT ALL bonds in a molecule are capable of absorbing IR energy
NOT ALL bonds in a molecule are capable of absorbing IR energy. Only those bonds that have change in dipole moment are capable to absorb IR radiation. The larger the dipole change, the stronger the intensity of the band in an IR spectrum.

12
What is a dipole moment? is a measure of the extent to which a separation exists between the centers of positive and negative charge within a molecule. δ- δ+ δ+

13
In heteronuclear diatomic molecule, because of the difference in electronegativities of the two atoms, one atom acquires a small positive charge (q+), the other a negative charge (q-). This molecule is then said to have a dipole moment whose magnitude, μ =qd distance of separation of the charge

14
Molecular Species That Absorb Infrared Radiation
Compound absorb in IR region Organic compounds, carbon monoxide Compounds DO NOT absorb in IR region O2, H2, N2, Cl2

15
IR Vibrational Modes

16
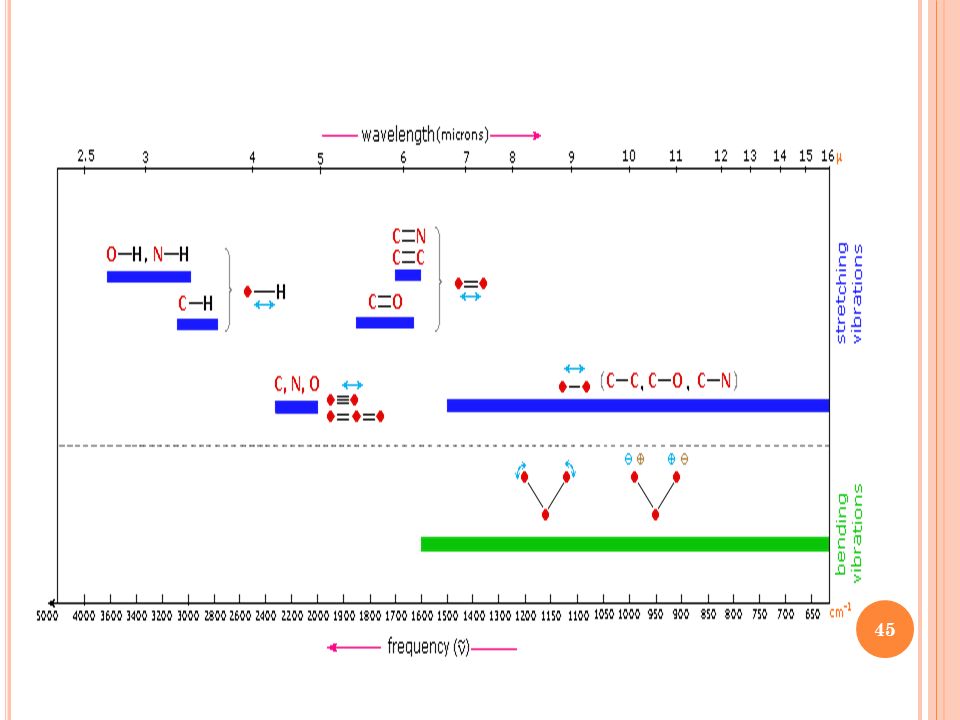
Molecular vibration divided into stretching bending wagging scissoring
back & forth movement involves change in bond angles stretching bending wagging scissoring symmetrical asymmetrical rocking twisting in-plane vibration out of plane vibration

17
STRETCHING

18
BENDING

19
Sample Handling Techniques
Gases evacuated cylindrical cells equipped with suitable windows Liquid sodium chloride windows “neat” liquid Solid Pellet (KBr) Mull
 Mull.")
20
LIQUID a drop of the pure (neat) liquid is squeezed between two rock-salt plates to give a layer that has thickness 0.01mm or less 2 plates held together by capillary mounted in the beam path What is meant by “neat” liquid? Neat liquid is a pure liquid that do not contain any solvent or water. This method is applied when the amount of liquid is small or when a suitable solvent is unavailable

21
Solid sample preparation
There are three ways to prepare solid sample for IR spectroscopy. Solid that is soluble in solvent can be dissolved in a solvent, most commonly carbon tetrachloride CCl4. Solid that is insoluble in CCl4 or any other IR solvents can be prepared either by KBr pellet or mulls.

22
PELLETING (KBr PELLET) Mixing the finely ground solid sample with potassium bromide (KBr) and pressing the mixture under high pressure (10,000 – 15,000 psi) in special dye. KBr pellet can be inserted into a holder in the spectrometer.
 and pressing the mixture under high pressure (10,000 – 15,000 psi) in special dye. KBr pellet can be inserted into a holder in the spectrometer.")
23
MULLS Formed by grinding 2-5 mg finely powdered sample, presence 1 or 2 drops of a heavy hydrocarbon oil (Nujol) Mull examined as a film between flat salt plates This method applied when solid not soluble in an IR transparent solvent, also not convenient pelleted in KBr

24
What is a mull What is Nujol
A thick paste formed by grinding an insoluble solid with an inert liquid and used for studying spectra of the solid What is Nujol A trade name for a heavy medicinal liquid paraffin. Extensively used as a mulling agent in spectroscopy

25
Instrumentation

26
IR Instrument Dispersive spectrometers Fourier Transform spectrometers
sequential mode Fourier Transform spectrometers simultaneous analysis of the full spectra range using inferometry

27
IR Instrument (Dispersive)
Important components in IR dispersive spectrometer 5 1 2 3 4 signal processor & readout source lamp sample holder λ selector detector Detector: - Thermocouple - Pyroelectric transducer - Thermal transducer Source: - Nernst glower - Globar source - Incandescent wire

28
Radiation Sources generate a beam with sufficient power in the λ region of interest to permit ready detection & measurement provide continuous radiation; made up of all λ’s with the region (continuum source) stable output for the period needed to measure both P0 and P
 stable output for the period needed to measure both P0 and P.")
29
Schematic Diagram of a Double Beam Infrared Spectrophotometer

30
FTIR Fourier Transform Infrared

31
FTIR Why is it developed?
to overcome limitations encountered with the dispersive instruments especially slow scanning speed; due to individual measurement of molecules/atom utilize an interferometer

32
Interferometer Special instrument which can read IR frequencies simultaneously faster method than dispersive instrument interferograms are transformed into frequency spectrums by using mathematical technique called Fourier Transformation FT Calculations interferograms IR spectrum

33
Components of Fourier Transform Instrument
- majority of commercially available Fourier transform infrared instruments are based upon Michelson interferometer 3 4 1 2 5 6

34
Advantages (over dispersive instrument)
high sensitivity high resolution speed of data acquisition ( data for an entire spectrum can be obtained in 1 s or less)
")
35
Interpretation Infrared Spectra

36
Infrared Spectra IR spectrum is due to specific structural features, a specific bond, within the molecule, since the vibrational states of individual bonds represent 1 vibrational transition. e.g. IR spectrum can tell the molecule has an O-H bond or a C=O or an aromatic ring

37
Infrared Spectra

38
How to Interpret Infrared Spectra?

39
How to analyze IR spectra
Begin by looking in the region from Look at the C–H stretching bands around 3000: Indicates: Are any or all to the right of 3000? alkyl groups (present in most organic molecules) Are any or all to the left of 3000? a C=C bond or aromatic group in the molecule
 Are any or all to the left of 3000 a C=C bond or aromatic group in the molecule.")
40
2. Look for a carbonyl in the region 1760-1690.
If there is such a band: Indicates: Is an O–H band also present? a carboxylic acid group Is a C–O band also present? an ester Is an aldehyde C–H band also present? an aldehyde Is an N–H band also present? an amide Are none of the above present? a ketone (also check the exact position of the carbonyl band for clues as to the type of carbonyl compound it is)
")
41
Indicates: Is an O–H band present? an alcohol or phenol Indicates:
3. Look for a broad O–H band in the region cm-1. If there is such a band: Indicates: Is an O–H band present? an alcohol or phenol 4. Look for a single or double sharp N–H band in the region cm-1. If there is such a band: Indicates: Are there two bands? a primary amine Is there only one band? a secondary amine

42
5. Other structural features to check for:
Indicates: Are there C–O stretches? an ether (or an ester if there is a carbonyl band too) Is there a C=C stretching band? an alkene Are there aromatic stretching bands? an aromatic Is there a C≡C band? an alkyne Are there -NO2 bands? a nitro compound
 Is there a C=C stretching band an alkene. Are there aromatic stretching bands an aromatic. Is there a C≡C band an alkyne. Are there -NO2 bands a nitro compound.")
43
How to analyze IR spectra
If there is an absence of major functional group bands in the region cm-1 (other than C–H stretches), the compound is probably a strict hydrocarbon. Also check the region from cm-1. Aromatics, alkyl halides, carboxylic acids, amines, and amides show moderate or strong absorption bands (bending vibrations) in this region. As a beginning student, you should not try to assign or interpret every peak in the spectrum. Concentrate on learning the major bands and recognizing their presence and absence in any given spectrum.
, the compound is probably a strict hydrocarbon. Also check the region from cm-1. Aromatics, alkyl halides, carboxylic acids, amines, and amides show moderate or strong absorption bands (bending vibrations) in this region. As a beginning student, you should not try to assign or interpret every peak in the spectrum. Concentrate on learning the major bands and recognizing their presence and absence in any given spectrum.")
46
ALKANE

47
C-H Stretch for sp3 C-H around 3000 – 2840 cm-1.
CH2 Methylene groups have a characteristic bending absorption at approx 1465 cm-1 CH3 Methyl groups have a characteristic bending absorption at approx 1375 cm-1 CH2 The bending (rocking) motion associated with four or more CH2 groups in an open chain occurs at about 720 cm-1
 motion associated with four or more CH2 groups in an open chain occurs at about 720 cm-1.")
48
ALKENE

49
ALKENE =C-H Stretch for sp2 C-H occurs at values greater than 3000 cm-1. =C-H out-of-plane (oop) bending occurs in the range 1000 – 650 cm-1 C=C stretch occurs at 1660 – 1600 cm-1; often conjugation moves C=C stretch to lower frequencies and increases the intensity

50
ALKYNE

51
ALKYNE Stretch for sp C - H occurs near 3300 cm-1.
Stretch occurs near 2150 cm-1; conjugation moves stretch to lower frequency.

52
AROMATIC RINGS Stretch for sp2 C-H occurs at values greater than 3000 cm-1. Ring stretch absorptions occur in pairs at 1600 cm-1 and 1475 cm-1. Bending occurs at cm-1.

53
AROMATIC RINGS

54
C-H Bending ( for Aromatic Ring)
The out-of-plane (oop) C-H bending is useful in order to assign the positions of substituents on the aromatic ring. Monosubstituted rings this substitution pattern always gives a strong absorption near 690 cm-1. If this band is absent, no monosubstituted ring is present. A second strong band usually appears near 750 cm-1. Ortho-Disubstituted rings one strong band near 750 cm-1. Meta- Disubstituted rings gives one absorption band near 690 cm-1 plus one near 780 cm-1. A third band of medium intensity is often found near 880 cm-1. Para- Disubstituted rings - one strong band appears in the region from 800 to 850 cm-1.
 C-H bending is useful in order to assign the positions of substituents on the aromatic ring. Monosubstituted rings. this substitution pattern always gives a strong absorption near 690 cm-1. If this band is absent, no monosubstituted ring is present. A second strong band usually appears near 750 cm-1. Ortho-Disubstituted rings. one strong band near 750 cm-1. Meta- Disubstituted rings. gives one absorption band near 690 cm-1 plus one near 780 cm-1. A third band of medium intensity is often found near 880 cm-1. Para- Disubstituted rings. - one strong band appears in the region from 800 to 850 cm-1.")
55
Ortho-Disubstituted rings
Bending observed as one strong band near 750 cm-1.

56
Meta- Disubstituted rings
- gives one absorption band near 690 cm-1 plus one near 780 cm-1. A third band of medium intensity is often found near 880 cm-1.

57
Para- Disubstituted rings
- one strong band appears in the region from 800 to 850 cm-1.

58
ALCOHOL Primary alcohol 10 Secondary alcohol 20 Tertiary alcohol 30

59
ALCOHOL O-H The hydrogen-bonded O-H band is a broad peak at 3400 – 3300 cm-1. This band is usually the only one present in an alcohol that has not been dissolved in a solvent (neat liquid). C-O-H Bending appears as a broad and weak peak at 1440 – 1220 cm-1 often obscured by the CH3 bendings. C-O Stretching vibration usually occurs in the range 1260 – 1000 cm-1. This band can be used to assign a primary, secondary or tertiary structure to an alcohol.
. C-O-H Bending appears as a broad and weak peak at 1440 – 1220 cm-1 often obscured by the CH3 bendings. C-O Stretching vibration usually occurs in the range 1260 – 1000 cm-1. This band can be used to assign a primary, secondary or tertiary structure to an alcohol.")
60
PHENOL

61
PHENOL

63
ETHER C-O The most prominent band is that due to C-O stretch, 1300 – 1000 cm-1. Absence of C=O and O-H is required to ensure that C-O stretch is not due to an ester or an alcohol. Phenyl alkyl ethers give two strong bands at about 1250 – 1040 cm-1, while aliphatic ethers give one strong band at about 1120 cm-1.

65
CARBONYL COMPOUNDS cm-1 1810 1800 1760 1735 1725 1715 1710 1690
Anhydride Acid Anhydride Ester Aldehyde Ketone Carboxylic Amide (band 1) Chloride (band 2) acid Normal base values for the C=O stretching vibrations for carbonyl groups
 Chloride (band 2) acid. Normal base values for the C=O stretching vibrations for carbonyl groups.")
66
A. ALDEHYDE C=O stretch appear in range cm-1 for normal aliphatic aldehydes Conjugation of C=O with phenyl; 1700 – 1660 cm-1 for C=O and 1600 – 1450 cm-1 for ring (C=C) C-H Stretch, aldehyde hydrogen (-CHO), consists of weak bands, one at cm-1 and the other at 2760 – 2700 cm-1.
 C-H Stretch, aldehyde hydrogen (-CHO), consists of weak bands, one at cm-1 and. the other at 2760 – 2700 cm-1.")
68
B. KETONE C=O stretch appear in range cm-1 for normal aliphatic ketones Conjugation of C=O with phenyl; 1700 – 1680 cm-1 for C=O and 1600 – 1450 cm-1 for ring (C=C)
")
70
C. CARBOXYLIC ACID

72
D. ESTER C=O stretch appear in range cm-1 for normal aliphatic esters Conjugation of C=O with phenyl; 1740 – 1715 cm-1 for C=O and 1600 – 1450 cm-1 for ring (C=C) C – O Stretch in two or more bands, one stronger and broader than the other, occurs in the range 1300 – 1000 cm-1
 C – O Stretch in two or more bands, one stronger and broader than the other, occurs in the range 1300 – 1000 cm-1.")
74
E. AMIDE 10 20 30

75
AMIDE

76
Acid chloride show a very strong band for the C=O group.
F. ACID CHLORIDE Stretch appear in range cm-1 in conjugated chlorides. Conjugation lowers the frequency to 1780 – 1760 cm-1 Stretch occurs in the range cm-1 Acid chloride show a very strong band for the C=O group.

77
F. ANHYDRIDE Stretch always has two bands, cm-1 and 1775 – 1740 cm-1, with variable relative intensity. Conjugation moves the absorption to a lower frequency. Ring strain (cyclic anhydride) moves absorptions to a higher frequency. Stretch (multiple bands) occurs in the range cm-1
 moves absorptions to a higher frequency. Stretch (multiple bands) occurs in the range cm-1.")
78
AMINE 20 10 30

79
AMINE Stretching occurs in the range 3500 – 3300 cm-1.
Primary amines have two bands. Secondary amines have one band: a vanishingly weak one for aliphatic compounds and a stronger one for aromatic secondary amines. Tertiary amines have no N – H stretch. N – H Bending in primary amines results in a broad band in the range 1640 – 1560 cm-1. Secondary amines absorb near 1500 cm-1 N – H N – H Out-of-plane bending absorption can sometimes be observed near 800 cm-1 Stretch occurs in the range 1350 – 1000 cm-1 C – N

80
Primary Amine Secondary Amine

81
Tertiary Amine Aromatic Amine

Similar presentations


>")
>")