Download presentation
Presentation is loading. Please wait.

1
The Atmosphere and Air Pollution

2
Origin of Modern Atmosphere
original atmosphere surrounded the homogenous planet Earth and probably was composed of H and He second atmosphere evolved from gases from molten Earth H2O, CO2, SO2, CO, S2, Cl2, N2, H2, NH3, and CH4 allowed formation of oceans and earliest life modern Atmosphere evolved after Cyanobacteria started photosynthesizing oxygen produced did not reach modern levels until about 400 million years ago

3
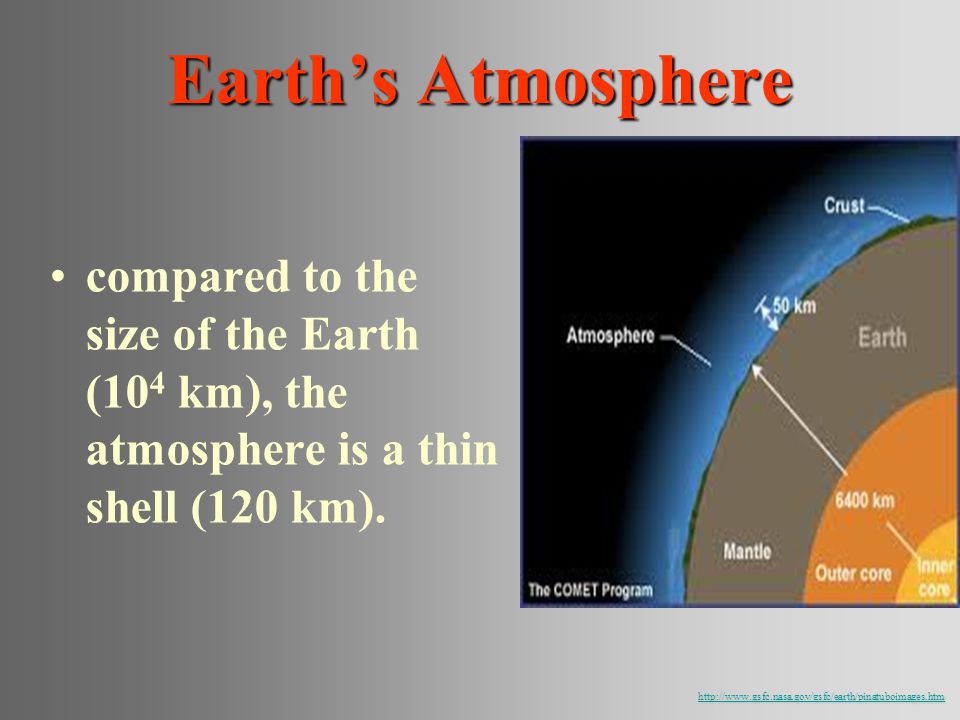
Earth’s Atmosphere compared to the size of the Earth (104 km), the atmosphere is a thin shell (120 km).
4
Atmosphere Layers Exosphere Thermosphere (Ionosphere) Mesosphere
Stratosphere Troposphere

5
Troposphere 8 to 14.5 kilometers high (5 to 9 miles) most dense
the temperature drops from about 17 to - 52 degrees Celsius almost all weather is in this region

6
Stratosphere extends to 50 kilometers (31 miles) high
dry and less dense temperature in this region increases gradually to -3 degrees Celsius, due to the absorption of ultraviolet radiation ozone layer absorbs and scatters the solar ultraviolet radiation ninety-nine percent of "air" is located in first two layers every 1000-m 11% less air pressure

7
Composition Nitrogen (N2, 78%) Oxygen (O2, 21%) Argon (Ar, 1%)
myriad of other very influential components are also present which include the Water (H2O, %), "greenhouse" gases or Ozone (O3, %), Carbon Dioxide (CO2, %),
, greenhouse gases or Ozone (O3, %), Carbon Dioxide (CO2, %),")
8
Importance of the Atmosphere
Physicists physical properties and processes that take place between the radiant energy and atmospheric gases Chemists behavior of the chemical materials in the atmosphere the ways in which lightning causes the formation of substances chemistry of the ozone layer and of chemicals introduced from industrial processes

9
Astronomers and space scientists
the layer through which they must peer before entering the realms of space Meteorologists, climatologists and geographers lower layers of the atmosphere predicting the weather investigating climatic regions examine the effects of climate and weather on human society

10
Outdoor Air Pollution

11
Primary Pollutants Secondary Pollutants Sources Natural Stationary CO CO2 SO2 NO NO2 Most hydrocarbons Most suspended particles SO3 HNO3 H2SO4 H2O2 O3 PANs Most and salts NO3 – Mobile SO4 2

12
Major Sources of Primary Pollutants
Stationary Sources Combustion of fuels for power and heat – Power Plants Other burning such as Wood & crop burning or forest fires Industrial/ commercial processes Solvents and aerosols Mobile Sources Highway: cars, trucks, buses and motorcycles Off-highway: aircraft, boats, locomotives, farm equipment, RVs, construction machinery, and lawn mowers

13
Source: http://www.epa.gov/air/oaqps/takingtoxics/p1.html#1
Scientists estimate that millions of tons of toxic pollutants are released into the air each year. Most air toxics originate from manmade sources, including both mobile sources (e.g., cars, buses, trucks) and stationary sources (e.g., factories, refineries, power plants). However, some are released in major amounts from natural sources such as forest fires. Routine emissions from stationary sources constitute almost one-half of all manmade air toxics emissions.
 and stationary sources (e.g., factories, refineries, power plants). However, some are released in major amounts from natural sources such as forest fires. Routine emissions from stationary sources constitute almost one-half of all manmade air toxics emissions.")
14
54 million metric tons from mobile sources in 1990
There are two types of stationary sources that generate routine emissions of air toxics: "Major" sources are defined as sources that emit 10 tons per year of any of the listed toxic air pollutants, or 25 tons per year of a mixture of air toxics. Examples include chemical plants, steel mills, oil refineries, and hazardous waste incinerators. These sources may release air toxics from equipment leaks, when materials are transferred from one location to another, or during discharge through emissions stacks or vents. One key public health concern regarding major sources is the health effects on populations located downwind from them. "Area" sources consist of smaller sources, each releasing smaller amounts of toxic pollutants into the air. Area sources are defined as sources that emit less than 10 tons per year of a single air toxic, or less than 25 tons per year of a mixture of air toxics. Examples include neighborhood dry cleaners and gas stations. Though emissions from individual area sources are often relatively small, collectively their emissions can be of concern—particularly where large numbers of sources are located in heavily populated areas. EPA’s published list of "source categories" now contains 175 categories of industrial and sources that emit one or more toxic air pollutants. For each of these source categories, EPA indicated whether the sources are considered to be "major" sources or "area" sources. The 1990 Clean Air Act Amendments direct EPA to set standards requiring all major sources of air toxics (and some area sources that are of particular concern) to significantly reduce their air toxics emissions.
 to significantly reduce their air toxics emissions.")
15
Human Impact on Atmosphere
Burning Fossil Fuels Using Nitrogen fertilizers and burning fossil fuels Refining petroleum and burning fossil fuels Manufacturing Adds CO2 and O3 to troposphere Global Warming Altering Climates Produces Acid Rain Releases NO, NO2, N2O, and NH3 into troposphere Produces acid rain Releases SO2 into troposphere Releases toxic heavy metals (Pb, Cd, and As) into troposphere air/products.html
 into troposphere. air/products.html.")
16
Criteria Air Pollutants
EPA uses six "criteria pollutants" as indicators of air quality Nitrogen Dioxide: NO2 Ozone: ground level O3 Carbon monoxide: CO Lead: Pb Particulate Matter: PM10 (PM 2.5) Sulfur Dioxide: SO2 Volatile Organic Compounds: (VOCs) EPA established for each concentrations above which adverse effects on health may occur
 Sulfur Dioxide: SO2. Volatile Organic Compounds: (VOCs) EPA established for each concentrations above which adverse effects on health may occur.")
17
Nitrogen Dioxide (NO2) Properties: reddish brown gas, formed as fuel burnt in car, strong oxidizing agent, forms Nitric acid in air Effects: acid rain, lung and heart problems, decreased visibility (yellow haze), suppresses plant growth Sources: fossil fuels combustion, power plants, forest fires, volcanoes, bacteria in soil Class: Nitrogen oxides (NOx) EPA Standard: ppm
, suppresses plant growth. Sources: fossil fuels combustion, power plants, forest fires, volcanoes, bacteria in soil. Class: Nitrogen oxides (NOx) EPA Standard: ppm.")
18
Mobile Source Emissions: Nitrogen Oxides

19
Ozone (O3) Properties: colorless, unpleasant odor, major part of photochemical smog Effects: lung irritant, damages plants, rubber, fabric, eyes, 0.1 ppm can lower PSN by 50%, Sources: Created by sunlight acting on NOx and VOC , photocopiers, cars, industry, gas vapors, chemical solvents, incomplete fuel combustion products Class: photochemical oxidants

20
Ozone (O3) 10,000 to 15,000 people in US admitted to hospitals each year due to ozone- related illness Children more susceptible Airways narrower More time spent outdoors

21
Mobile Source Emissions: Hydrocarbons – Precursors to Ozone

22
Carbon Monoxide (CO) Properties: colorless, odorless, heavier than air, % of atmosphere Effects: binds tighter to Hb than O2, mental functions and visual acuity, even at low levels Sources: incomplete combustion of fossil fuels % from auto exhaust Class: carbon oxides (CO2, CO) EPA Standard: 9 ppm 5.5 billion tons enter atmosphere/year
 EPA Standard: 9 ppm. 5.5 billion tons enter atmosphere/year.")
23
Mobile Source Emissions - CO

24
Lead (Pb) Properties: grayish metal
Effects: accumulates in tissue; affects kidneys, liver and nervous system (children most susceptible); mental retardation; possible carcinogen; 20% of inner city kids have [high] Sources: particulates, smelters, batteries Class: toxic or heavy metals EPA Standard: 1.5 ug/m3 2 million tons enter atmosphere/year
; mental retardation; possible carcinogen; 20% of inner city kids have [high] Sources: particulates, smelters, batteries. Class: toxic or heavy metals. EPA Standard: 1.5 ug/m3. 2 million tons enter atmosphere/year.")
25
Suspended Particulate Matter (PM10)
Properties: particles suspended in air (<10 um) Effects: lung damage, mutagenic, carcinogenic, teratogenic Sources: burning coal or diesel, volcanoes, factories, unpaved roads, plowing, lint, pollen, spores, burning fields Class: SPM: dust, soot, asbestos, lead, PCBs, dioxins, pesticides EPA Standard: 50 ug/m3 (annual mean)
 Effects: lung damage, mutagenic, carcinogenic, teratogenic. Sources: burning coal or diesel, volcanoes, factories, unpaved roads, plowing, lint, pollen, spores, burning fields. Class: SPM: dust, soot, asbestos, lead, PCBs, dioxins, pesticides. EPA Standard: 50 ug/m3 (annual mean)")
26
Mobile Source Emissions: Fine Particulate Matter (PM2.5)
")
27
Sulfur Dioxide (SO2) Properties: colorless gas with irritating odor
Effects: produces acid rain (H2SO4), breathing difficulties, eutrophication due to sulfate formation, lichen and moss are indicators Sources: burning high sulfur coal or oil, smelting or metals, paper manufacture Class: sulfur oxides EPA Standard: 0.3 ppm (annual mean) Combines with water and NH4 to increase soil fertility
, breathing difficulties, eutrophication due to sulfate formation, lichen and moss are indicators. Sources: burning high sulfur coal or oil, smelting or metals, paper manufacture. Class: sulfur oxides. EPA Standard: 0.3 ppm (annual mean) Combines with water and NH4 to increase soil fertility.")
28
VOCs (Volatile Organic Compounds)
Properties: organic compounds (hydrocarbons) that evaporate easily, usually aromatic Effects: eye and respiratory irritants; carcinogenic; liver, CNS, or kidney damage; damages plants; lowered visibility due to brown haze; global warming Sources: vehicles (largest source), evaporation of solvents or fossil fuels, aerosols, paint thinners, dry cleaning Class: HAPs (Hazardous Air Pollutants) Methane Benzene Chlorofluorocarbons (CFCs), etc. Concentrations indoors up to 1000x outdoors 600 million tons of CFCs
 that evaporate easily, usually aromatic. Effects: eye and respiratory irritants; carcinogenic; liver, CNS, or kidney damage; damages plants; lowered visibility due to brown haze; global warming. Sources: vehicles (largest source), evaporation of solvents or fossil fuels, aerosols, paint thinners, dry cleaning. Class: HAPs (Hazardous Air Pollutants) Methane. Benzene. Chlorofluorocarbons (CFCs), etc. Concentrations indoors up to 1000x outdoors. 600 million tons of CFCs.")
29
Other Air Pollutants Carbon dioxide ChloroFluoroCarbons Formaldehyde
Benzene Asbestos Manganese Dioxins Cadmium Others not yet fully characterized

30
Factors that increase and/or decrease pollution
Local climate (inversions, air pressure, temperature, humidity) Topography (hills and mountains) Population density Amount of industry Fuels used by population and industry for heating, manufacturing, transportation, power Weather: rain, snow,wind Buildings (slow wind speed) Mass transit used Economics
 Topography (hills and mountains) Population density. Amount of industry. Fuels used by population and industry for heating, manufacturing, transportation, power. Weather: rain, snow,wind. Buildings (slow wind speed) Mass transit used. Economics.")
31
Thermal Inversion Pollutants • surface heated by sun
warm air cool air • surface heated by sun • warm air rises (incl. pollutants) • cools off, mixes with air of equal density & disperses warm air (inversion layer) • surface cools rapidly (night) • a layer of warm air overlays surface • polluted surface air rises but cannot disperse ⇒ remains trapped
 • cools off, mixes with air of equal. density & disperses. warm air (inversion layer) • surface cools rapidly (night) • a layer of warm air overlays surface. • polluted surface air rises but cannot. disperse ⇒ remains trapped.")
32
Smog Forms ...when polluted air is stagnant
(weather conditions, geographic location) Los Angeles, CA
 Los Angeles, CA.")
33
Pollution The term “Smog” (smoke and fog) was first used in 1905 to describe sulfur dioxide emission In 1952, severe pollution took the lives of 5000 people in London “It isn’t pollution that’s harming the environment. It’s the impurities in our air and water that are doing it.” Former U.S. Vice President Dan Quayle 97annual.html

34
Photochemical Smog UV radiation H2O + O2 Primary Pollutants
NO2 + Hydrocarbons Secondary Pollutants HNO3 O3 nitric acid ozone Photochemical Smog Auto Emissions

35
Ultraviolet radiation
Solar radiation Photochemical Smog Ultraviolet radiation NO Nitric oxide O Atomic oxygen O2 Molecular oxygen NO2 Nitrogen dioxide H2O Water Hydrocarbons PANs Peroxyacyl nitrates Aldehydes (e.g., formaldehyde) O3 Ozone HNO3 Nitric acid P h o t o c h e m i c a l S m o g
 O3. Ozone. HNO3. Nitric acid. P h o t o c h e m i c a l S m o g.")
36
Indoor Air Pollution

37
Why is indoor air quality important?
70 to 90% of time spent indoors, mostly at home Many significant pollution sources in the home (e.g. gas cookers, paints and glues) Personal exposure to many common pollutants is driven by indoor exposure Especially important for susceptible groups – e.g. the sick, old and very young
 Personal exposure to many common pollutants is driven by indoor exposure. Especially important for susceptible groups – e.g. the sick, old and very young.")
38
Exposure Time spent in various environments in US and less-developed countries

39
House of Commons Select Committee Enquiry on Indoor Air Pollution (1991)
“[There is] evidence that 3 million people have asthma in the UK… and this is increasing by 5% per annum.” “Overall there appears to be a worryingly large number of health problems which could be connected with indoor pollution and which affect very large numbers of the population.” [The Committee recommends that the Government] “develop guidelines and codes of practice for indoor air quality in buildings which specifically identify exposure limits for an extended list of pollutants…”

40
Sources of Indoor Air Pollutants
Building materials Furniture Furnishings and fabrics Glues Cleaning products Other consumer products Combustion appliances (cookers and heaters) Open fires Tobacco smoking Cooking House dust mites, bacteria and moulds Outdoor air
 Open fires. Tobacco smoking. Cooking. House dust mites, bacteria and moulds. Outdoor air.")
41
Important Indoor Air pollutants
Nitrogen dioxide Carbon monoxide Formaldehyde Volatile Organic Compounds (VOCs) House dust mites (and other allergens, e.g. from pets) Environmental tobacco smoke Fine particles Chlorinated organic compounds (e.g. pesticides) Asbestos and man-made mineral fibres Radon
 House dust mites (and other allergens, e.g. from pets) Environmental tobacco smoke. Fine particles. Chlorinated organic compounds (e.g. pesticides) Asbestos and man-made mineral fibres. Radon.")
42
Health Effects Nitrogen dioxide Respiratory irritant
Elevated risk of respiratory illness in children, perhaps resulting from increased susceptibility to respiratory infection; inconsistent evidence for effects in adults Concentrations in kitchens can readily exceed WHO and EPA standards

43
Health Effects Carbon monoxide An asphyxiant and toxicant
Hazard of acute intoxication, mostly from malfunctioning fuel-burning appliances and inadequate or blocked flues Possibility of chronic effects of long-term exposure to non- lethal concentrations, particularly amongst susceptible groups

44
Health Effects Formaldehyde
Sensory and respiratory irritant and sensitizer Possible increased risk of asthma and chronic bronchitis in children at higher exposure levels Individual differences in sensory and other transient responses Caution over rising indoor concentrations

45
Health Effects Volatile Organic Compounds (VOCs)
Occur in complex and variable mixtures Main health effects relate to comfort and well- being, but benzene (and other VOCs) are carcinogenic Concern about possible role of VOCs in the aetiology of multiple chemical sensitivity; also implicated in sick building syndrome
 are carcinogenic. Concern about possible role of VOCs in the aetiology of multiple chemical sensitivity; also implicated in sick building syndrome.")
46
Health Effects House dust mites
House dust mites produce Der p1 allergen, a potent sensitizer Good evidence of increased risk of sensitization with increasing allergen exposure, but this does not necessarily lead to asthma Small reductions in exposure will not necessarily lead to reduced incidence and/or symptoms Indoor humidity is important

47
Health Effects Fungi and bacteria
Dampness and mould-growth linked to self- reported respiratory conditions, but little convincing evidence for association between measured airborne fungi and respiratory disease Insufficient data to relate exposure to (non- pathogenic) bacteria to health effects in the indoor environment
 bacteria to health effects in the indoor environment.")
48
Health Effects Environmental tobacco smoke (ETS)
Sudden infant death syndrome Lower respiratory tract illness Middle ear disease Asthma 12 million children exposed to secondhand smoke in homes

49
Health Effects Fine particles
Consistent evidence that exposure to small airborne particles (e.g. PM10) in ambient air can impact on human health; mechanisms uncertain Chronic Obstructive Pulmonary Disease and Cardiovascular Disease patients and asthmatics probably at extra risk Relative importance of indoor sources is unknown
 in ambient air can impact on human health; mechanisms uncertain. Chronic Obstructive Pulmonary Disease and Cardiovascular Disease patients and asthmatics probably at extra risk. Relative importance of indoor sources is unknown.")
50
Health Effects Radon Can cause lung cancer
Estimated that 7,000 to 30,000 Americans die each year from radon-induced lung cancer Only smoking causes more lung cancer deaths Smokers more at risk than non-smokers

51
Radon Risk: Non-Smoker
Radon Level (pCI/L) If 1000 people who did not smoke were exposed to this level over a lifetime.. About X would get lung cancer This risk of cancer from radon exposure compares to … What to do: 20 8 Being killed in a violent crime Fix your home 10 4 3 10x risk of dying in a plane crash 2 Risk of drowning <1 Risk of dying in a home fire 1.3 Average indoor radon level 0.4 If you are a former smoker, your risk may be higher
 If 1000 people who did not smoke were exposed to this level over a lifetime.. About X would get lung cancer. This risk of cancer from radon exposure compares to … What to do: Being killed in a violent crime. Fix your home x risk of dying in a plane crash. 2. Risk of drowning. <1. Risk of dying in a home fire Average indoor radon level If you are a former smoker, your risk may be higher.")
52
Radon Risk: Smoker If you are a former smoker, your risk may be lower
Radon Level (pCI/L) If 1000 people who smoke were exposed to this level over a lifetime.. About X would get lung cancer This risk of cancer from radon exposure compares to … What to do: Stop smoking and … 20 135 100x risk of drowning Fix your home 10 71 100x risk of dying in a home fire 8 57 4 29 100x risk of dying in a plane crash 2 15 2x the risk of dying in a car crash 1.3 9 Average indoor radon level 0.4 3 If you are a former smoker, your risk may be lower
 If 1000 people who smoke were exposed to this level over a lifetime.. About X would get lung cancer. This risk of cancer from radon exposure compares to … What to do: Stop smoking and … x risk of drowning. Fix your home x risk of dying in a home fire x risk of dying in a plane crash x the risk of dying in a car crash Average indoor radon level If you are a former smoker, your risk may be lower.")
53
Radon 55% of our exposure to radiation comes from radon
colorless, tasteless, odorless gas formed from the decay of uranium found in nearly all soils levels vary

54
(From: http://www.epa.gov/iaq/radon/zonemap.html)
Zone pCi/L >4 <2

55
Radon: How it Enters Buildings
Cracks in solid floors Construction joints Cracks in walls Gaps in suspended floors Gaps around service pipes Cavities inside walls The water supply

56
Radon: Reducing the Risks
Sealing cracks in floors and walls Simple systems using pipes and fans More information: ech Such systems are called "sub-slab depressurization," and do not require major changes to your home. These systems remove radon gas from below the concrete floor and the foundation before it can enter the home. Similar systems can also be installed in houses with crawl spaces.

57
Sick Building Syndrome (SBS) Building Related Illness (BRI)
vs Building Related Illness (BRI)
")
58
Sick Building Syndrome
A persistent set of symptoms in > 20% population Causes(s) not known or recognizable Complaints/Symptoms relieved after exiting building
 not known or recognizable. Complaints/Symptoms relieved after exiting building.")
59
Complaints/Symptoms Headaches Dry Skin Fatigue Nasal Congestion
Reduced Mentation Irritability Eye, nose or throat irritation Dry Skin Nasal Congestion Difficulty Breathing Nose Bleeds Nausea

60
Building Related Illness
Clinically Recognized Disease Exposure to indoor air pollutants Recognizable Causes

61
Clinically Recognized Diseases
Pontiac Fever – Legionella spp. Legionnaire's Disease Hypersensitivity Pneumonitis Humidifier Fever Asthma Allergy Respiratory Disease Chronic Obstructive Pulmonary Disease

62
Ventilation

63
Movement of Air Into / Out of Homes
Amount of air available to dilute pollutants important indicator of the likely contaminant concentration Indoor air can mix with outside air by three mechanisms infiltration natural ventilation forced ventilation

64
Movement of Air Into / Out of Homes
Infiltration natural air exchange that occurs between a building and its environment when the doors and windows are closed leakage through holes or openings in the building envelope pressure induced due to pressure differentials inside and outside of the building especially important with cracks and other openings in wall

65
Movement of Air Into / Out of Homes
Infiltration Temperature induced (stack effect) driven by air movement through holes in floors, ceilings in winter, warm air in a building wants to rise, exits through cracks in ceiling and draws in
 driven by air movement through holes in floors, ceilings. in winter, warm air in a building wants to rise, exits through cracks in ceiling and draws in.")
66
Movement of Air Into / Out of Homes
Natural ventilation air exchange that occurs when windows or doors are opened to increase air circulation Forced ventilation mechanical air handling systems used to induce air exchange using fans and blowers Trade-offs cut infiltration to decrease heating and cooling costs vs. indoor air quality problems

67
Movement of Air Into / Out of Homes
Infiltration rates Influenced by how fast wind is blowing, pressure differentials temperature differential between inside and outside of house location of leaks in building envelope

68
Air Pollution Prevention

69
The Clean Air Act Congress found:
• Most people now live in urban areas • Growth results in air pollution • Air pollution endangers living things It decided: • Prevention and control at the source was appropriate • Such efforts are the responsibility of states and local authorities • Federal funds and leadership are essential for the development of effective programs The Clean Air Act

70
Clean Air Act Originally signed 1963
States controlled standards 1970 – Uniform Standards by Federal Govt. Criteria Pollutants Primary – Human health risk Secondary – Protect materials, crops, climate, visibility, personal comfort

71
Clean Air Act 1990 version 1997 version
Acid rain, urban smog, toxic air pollutants, ozone depletion, marketing pollution rights, VOC’s 1997 version Reduced ambient ozone levels Cost $15 billion/year -> save 15,000 lives Reduce bronchitis cases by 60,000 per year Reduce hospital respiratory admission 9000/year

72
Clean Air Act President George W. Bush signed rules amending Clean Air Act that allowed power plants and other industries to increase pollution significantly without adopting control measures

73
Clean Air Act http://www.epa.gov/air/oaq_caa.html
Title I - Air Pollution Prevention and Control Part A - Air Quality and Emission Limitations Part B - Ozone Protection (replaced by Title VI) Part C - Prevention of Significant Deterioration of Air Quality Part D - Plan Requirements for Nonattainment Areas Title II - Emission Standards for Moving Sources Part A - Motor Vehicle Emission and Fuel Standards Part B - Aircraft Emission Standards Part C - Clean Fuel Vehicles Title III - General Title IV - Acid Deposition Control Title V - Permits Title VI - Stratospheric Ozone Protection
 Part C - Prevention of Significant Deterioration of Air Quality. Part D - Plan Requirements for Nonattainment Areas. Title II - Emission Standards for Moving Sources. Part A - Motor Vehicle Emission and Fuel Standards. Part B - Aircraft Emission Standards. Part C - Clean Fuel Vehicles. Title III - General. Title IV - Acid Deposition Control. Title V - Permits. Title VI - Stratospheric Ozone Protection.")
74
Specific Air Pollution Treatment Technology
Traditional Move factory to remote location Build taller smokestack so wind blows pollution elsewhere New Biofiltration : vapors pumped through soil where microbes degrade High-energy destruction: high-voltage electricity Membrane separation: diffusion of organic vapors through membrane Oxidation: High temperature combustor

75
Absorption

76
Adsorption

77
Combustion

78
Cyclone

79
Filtration

80
Electrostatic Precipitator

81
Liquid Scrubber

82
Sulfur Dioxide Control
Advanced Flue Gas Desulfurization Demonstration Project |Objective: To reduce SO2 emissions by 95% or more at approximately one-half the cost of conventional scrubbing technology, significantly reduce space requirements, and create no new waste streams. Technology/Project Description: Pure Air built a single SO2 absorber for a 528-MWe power plant. Although the largest capacity absorber module of its time in the United States, space requirements were modest because no spare or backup absorber modules were required. The absorber performed three functions in a single vessel: prequenching, absorbing, and oxidation of sludge to gypsum. Additionally, the absorber was of a co-current design, in which the flue gas and scrubbing slurry move in the same direction and at a relatively high velocity compared to that in conventional scrubbers. These features all combined to yield a state-of-the-art SO2 absorber that was more compact and less expensive than contemporary conventional scrubbers. Other technical features included the injection of pulverized limestone directly into the absorber, a device called an air rotary sparger located within the base of the absorber, and a novel wastewater evaporation system. The air rotary sparger combined the functions of agitation and air distribution into one piece of equipment to facilitate the oxidation of calcium sulfite to gypsum. Pure Air also demonstrated a unique gypsum agglomeration process, PowerChip®, to significantly enhance handling characteristics of adsorbed flue gas desulfurization AFGD-derived gypsum.

83
Air Pollution Results

84
Source: NATIONAL AIR POLLUTANT EMISSION TRENDS,
United States Environmental Protection Agency Office of Air Quality Planning and Standards EPA-454/R March 2000

85
Comparison of 1970 and 1999 Emissions
Source: Latest Findings on National Air Quality: 1999 Status and Trends EPA EPA-454/F Since the 1970 Clean Air Act was signed into law, emissions of each of the six pollutants decreased, with the exception of NOx . Between 1970 and 1999, emissions of NOx increased 17 percent. The majority of this increase can be attributed to heavy-duty diesel vehicles and coal-fired power plants. EPA has major initiatives to reduce emissions of NOx considerably from these sources. Emissions of NOx contribute to the formation of ground-level ozone (smog), acid rain, and other environmental problems, even after being carried by the wind hundreds of miles from their original source.
, acid rain, and other environmental problems, even after being carried by the. wind hundreds of miles from their original source.")
87
Between 1970 and 1999, U.S. population increased 33 percent, vehicle miles traveled increased 140 percent, and gross domestic product increased 147 percent. At the same time, total emissions of the six principal air pollutants decreased 31 percent.

88
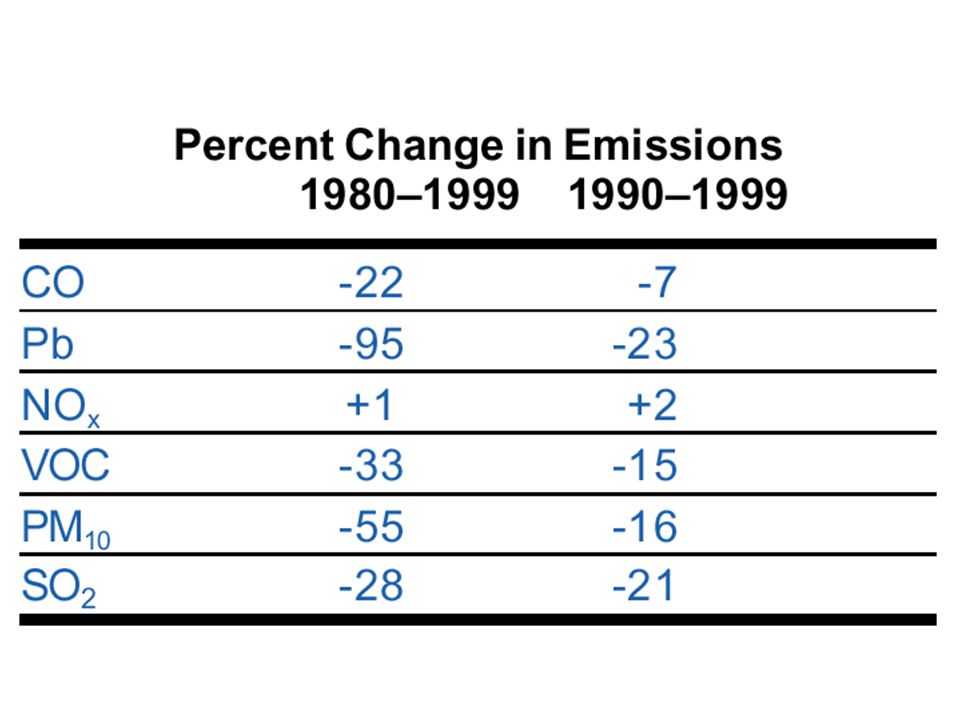
EPA tracks trends in air quality based on actual measurements of
pollutant concentrations in the ambient (outside) air at monitoring sites across the country. Monitoring stations are operated by state, tribal, and local government agencies as well as some federal agencies, including EPA. Trends are derived by averaging direct measurements from these monitoring stations on a yearly basis. The chart at above shows that the air quality based on concentrations of the principal pollutants has improved nationally over the last 20 years (1980–1999). The most notable improvements are seen for Pb, CO, and SO2 with 94-, 57- and 50-percent reductions, respectively.
 air at monitoring. sites across the country. Monitoring stations are operated by state, tribal, and local government agencies as well as some federal. agencies, including EPA. Trends are derived by averaging direct. measurements from these monitoring stations on a yearly basis. The. chart at above shows that the air quality based on concentrations of. the principal pollutants has improved nationally over the last 20. years (1980–1999). The most notable improvements are seen for Pb, CO, and SO2 with 94-, 57- and 50-percent reductions, respectively.")
89
Number of People Living in Counties with Air Quality Concentrations Above the Level of the National Ambient Air Quality Standards (NAAQS) in 1999 Despite great progress in air quality improvement, approximately 62 million people nationwide still lived in counties with pollution levels above the national air quality standards in This number does not take into consideration the 8-hour ozone standard. Blue bars represent 8-hour standard for ozone.

90
Trends in Sulfur Dioxide Emissions Following Implementation of Phase I of the Acid Rain Program: Total State-level Utility SO2 (1980, 1990, 1999) This set of maps illustrates the geographic and temporal trends in state-level utility sulfur dioxide (SO2) emissions before and during implementation of Phase I of the Acid Rain Program. The maps illustrate total state-level utility SO2 emissions in 1980, 1990, and 1999. Total sulfur dioxide emissions were significantly reduced during Phase I of the Acid Rain Program. In the first five years of the program, Phase I sources reduced SO2 emissions by more than 50% from 1980 levels; total utility SO2 emissions (Phase I and II sources) were reduced almost 30% nationwide. Although most SO2 emissions occur in the Midwestern U.S., it is important to note that over time, this same region has also seen the most significant decrease in SO2 emissions in the country. The highest SO2 emitting states in 1980 (Ohio, Indiana, and Pennsylvania), have achieved an average reduction of about 40%, from 1980 levels. Acid rain causes acidification of lakes and streams and contributes to damage of trees at high elevations (for example, red spruce trees above 2,000 feet) and many sensitive forest soils. In addition, acid rain accelerates the decay of building materials and paints, including irreplaceable buildings, statues,and sculptures that are part of our nation's cultural heritage. Prior to falling to the earth, SO2 and NOx gases and their particulate matter derivatives, sulfates and nitrates, contribute to visibility degradation and harm public health.
 emissions before and during implementation of Phase I of the Acid Rain Program. The maps illustrate total state-level utility SO2 emissions in 1980, 1990, and Total sulfur dioxide emissions were significantly reduced during Phase I of the Acid Rain Program. In the first five years of the program, Phase I sources reduced SO2 emissions by more than 50% from 1980 levels; total utility SO2 emissions (Phase I and II sources) were reduced almost 30% nationwide. Although most SO2 emissions occur in the Midwestern U.S., it is important to note that over time, this same region has also seen the most significant decrease in SO2 emissions in the country. The highest SO2 emitting states in 1980 (Ohio, Indiana, and Pennsylvania), have achieved an average reduction of about 40%, from 1980 levels. Acid rain causes acidification of lakes and streams and contributes to damage of trees at high elevations (for example, red spruce trees above 2,000 feet) and many sensitive forest soils. In addition, acid rain accelerates the decay of building materials and paints, including irreplaceable buildings, statues,and sculptures that are part of our nation s cultural heritage. Prior to falling to the earth, SO2 and NOx gases and their particulate matter derivatives, sulfates and nitrates, contribute to visibility degradation and harm public health.")
91
Fifty Years of Air Pollution
Figures are in millions of metric tons per year

92
Mobile Sources: The Last Ten Years
VOCs CO NOx PM10 SOx Lead Mobile Sources: The Last Ten Years -3% -8% -10% -24% -29% Percent reductions shown are based on estimates of tons/year from mobile sources over the time period -85%

93
Who is Affected by Air Pollution?
63 Over 74 million people are subjected to high levels of at least one of these pollutants Who is Affected by Air Pollution? 22 19 9 5 1 Ozone CO NO PM10 SO2 Lead Millions of people living in counties with air quality that exceeds each NAAQS (1990 data)
")
94
Milestones in the Control of Automotive Emissions
Autos linked to air pollution Original CAA, PCV valves HC & CO exhaust controls CAA amendments, EPA formed Evaporative controls First I/M Program NOx exhaust controls First catalytic converters New cars meet statutory limits Volatility limits on gasoline New CAA Amendments Milestones in the Control of Automotive Emissions

95
1987 Montreal Protocol: CFC emissions should be reduced by 50% by the year 2000 (they had been increasing 3% per year.) 1990 London amendments: production of CFCs, CCl4, and halons should cease entirely by 2000. 1992 Copenhagen agreements: phase- out accelerated to 1996.

96
Goals of Kyoto Protocol
Reduction of greenhouse gases to below levels: 5.2% world wide reduction on average by 6% for Canada by When sufficient countries ratify the Protocol (at least 55 countries comprising at least 55% of emissions), Protocol comes into effect USA - 25% of emissions
, Protocol comes into effect. USA - 25% of emissions.")
97
Kyoto Emissions Agreement

Similar presentations


 Do not set up for CN. OBJ = SWBAT identify major air pollutants and explain their effect on humans.>")


