Download presentation
Presentation is loading. Please wait.

1
Advanced Placement Environmental Science La Canada High School Dr. E
Human Impact on the Atmosphere Chapters 18 and 19 Living in the Environment, 11th Edition, Miller Advanced Placement Environmental Science La Canada High School Dr. E

2
Pollution Thorpe, Gary S. , M. S. , (2002)
Pollution Thorpe, Gary S., M.S., (2002). Barron’s How to prepare for the AP Environmental Science Advanced Placement Exam The term “Smog” (smoke and fog) was first used in 1905 to describe sulfur dioxide emission In 1952, severe pollution took the lives of 5000 people in London “It isn’t pollution that’s harming the environment. It’s the impurities in our air and water that are doing it.” Former U.S. Vice President Dan Quayle 97annual.html
. Barron’s How to prepare for the AP Environmental Science Advanced Placement Exam. The term Smog (smoke and fog) was first used in 1905 to describe sulfur dioxide emission. In 1952, severe pollution took the lives of 5000 people in London. It isn’t pollution that’s harming the environment. It’s the impurities in our air and water that are doing it. Former U.S. Vice President Dan Quayle. 97annual.html.")
3
The Clean Air Act Congress found:
• Most people now live in urban areas • Growth results in air pollution • Air pollution endangers living things It decided: • Prevention and control at the source was appropriate • Such efforts are the responsibility of states and local authorities • Federal funds and leadership are essential for the development of effective programs The Clean Air Act

4
Clean Air Act Originally signed 1963
States controlled standards 1970 – Uniform Standards by Federal Govt. Criteria Pollutants Primary – Human health risk Secondary – Protect materials, crops, climate, visibility, personal comfort

5
Clean Air Act 1990 version 1997 version
Acid rain, urban smog, toxic air pollutants, ozone depletion, marketing pollution rights, VOC’s 1997 version Reduced ambient ozone levels Cost $15 billion/year -> save 15,000 lives Reduce bronchitis cases by 60,000 per year Reduce hospital respiratory admission 9000/year

6
Clean Air Act President George W. Bush signed rules amending Clean Air Act that allowed power plants and other industries to increase pollution significantly without adopting control measures

7
Appeals court blocks Bush clean air changes
Appeals court blocks Bush clean air changes Wednesday, December 24, 2003 Posted: 2:10 PM EST (1910 GMT) WASHINGTON (AP) -- A federal appeals court on Wednesday blocked new Bush administration changes to the Clean Air Act from going into effect the next day, in a challenge from state attorneys general and cities that argued they would harm the environment and public health.
 WASHINGTON (AP) -- A federal appeals court on Wednesday blocked new Bush administration changes to the Clean Air Act from going into effect the next day, in a challenge from state attorneys general and cities that argued they would harm the environment and public health.")
8
Clean Air Act http://www.epa.gov/air/oaq_caa.html
Title I - Air Pollution Prevention and Control Part A - Air Quality and Emission Limitations Part B - Ozone Protection (replaced by Title VI) Part C - Prevention of Significant Deterioration of Air Quality Part D - Plan Requirements for Nonattainment Areas Title II - Emission Standards for Moving Sources Part A - Motor Vehicle Emission and Fuel Standards Part B - Aircraft Emission Standards Part C - Clean Fuel Vehicles Title III - General Title IV - Acid Deposition Control Title V - Permits Title VI - Stratospheric Ozone Protection
 Part C - Prevention of Significant Deterioration of Air Quality. Part D - Plan Requirements for Nonattainment Areas. Title II - Emission Standards for Moving Sources. Part A - Motor Vehicle Emission and Fuel Standards. Part B - Aircraft Emission Standards. Part C - Clean Fuel Vehicles. Title III - General. Title IV - Acid Deposition Control. Title V - Permits. Title VI - Stratospheric Ozone Protection.")
9
Outdoor Air Pollution

10
Primary Pollutants Secondary Pollutants Sources Natural Stationary CO CO2 SO2 NO NO2 Most hydrocarbons Most suspended particles SO3 HNO3 H2SO4 H2O2 O3 PANs Most and salts NO3 – Mobile SO4 2

11
Major Sources of Primary Pollutants
Stationary Sources Combustion of fuels for power and heat – Power Plants Other burning such as Wood & crop burning or forest fires Industrial/ commercial processes Solvents and aerosols Mobile Sources Highway: cars, trucks, buses and motorcycles Off-highway: aircraft, boats, locomotives, farm equipment, RVs, construction machinery, and lawn mowers

12
Source: http://www.epa.gov/air/oaqps/takingtoxics/p1.html#1
Scientists estimate that millions of tons of toxic pollutants are released into the air each year. Most air toxics originate from manmade sources, including both mobile sources (e.g., cars, buses, trucks) and stationary sources (e.g., factories, refineries, power plants). However, some are released in major amounts from natural sources such as forest fires. Routine emissions from stationary sources constitute almost one-half of all manmade air toxics emissions.
 and stationary sources (e.g., factories, refineries, power plants). However, some are released in major amounts from natural sources such as forest fires. Routine emissions from stationary sources constitute almost one-half of all manmade air toxics emissions.")
13
54 million metric tons from mobile sources in 1990
There are two types of stationary sources that generate routine emissions of air toxics: "Major" sources are defined as sources that emit 10 tons per year of any of the listed toxic air pollutants, or 25 tons per year of a mixture of air toxics. Examples include chemical plants, steel mills, oil refineries, and hazardous waste incinerators. These sources may release air toxics from equipment leaks, when materials are transferred from one location to another, or during discharge through emissions stacks or vents. One key public health concern regarding major sources is the health effects on populations located downwind from them. "Area" sources consist of smaller sources, each releasing smaller amounts of toxic pollutants into the air. Area sources are defined as sources that emit less than 10 tons per year of a single air toxic, or less than 25 tons per year of a mixture of air toxics. Examples include neighborhood dry cleaners and gas stations. Though emissions from individual area sources are often relatively small, collectively their emissions can be of concern—particularly where large numbers of sources are located in heavily populated areas. EPA’s published list of "source categories" now contains 175 categories of industrial and sources that emit one or more toxic air pollutants. For each of these source categories, EPA indicated whether the sources are considered to be "major" sources or "area" sources. The 1990 Clean Air Act Amendments direct EPA to set standards requiring all major sources of air toxics (and some area sources that are of particular concern) to significantly reduce their air toxics emissions.
 to significantly reduce their air toxics emissions.")
14
Human Impact on Atmosphere
Burning Fossil Fuels Using Nitrogen fertilizers and burning fossil fuels Refining petroleum and burning fossil fuels Manufacturing Adds CO2 and O3 to troposphere Global Warming Altering Climates Produces Acid Rain Releases NO, NO2, N2O, and NH3 into troposphere Produces acid rain Releases SO2 into troposphere Releases toxic heavy metals (Pb, Cd, and As) into troposphere air/products.html
 into troposphere. air/products.html.")
15
Criteria Air Pollutants
EPA uses six "criteria pollutants" as indicators of air quality Nitrogen Dioxide: NO2 Ozone: ground level O3 Carbon monoxide: CO Lead: Pb Particulate Matter: PM10 (PM 2.5) Sulfur Dioxide: SO2 Volatile Organic Compounds: (VOCs) EPA established for each concentrations above which adverse effects on health may occur
 Sulfur Dioxide: SO2. Volatile Organic Compounds: (VOCs) EPA established for each concentrations above which adverse effects on health may occur.")
16
Nitrogen Dioxide (NO2) Properties: reddish brown gas, formed as fuel burnt in car, strong oxidizing agent, forms Nitric acid in air Effects: acid rain, lung and heart problems, decreased visibility (yellow haze), suppresses plant growth Sources: fossil fuels combustion, power plants, forest fires, volcanoes, bacteria in soil Class: Nitrogen oxides (NOx) EPA Standard: ppm
, suppresses plant growth. Sources: fossil fuels combustion, power plants, forest fires, volcanoes, bacteria in soil. Class: Nitrogen oxides (NOx) EPA Standard: ppm.")
17
Mobile Source Emissions: Nitrogen Oxides

18
Ozone (O3) Properties: colorless, unpleasant odor, major part of photochemical smog Effects: lung irritant, damages plants, rubber, fabric, eyes, 0.1 ppm can lower PSN by 50%, Sources: Created by sunlight acting on NOx and VOC , photocopiers, cars, industry, gas vapors, chemical solvents, incomplete fuel combustion products Class: photochemical oxidants

19
Ozone (O3) 10,000 to 15,000 people in US admitted to hospitals each year due to ozone-related illness Children more susceptible Airways narrower More time spent outdoors

20
Mobile Source Emissions: Hydrocarbons – Precursors to Ozone

21
Carbon Monoxide (CO) Properties: colorless, odorless, heavier than air, % of atmosphere Effects: binds tighter to Hb than O2, mental functions and visual acuity, even at low levels Sources: incomplete combustion of fossil fuels % from auto exhaust Class: carbon oxides (CO2, CO) EPA Standard: 9 ppm 5.5 billion tons enter atmosphere/year
 EPA Standard: 9 ppm. 5.5 billion tons enter atmosphere/year.")
22
Mobile Source Emissions - CO

23
Lead (Pb) Properties: grayish metal
Effects: accumulates in tissue; affects kidneys, liver and nervous system (children most susceptible); mental retardation; possible carcinogen; 20% of inner city kids have [high] Sources: particulates, smelters, batteries Class: toxic or heavy metals EPA Standard: 1.5 ug/m3 2 million tons enter atmosphere/year
; mental retardation; possible carcinogen; 20% of inner city kids have [high] Sources: particulates, smelters, batteries. Class: toxic or heavy metals. EPA Standard: 1.5 ug/m3. 2 million tons enter atmosphere/year.")
24
Suspended Particulate Matter (PM10)
Properties: particles suspended in air (<10 um) Effects: lung damage, mutagenic, carcinogenic, teratogenic Sources: burning coal or diesel, volcanoes, factories, unpaved roads, plowing, lint, pollen, spores, burning fields Class: SPM: dust, soot, asbestos, lead, PCBs, dioxins, pesticides EPA Standard: 50 ug/m3 (annual mean)
 Effects: lung damage, mutagenic, carcinogenic, teratogenic. Sources: burning coal or diesel, volcanoes, factories, unpaved roads, plowing, lint, pollen, spores, burning fields. Class: SPM: dust, soot, asbestos, lead, PCBs, dioxins, pesticides. EPA Standard: 50 ug/m3 (annual mean)")
25
Mobile Source Emissions: Fine Particulate Matter (PM2.5)
")
26
Sulfur Dioxide (SO2) Properties: colorless gas with irritating odor
Effects: produces acid rain (H2SO4), breathing difficulties, eutrophication due to sulfate formation, lichen and moss are indicators Sources: burning high sulfur coal or oil, smelting or metals, paper manufacture Class: sulfur oxides EPA Standard: 0.3 ppm (annual mean) Combines with water and NH4 to increase soil fertility
, breathing difficulties, eutrophication due to sulfate formation, lichen and moss are indicators. Sources: burning high sulfur coal or oil, smelting or metals, paper manufacture. Class: sulfur oxides. EPA Standard: 0.3 ppm (annual mean) Combines with water and NH4 to increase soil fertility.")
27
VOCs (Volatile Organic Compounds)
Properties: organic compounds (hydrocarbons) that evaporate easily, usually aromatic Effects: eye and respiratory irritants; carcinogenic; liver, CNS, or kidney damage; damages plants; lowered visibility due to brown haze; global warming Sources: vehicles (largest source), evaporation of solvents or fossil fuels, aerosols, paint thinners, dry cleaning Class: HAPs (Hazardous Air Pollutants) Methane Benzene Chlorofluorocarbons (CFCs), etc. Concentrations indoors up to 1000x outdoors 600 million tons of CFCs
 that evaporate easily, usually aromatic. Effects: eye and respiratory irritants; carcinogenic; liver, CNS, or kidney damage; damages plants; lowered visibility due to brown haze; global warming. Sources: vehicles (largest source), evaporation of solvents or fossil fuels, aerosols, paint thinners, dry cleaning. Class: HAPs (Hazardous Air Pollutants) Methane. Benzene. Chlorofluorocarbons (CFCs), etc. Concentrations indoors up to 1000x outdoors. 600 million tons of CFCs.")
28
Other Air Pollutants Carbon dioxide ChloroFluoroCarbons Formaldehyde
Benzene Asbestos Manganese Dioxins Cadmium Others not yet fully characterized

29
Formation & Intensity Factors
Local climate (inversions, air pressure, temperature, humidity) Topography (hills and mountains) Population density Amount of industry Fuels used by population and industry for heating, manufacturing, transportation, power Weather: rain, snow,wind Buildings (slow wind speed) Mass transit used Economics
 Topography (hills and mountains) Population density. Amount of industry. Fuels used by population and industry for heating, manufacturing, transportation, power. Weather: rain, snow,wind. Buildings (slow wind speed) Mass transit used. Economics.")
30
Thermal Inversion Pollutants • surface heated by sun
warm air cool air • surface heated by sun • warm air rises (incl. pollutants) • cools off, mixes with air of equal density & disperses warm air (inversion layer) • surface cools rapidly (night) • a layer of warm air overlays surface • polluted surface air rises but cannot disperse remains trapped
 • cools off, mixes with air of equal. density & disperses. warm air (inversion layer) • surface cools rapidly (night) • a layer of warm air overlays surface. • polluted surface air rises but cannot. disperse remains trapped.")
31
Smog Forms ...when polluted air is stagnant
(weather conditions, geographic location) Los Angeles, CA
 Los Angeles, CA.")
32
Primary Pollutants CO CO2 Secondary Pollutants SO2 NO NO2 SO3
Most hydrocarbons HNO3 H2SO4 Most suspended particles H2O2 O3 PANs SO4 2 – Most NO3 – and salts Natural Sources Stationary Mobile

33
Photochemical Smog UV radiation H2O + O2 Primary Pollutants
NO2 + Hydrocarbons Secondary Pollutants HNO3 O3 nitric acid ozone Photochemical Smog Auto Emissions

34
Ultraviolet radiation
Solar radiation Photochemical Smog Ultraviolet radiation NO Nitric oxide O Atomic oxygen O2 Molecular oxygen NO2 Nitrogen dioxide H2O Water Hydrocarbons PANs Peroxyacyl nitrates Aldehydes (e.g., formaldehyde) O3 Ozone HNO3 Nitric acid P h o t o c h e m i c a l S m o g
 O3. Ozone. HNO3. Nitric acid. P h o t o c h e m i c a l S m o g.")
35
Indoor Air Pollution

36
Why is indoor air quality important?
70 to 90% of time spent indoors, mostly at home Many significant pollution sources in the home (e.g. gas cookers, paints and glues) Personal exposure to many common pollutants is driven by indoor exposure Especially important for susceptible groups – e.g. the sick, old and very young
 Personal exposure to many common pollutants is driven by indoor exposure. Especially important for susceptible groups – e.g. the sick, old and very young.")
37
Exposure Time spent in various environments in US and less-developed countries

38
House of Commons Select Committee Enquiry on Indoor Air Pollution (1991)
“[There is] evidence that 3 million people have asthma in the UK… and this is increasing by 5% per annum.” “Overall there appears to be a worryingly large number of health problems which could be connected with indoor pollution and which affect very large numbers of the population.” [The Committee recommends that the Government] “develop guidelines and codes of practice for indoor air quality in buildings which specifically identify exposure limits for an extended list of pollutants…”

39
Sources of Indoor Air Pollutants
Building materials Furniture Furnishings and fabrics Glues Cleaning products Other consumer products Combustion appliances (cookers and heaters) Open fires Tobacco smoking Cooking House dust mites, bacteria and moulds Outdoor air
 Open fires. Tobacco smoking. Cooking. House dust mites, bacteria and moulds. Outdoor air.")
40
Important Indoor Air pollutants
Nitrogen dioxide Carbon monoxide Formaldehyde Volatile Organic Compounds (VOCs) House dust mites (and other allergens, e.g. from pets) Environmental tobacco smoke Fine particles Chlorinated organic compounds (e.g. pesticides) Asbestos and man-made mineral fibres Radon
 House dust mites (and other allergens, e.g. from pets) Environmental tobacco smoke. Fine particles. Chlorinated organic compounds (e.g. pesticides) Asbestos and man-made mineral fibres. Radon.")
41
Health Effects Nitrogen dioxide Respiratory irritant
Elevated risk of respiratory illness in children, perhaps resulting from increased susceptibility to respiratory infection; inconsistent evidence for effects in adults Concentrations in kitchens can readily exceed WHO and EPA standards

42
Health Effects Carbon monoxide An asphyxiant and toxicant
Hazard of acute intoxication, mostly from malfunctioning fuel-burning appliances and inadequate or blocked flues Possibility of chronic effects of long-term exposure to non- lethal concentrations, particularly amongst susceptible groups

43
Health Effects Formaldehyde
Sensory and respiratory irritant and sensitizer Possible increased risk of asthma and chronic bronchitis in children at higher exposure levels Individual differences in sensory and other transient responses Caution over rising indoor concentrations

44
Health Effects Volatile Organic Compounds (VOCs)
Occur in complex and variable mixtures Main health effects relate to comfort and well-being, but benzene (and other VOCs) are carcinogenic Concern about possible role of VOCs in the aetiology of multiple chemical sensitivity; also implicated in sick building syndrome
 are carcinogenic. Concern about possible role of VOCs in the aetiology of multiple chemical sensitivity; also implicated in sick building syndrome.")
45
Health Effects House dust mites
House dust mites produce Der p1 allergen, a potent sensitizer Good evidence of increased risk of sensitization with increasing allergen exposure, but this does not necessarily lead to asthma Small reductions in exposure will not necessarily lead to reduced incidence and/or symptoms Indoor humidity is important

46
Health Effects Fungi and bacteria
Dampness and mould-growth linked to self-reported respiratory conditions, but little convincing evidence for association between measured airborne fungi and respiratory disease Insufficient data to relate exposure to (non-pathogenic) bacteria to health effects in the indoor environment
 bacteria to health effects in the indoor environment.")
47
Health Effects Environmental tobacco smoke (ETS)
Sudden infant death syndrome Lower respiratory tract illness Middle ear disease Asthma 12 million children exposed to secondhand smoke in homes

48
Health Effects Fine particles
Consistent evidence that exposure to small airborne particles (e.g. PM10) in ambient air can impact on human health; mechanisms uncertain Chronic Obstructive Pulmonary Disease and Cardiovascular Disease patients and asthmatics probably at extra risk Relative importance of indoor sources is unknown
 in ambient air can impact on human health; mechanisms uncertain. Chronic Obstructive Pulmonary Disease and Cardiovascular Disease patients and asthmatics probably at extra risk. Relative importance of indoor sources is unknown.")
49
Health Effects Radon Can cause lung cancer
Estimated that 7,000 to 30,000 Americans die each year from radon-induced lung cancer Only smoking causes more lung cancer deaths Smokers more at risk than non-smokers

50
Radon Risk: Non-Smoker
Radon Level (pCI/L) If 1000 people who did not smoke were exposed to this level over a lifetime.. About X would get lung cancer This risk of cancer from radon exposure compares to … What to do: 20 8 Being killed in a violent crime Fix your home 10 4 3 10x risk of dying in a plane crash 2 Risk of drowning <1 Risk of dying in a home fire 1.3 Average indoor radon level .4 If you are a former smoker, your risk may be higher
 If 1000 people who did not smoke were exposed to this level over a lifetime.. About X would get lung cancer. This risk of cancer from radon exposure compares to … What to do: Being killed in a violent crime. Fix your home x risk of dying in a plane crash. 2. Risk of drowning. <1. Risk of dying in a home fire Average indoor radon level. .4. If you are a former smoker, your risk may be higher.")
51
Radon Risk: Smoker If you are a former smoker, your risk may be lower
Radon Level (pCI/L) If 1000 people who smoke were exposed to this level over a lifetime.. About X would get lung cancer This risk of cancer from radon exposure compares to … What to do: Stop smoking and … 20 135 100x risk of drowning Fix your home 10 71 100x risk of dying in a home fire 8 57 4 29 100x risk of dying in a plane crash 2 15 2x the risk of dying in a car crash 1.3 9 Average indoor radon level .4 3 If you are a former smoker, your risk may be lower
 If 1000 people who smoke were exposed to this level over a lifetime.. About X would get lung cancer. This risk of cancer from radon exposure compares to … What to do: Stop smoking and … x risk of drowning. Fix your home x risk of dying in a home fire x risk of dying in a plane crash x the risk of dying in a car crash Average indoor radon level If you are a former smoker, your risk may be lower.")
52
Radon 55% of our exposure to radiation comes from radon
colorless, tasteless, odorless gas formed from the decay of uranium found in nearly all soils levels vary

53
(From: http://www.epa.gov/iaq/radon/zonemap.html)
Zone pCi/L >4 <2

54
Radon: How it Enters Buildings
Cracks in solid floors Construction joints Cracks in walls Gaps in suspended floors Gaps around service pipes Cavities inside walls The water supply

55
Radon: Reducing the Risks
Sealing cracks in floors and walls Simple systems using pipes and fans More information: Such systems are called "sub-slab depressurization," and do not require major changes to your home. These systems remove radon gas from below the concrete floor and the foundation before it can enter the home. Similar systems can also be installed in houses with crawl spaces.

56
Sick Building Syndrome (SBS) Building Related Illness (BRI)
vs Building Related Illness (BRI)
")
57
Sick Building Syndrome
A persistent set of symptoms in > 20% population Causes(s) not known or recognizable Complaints/Symptoms relieved after exiting building
 not known or recognizable. Complaints/Symptoms relieved after exiting building.")
58
Complaints/Symptoms Headaches Fatigue Reduced Mentation Irritability
Eye, nose or throat irritation Dry Skin Nasal Congestion Difficulty Breathing Nose Bleeds Nausea

59
Building Related Illness
Clinically Recognized Disease Exposure to indoor air pollutants Recognizable Causes

60
Clinically Recognized Diseases
Pontiac Fever – Legionella spp. Legionnaire's Disease Hypersensitivity Pneumonitis Humidifier Fever Asthma Allergy Respiratory Disease Chronic Obstructive Pulmonary Disease

61
Ventilation

62
Movement of Air Into / Out of Homes
Amount of air available to dilute pollutants important indicator of the likely contaminant concentration Indoor air can mix with outside air by three mechanisms infiltration natural ventilation forced ventilation

63
Movement of Air Into / Out of Homes
Infiltration natural air exchange that occurs between a building and its environment when the doors and windows are closed leakage through holes or openings in the building envelope pressure induced due to pressure differentials inside and outside of the building especially important with cracks and other openings in wall

64
Movement of Air Into / Out of Homes
Infiltration Temperature induced (stack effect) driven by air movement through holes in floors, ceilings in winter, warm air in a building wants to rise, exits through cracks in ceiling and draws in
 driven by air movement through holes in floors, ceilings. in winter, warm air in a building wants to rise, exits through cracks in ceiling and draws in.")
65
Movement of Air Into / Out of Homes
Natural ventilation air exchange that occurs when windows or doors are opened to increase air circulation Forced ventilation mechanical air handling systems used to induce air exchange using fans and blowers Trade-offs cut infiltration to decrease heating and cooling costs vs. indoor air quality problems

66
Movement of Air Into / Out of Homes
Infiltration rates Influenced by how fast wind is blowing, pressure differentials temperature differential between inside and outside of house location of leaks in building envelope

67
Greenhouse Effect

69
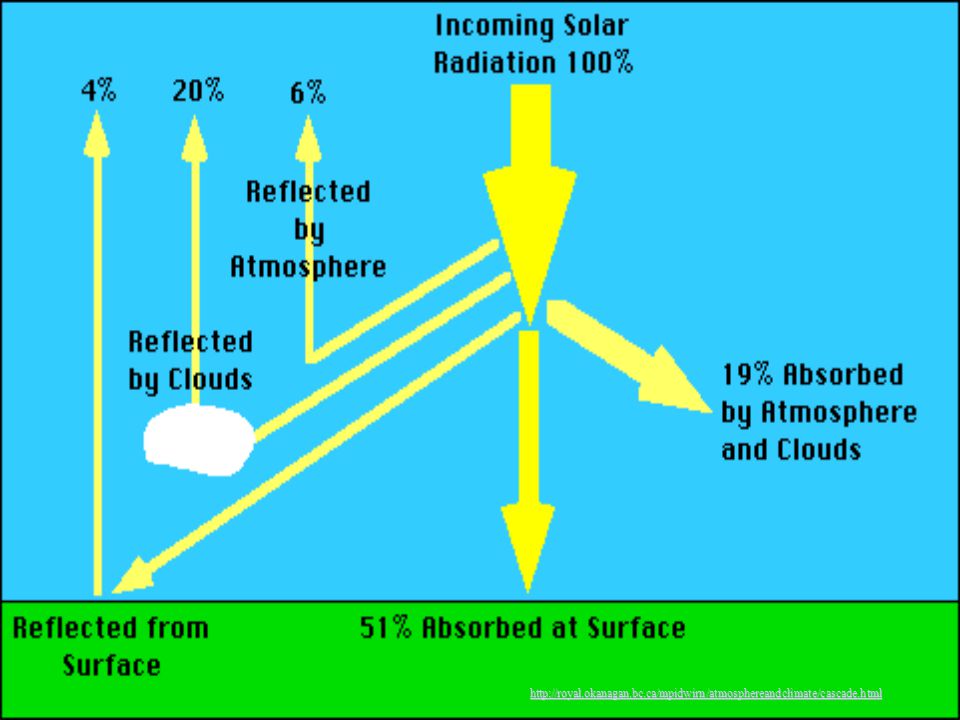
http://royal. okanagan. bc. ca/mpidwirn/atmosphereandclimate/cascade
70
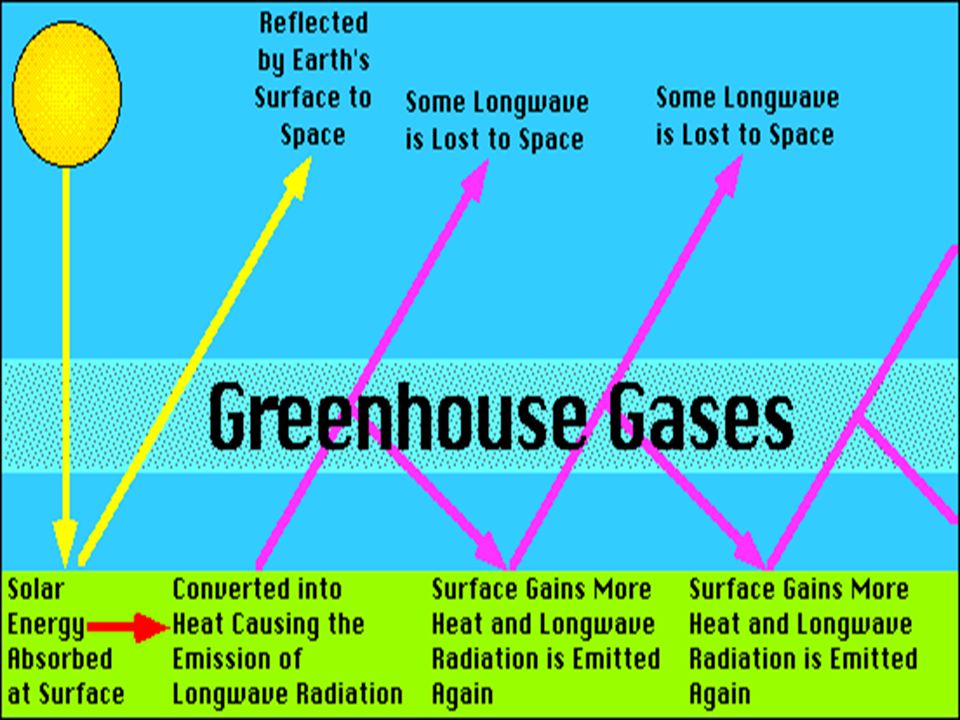
Natural Greenhouse Effect
With Greenhouse Effect average global temperature 60 degrees Without it, Earth would be a frigid planet, with average temperature around zero degrees Fahrenheit

71
Increased Greenhouse Gases in the Troposphere
Global Warming Increased Greenhouse Gases in the Troposphere Excess heat CO2 CFCs CH4

72
Greenhouse Gases Carbon dioxide Methane Nitrous oxide Ozone CFC’s
Hydrofluorocarbons Perfluorinated carbons Water vapour

73
Average Temperature Over Past 900,000 Years
Thousands of Years Ago Average Surface Temperature (°C) 900 800 700 600 500 400 300 200 100 Present 9 10 11 12 13 14 15 16 17
 Present")
74
Temperature Change Over Past 22,000 Years
Years Ago Temperature Change (°C) 20,000 10,000 2,000 1,000 200 100 Now -5 -4 -3 -2 -1 1 2 End of last ice age Agriculture established Average temperature over past 10,000 years = 15°C (59°F)
 20, ,000. 2,000. 1, Now End of. last ice. age. Agriculture established. Average temperature over past. 10,000 years = 15°C (59°F)")
75
Average Temperature Over Past 130 Years
Average Surface Temperature (°C) 1860 1880 1900 1920 1940 1960 1980 2000 2020 13.6 13.8 14.0 14.2 14.4 14.6 14.8 15.0
")
76
Is this increase in temperature natural or ?

77
Thousands of Years Before Present in the Atmosphere (ppm)
Carbon dioxide Temperature change End of last ice age 160 120 80 40 Thousands of Years Before Present in the Atmosphere (ppm) Concentration of CO2 180 200 220 240 260 280 300 320 340 360 380 –10.0 –7.5 –5.0 –2.5 +2.5 Variation of temperature (˚C) from current level
 Concentration of CO –10.0. –7.5. –5.0. – Variation of temperature (˚C) from current level.")
78
Year 1990 2000 2025 2050 2075 2100 100 150 200 250 Index (1900 = 100) Carbon dioxide Methane Nitrous oxide

79
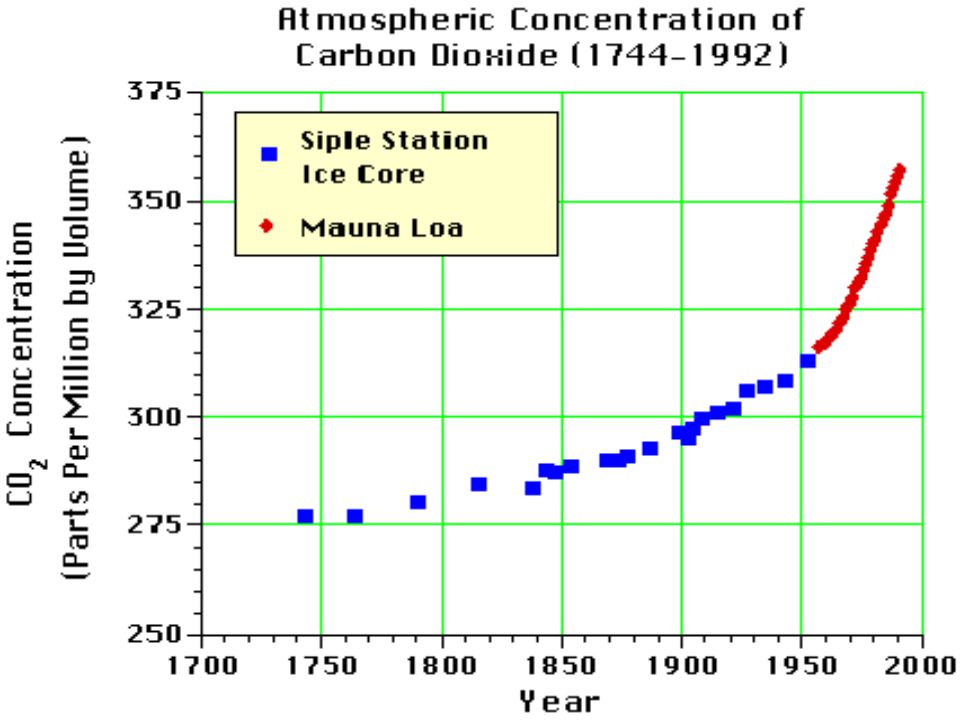
Measurements made at Mauna Loa, Hawaii; elevation = 12,000 feet

81
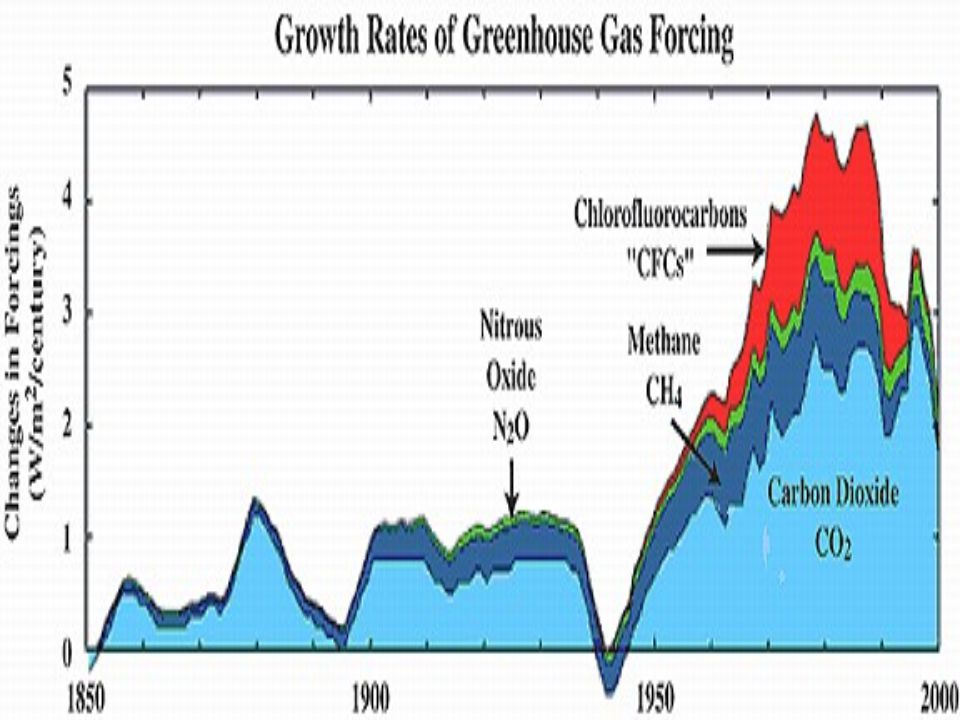
Contribution to Greenhouse Effect

83
Methane Core samples taken from old ocean sediment layers have been used to trace back in time the climate changes that have occurred over the past tens of millions of years short periods of only a few hundred years in the geological past when rapid increases of the Earth's temperature have occurred superimposed on top of the rise and fall of average temperatures over the longer term up to 15 degrees centigrade warmer than today.

84
Methane Temperatures then fell back to the long term trend, the whole rise and fall only lasting a few hundred years. The most likely cause of this rapid global warming over such a short period is the release of methane into the atmosphere. Methane is 60 times more powerful than CO2 as a greenhouse gas Methane was released due to breakdown of material associated with permafrost

86
Change in Temperature (ºC)
Year 1850 1875 1900 1925 1950 1975 2000 2025 2050 2075 2100 0.5 1.0 1.5 2.0 2.5 3.0 3.5 4.0 4.5 5.0 5.5 6.0 Change in Temperature (ºC) Predictions of Future Warming?
 Predictions of Future Warming")
87
Top Greenhouse Gas Emitters
19.1 % - United States 9.9% - China 5.1% - Japan 4.3% - Brazil 3.8 % - Germany 3.7% - Japan 2.4% - United Kingdom 1.9% - Indonesia 1.7% - Italy

88
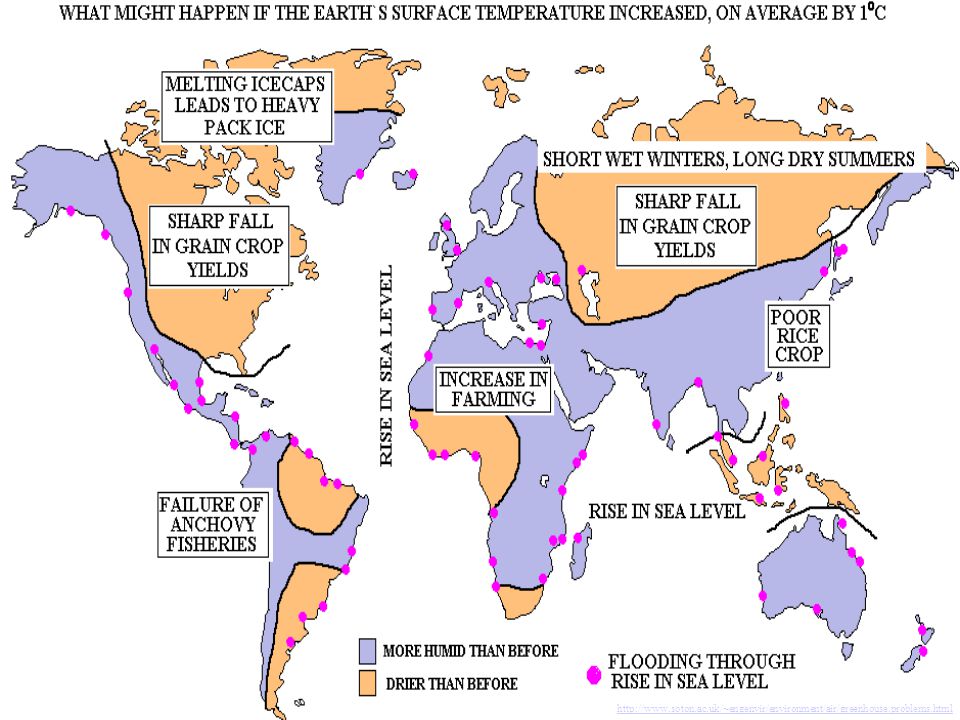
What impacts have occurred and are predicted to occur from global warming?

89
Atmosphere Impacts from Global Warming?
Weather Ocean currents Sea level Water resources Biodiversity Forests Human health Agriculture Human demographics

90
Sea Level and Coastal Areas
Increased deaths from heat and disease Disruption of food and water supplies Spread of tropical diseases to temperate areas Increased respiratory disease Increased water pollution from coastal flooding Human Health Rising sea levels Flooding of low-lying islands and coastal cities Flooding of coastal estuaries, wetlands, and coral reefs Beach erosion Disruption of coastal fisheries Contamination of coastal aquifiers with salt water Sea Level and Coastal Areas Changes in forest composition and locations Disappearance of some forests Increased fires from drying Loss of wildlife habitat and species Forests Changes in water supply Decreased water quality Increased drought Increased flooding Water Resources Shifts in food-growing areas Changes in crop yields Increased irrigation demands Increased pests, crop diseases, and weeds in warmer areas Agriculture Extinction of some plant and animal species Loss of habitats Disruption of aquatic life Biodiversity Prolonged heat waves and droughts More intense hurricanes, typhoons, tornadoes, and violent storms Weather Extremes Increased deaths More environmental refugees Increased migration Human Population

91
Direct manifestations
Heat waves and periods of unusually warm weather Sea level rise and coastal flooding Glaciers melting Arctic and Antarctic warming with ice shelves breaking up Increase severity of weather Zooplankton are dying in the Pacific Ocean

92
Heat wave kills 30, no relief in sight
July 27, 1999

93
Monster iceberg breaks off Antarctic ice shelf
May 10, 2002

94
Cold water melting from Antarctica's ice cap and
Greenland Cold water melting from Antarctica's ice cap and icebergs falls to the ocean floor and surges northward, affecting worldwide circulation. Antarctica

95
present sea level (meters)
Today’s sea level Years before present Present 250,000 200,000 150,000 100,000 50,000 –130 –426 present sea level (meters) Height above or below Height below present sea level (feet)
 Height above or below. Height below present. sea level (feet)")
96
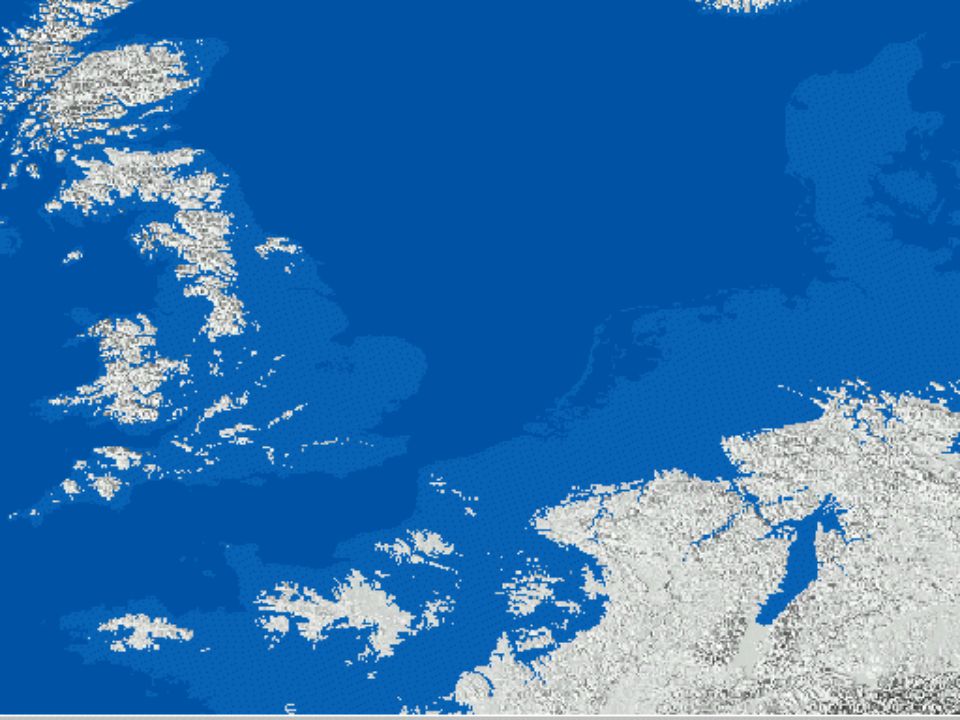
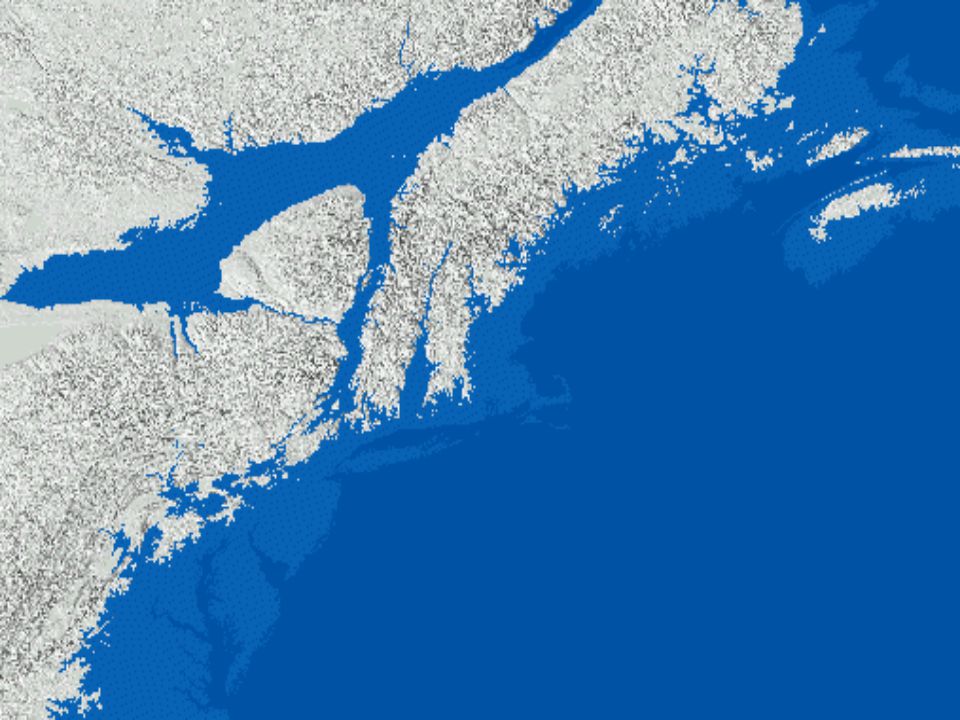
If all the ice on Greenland melted, world sea levels would rise about six metres (20 feet) If all the ice on the Antarctic continent melted, sea levels would rise over 70 metres (230 feet) This is unlikely to happen, but small increases will continue.
 If all the ice on the Antarctic continent melted, sea levels would rise over 70 metres (230 feet) This is unlikely to happen, but small increases will continue.")
101
Possible Consequences
Spreading disease Earlier spring arrival Plant and animal range shifts and population declines Coral reef bleaching Downpours, heavy snowfalls, and flooding Droughts and fires

102
Global warming may harm human health
November 16, 1998 Climatic changes related to global warming could foster dangerous outbreaks of cholera, dengue fever and malaria, …

103
Study: Global warming spurs migrations
Thursday, January 2, 2003 Rising global temperatures that have lured plants into early bloom and birds to nest earlier in the spring are altering the ranges and behavior of hundreds of plant and animal species worldwide, two studies conclude

104
Report: Coral bleaching hits record level
May 19, 1999 Global warming has been linked to an unprecedented episode of coral bleaching in 1998, …

105
Vicious cycle: Global warming feeds fire potential
November 2, 2000 Global warming may greatly accelerate the fire cycle in the desert ecosystem of North America, according to a study published today in the journal Nature. Elevated carbon dioxide levels, the result of increased fossil fuel burning, can alter the delicate balance of grasses in desert areas, the report notes. This finding may have major implications for the biodiversity and health of desert ecosystems in the western United States. "This could be a real problem for land managers," said Stan Smith, a professor of biology at the University of Nevada in Las Vegas and lead author of the study.

106
http://www. soton. ac. uk/~engenvir/environment/air/greenhouse
107
Anomaly = difference between actual value and some mean value; in this case the mean is a 30 year average

108
Warmest Years on Record
1981 1983 1987 1988 1989 1990 1991 1994 1995 1996 1997 1998 1999 2000 2001

109
Ozone Hole

110
Understanding Ozone http://royal. okanagan. bc
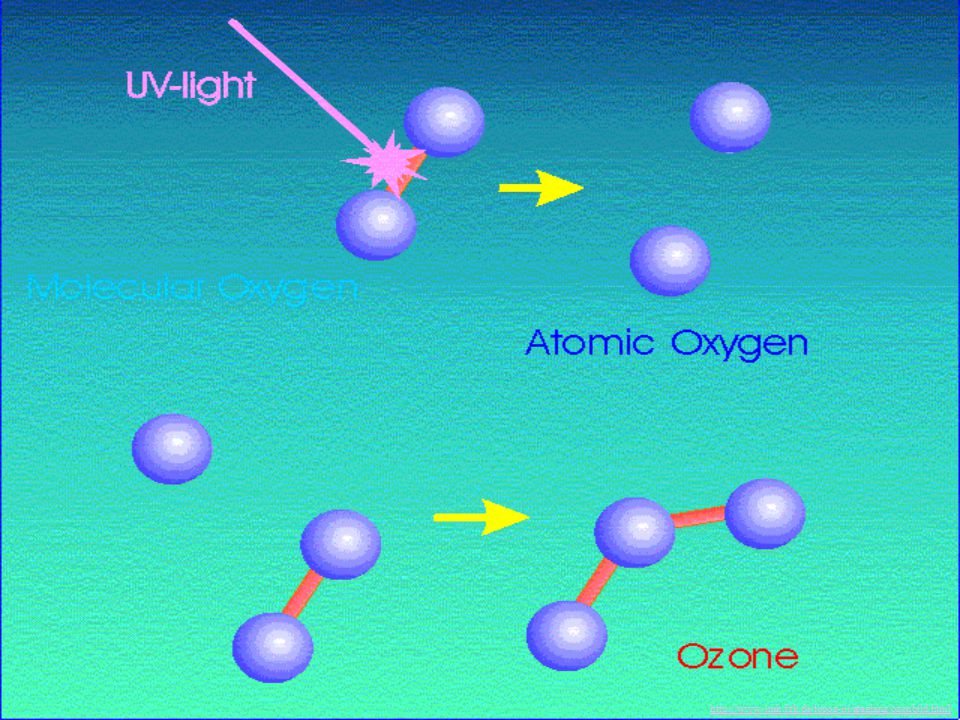
Discovered in 1839 by German scientist Christian Friedrich Schonbein Pale blue, unstable molecule made of three oxygen atoms Vital to life in the stratosphere Harmful to plants and humans in the troposphere Concentration: stratosphere up to 15 ppm at about 25 km Formed when atomic oxygen (O) from higher parts of the atmosphere collides with molecular oxygen (O2) in the stratosphere UV radiation splits the ozone back to O and O2 and it can form another ozone molecule
 from higher parts of the atmosphere collides with molecular oxygen (O2) in the stratosphere. UV radiation splits the ozone back to O and O2 and it can form another ozone molecule.")
113
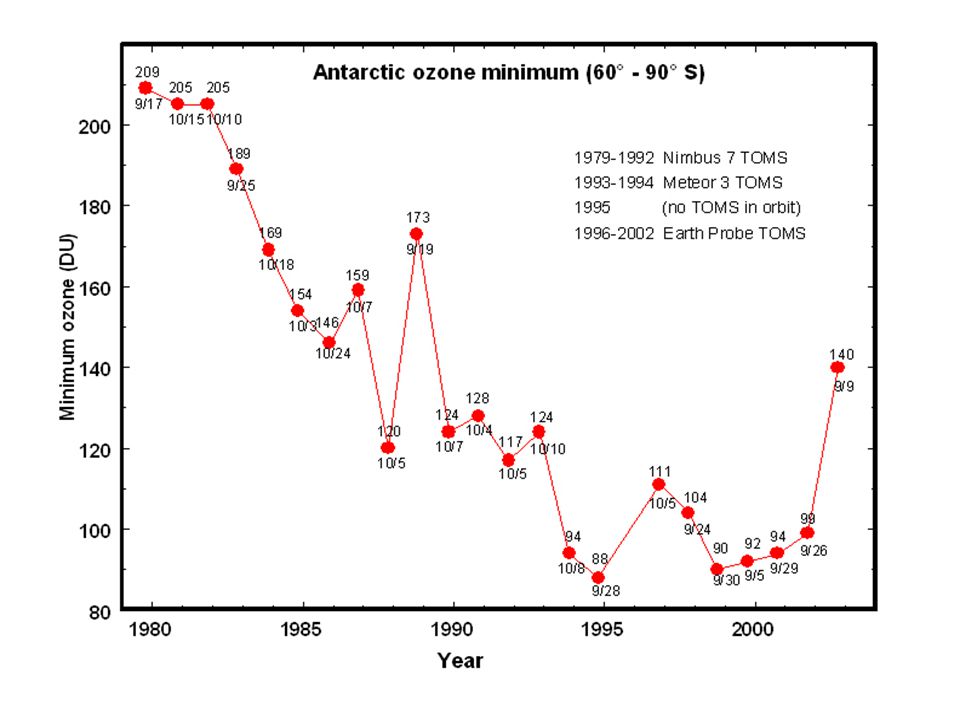
The Ozone Hole First discovered in 1985: observations from Antarctica extend back into 1950’s. Characterized as a rapid depletion of ozone over Antarctica during spring. Ozone hole season, Spring (August – October) Ozone hole located over mainly over Antarctica. Ozone hole recovers by late December Ozone hole caused by human chemicals (CFC’s) Ozone hole not present in early 1970’s Observations over Antarctica data back to the 1950’s. The discovery of the ozone hole occurred in It turns out that the research group measuring ozone had seen a sharp decline in ozone levels during October over Antarctica (see next overhead), but didn’t report it immediately because they worried that their instrument might be faulty. Finally, after a few years of testing, they published a paper documenting this rapid decline of ozone levels. However, at the time, there was no explanation for why ozone was declining. During that same time period, NASA was also observing ozone levels globally. However, they didn’t expect to see signs of ozone depletion over Antarctica, and consequently, ‘missed’ the ozone hole due to a computer glitch. When they realized their mistake, and fixed up the computer problem, they also saw the clear signs of an emerging hole in the ozone layer. The ozone hole is characterized by a rapid depletion of ozone over Antarctica during the springtime. The science of the ozone hole was well understood by the early 1990s.
 Ozone hole located over mainly over Antarctica. Ozone hole recovers by late December. Ozone hole caused by human chemicals (CFC’s) Ozone hole not present in early 1970’s. Observations over Antarctica data back to the 1950’s. The discovery of the ozone hole occurred in It turns out that the research group measuring ozone had seen a sharp decline in ozone levels during October over Antarctica (see next overhead), but didn’t report it immediately because they worried that their instrument might be faulty. Finally, after a few years of testing, they published a paper documenting this rapid decline of ozone levels. However, at the time, there was no explanation for why ozone was declining. During that same time period, NASA was also observing ozone levels globally. However, they didn’t expect to see signs of ozone depletion over Antarctica, and consequently, ‘missed’ the ozone hole due to a computer glitch. When they realized their mistake, and fixed up the computer problem, they also saw the clear signs of an emerging hole in the ozone layer. The ozone hole is characterized by a rapid depletion of ozone over Antarctica during the springtime. The science of the ozone hole was well understood by the early 1990s.")
115
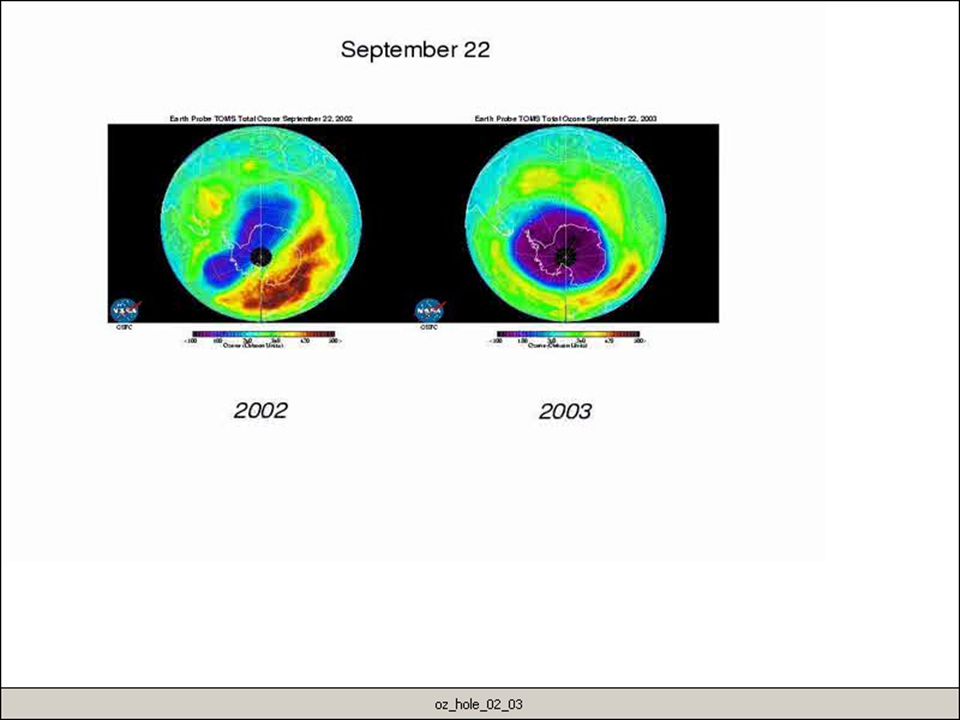
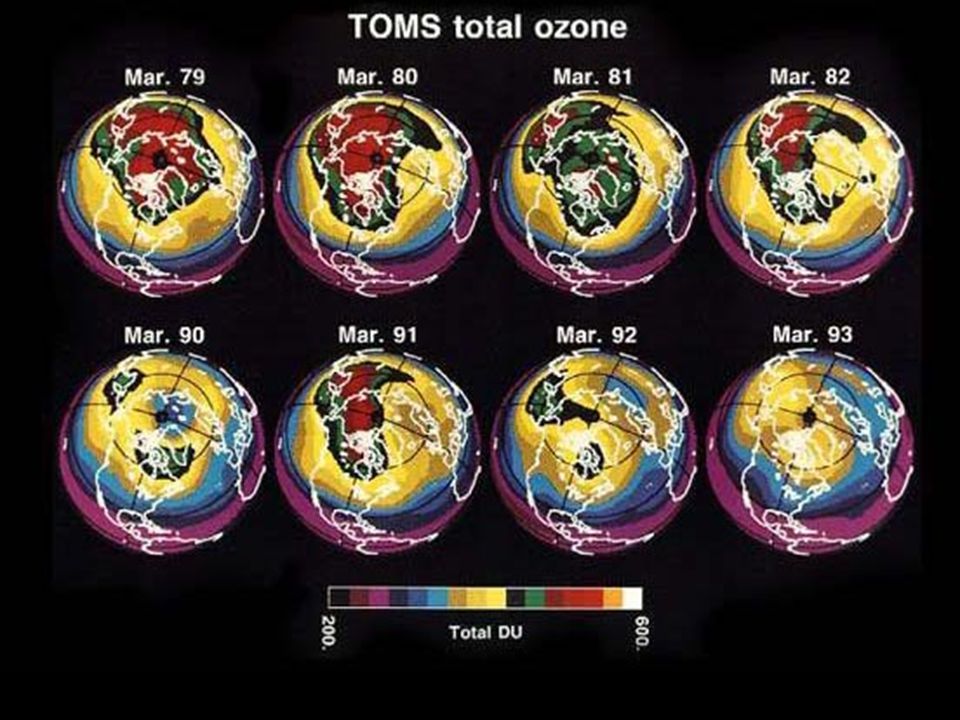
(Key Learning Figure) Many students (and the public) have the perception that the ozone hole (and ozone in general) is getting much worse. This is likely due to press reports that usually say, ‘the ozone hole reached it’s largest size…’ The reality is that in the last decade, the size and severity of the ozone hole have stayed about the same, compared to rapid changes seen in the middle 1980’s. Year to year variations in the depth and severity of the ozone hole is really a function of the atmospheric weather conditions (I.e. the colder the winter, the more greater the ozone loss). In addition, the ozone hole is about as bad as it can get. Between km, all the ozone is essentially destroyed during spring over Antarctica, so it couldn’t get much worse. Thus, we don’t expect the size and depth of the ozone hole to change dramatically in the future. Rather, it is expected that the size of the ozone hole is about as big as it’s going to get, and with time (10 or more years) and reduced chlorine levels, we should start to see the size of the ozone hole get smaller. Thus, this graphic is intended to illustrate how in the 80’s, the size of the ozone hole increased rapidly, while in the 90’s and 2000, things stabilized.
 have the perception that the ozone hole (and ozone in general) is getting much worse. This is likely due to press reports that usually say, ‘the ozone hole reached it’s largest size…’ The reality is that in the last decade, the size and severity of the ozone hole have stayed about the same, compared to rapid changes seen in the middle 1980’s. Year to year variations in the depth and severity of the ozone hole is really a function of the atmospheric weather conditions (I.e. the colder the winter, the more greater the ozone loss). In addition, the ozone hole is about as bad as it can get. Between km, all the ozone is essentially destroyed during spring over Antarctica, so it couldn’t get much worse. Thus, we don’t expect the size and depth of the ozone hole to change dramatically in the future. Rather, it is expected that the size of the ozone hole is about as big as it’s going to get, and with time (10 or more years) and reduced chlorine levels, we should start to see the size of the ozone hole get smaller. Thus, this graphic is intended to illustrate how in the 80’s, the size of the ozone hole increased rapidly, while in the 90’s and 2000, things stabilized.")
116
science.widener.edu/svb/ atmo_chem/oct15.html

118
Ozone hole stabilizes October 17, 2001
WASHINGTON (CNN) A hole in the Earth's protective ozone layer is about the same size as in the past three years, according to scientists at the National Oceanic and Atmospheric Administration, who predict it will hold steady in the near future. Satellite data show the hole over Antarctica, which allows more harmful solar radiation to reach the Earth, peaked this year at about 10 million square miles (26 million square km), roughly the size of North America.
 -- A hole in the Earth s protective ozone layer. is about the same size as in the past three. years, according to scientists at the National. Oceanic and Atmospheric Administration, who predict it will hold steady in the near. future. Satellite data show the hole over Antarctica, which allows more harmful solar radiation to. reach the Earth, peaked this year at about 10. million square miles (26 million square km), roughly the size of North America.")
120
History of Ozone Depletion
CFCs developed in 40’s and 50’s Refrigerants, propellants, fire retardants 1970’s CFCs detected in atmosphere. Many of these have long atmospheric lifetimes (10’s to 100’s of years) 1974 Rowland and Molina propose that CFC’s can destroy ozone in the stratosphere. CFCs broken apart by UV radiation forming chlorine which can destroy ozone quickly: O3 +Cl ClO+ O2 (Catalytic Reaction) ClO+O Cl+O2 (advanced) CFC’s are a class of chemicals that were developed in the 40 and 50s for many valuable applications including refrigerants, propellants (for spray cans) and fire retardants. One of the most remarkable and extremely valuable characterizes of CFC’s is that they do not react anything. Therefore, if you have some type of fire, you can safely use CFC’s to extinguish the fire, not worrying if your fire retardant is going to enhance the fire. This characteristics of CFC’s also means that many CFC’s remain in the atmosphere for many years (10’s to 100’s). They have long atmospheric lifetimes. Therefore, if you release a CFC molecule into the atmosphere, it may bounce around in the atmosphere for many many years. In 1974, two scientist (Rowland and Molina; who later received the Nobel Prize in chemistry) suggested that because CFC’s are around for a long time, they may eventually reach the upper atmosphere, where they can be broken apart by the sun. CFC’s contain chlorine, a chemical that can rapidly destroy ozone under certain conditions, and in some cases, a single chlorine atom may destroy thousands of ozone molecules through a self replicating cycles (catalytic reaction). The catalytic cycle is self replicating…ozone gets converted by chlorine, producing ClO and more oxygen. The ClO then reacts with a free oxygen atom, thereby producing another Cl atom. The cycle can then continue again.
 1974 Rowland and Molina propose that CFC’s can destroy ozone in the stratosphere. CFCs broken apart by UV radiation forming chlorine which can destroy ozone quickly: O3 +Cl ClO+ O2 (Catalytic Reaction) ClO+O Cl+O2. (advanced) CFC’s are a class of chemicals that were developed in the 40 and 50s for many valuable applications including refrigerants, propellants (for spray cans) and fire retardants. One of the most remarkable and extremely valuable characterizes of CFC’s is that they do not react anything. Therefore, if you have some type of fire, you can safely use CFC’s to extinguish the fire, not worrying if your fire retardant is going to enhance the fire. This characteristics of CFC’s also means that many CFC’s remain in the atmosphere for many years (10’s to 100’s). They have long atmospheric lifetimes. Therefore, if you release a CFC molecule into the atmosphere, it may bounce around in the atmosphere for many many years. In 1974, two scientist (Rowland and Molina; who later received the Nobel Prize in chemistry) suggested that because CFC’s are around for a long time, they may eventually reach the upper atmosphere, where they can be broken apart by the sun. CFC’s contain chlorine, a chemical that can rapidly destroy ozone under certain conditions, and in some cases, a single chlorine atom may destroy thousands of ozone molecules through a self replicating cycles (catalytic reaction). The catalytic cycle is self replicating…ozone gets converted by chlorine, producing ClO and more oxygen. The ClO then reacts with a free oxygen atom, thereby producing another Cl atom. The cycle can then continue again.")
121
Chlorofluorocarbons or CFCs
First produced by General Motors Corporation in 1928, CFCs were created as a replacement to the toxic refrigerant ammonia CFCs have also been used as a propellant in spray cans, cleaner for electronics, sterilant for hospital equipment, and to produce the bubbles in Styrofoam

122
CFCs are cheap to produce and very stable compounds, lasting up to 200 years in the atmosphere
Many countries have recently passed laws banning nonessential use of these chemicals. Nevertheless, by 1988 some 320,000 metric tons of CFCs were used worldwide.

125
Action of CFCs CFCs created at the Earth's surface drift slowly upward to the stratosphere where UV radiation from the sun causes their decomposition and the release of chlorine Chlorine in turn attacks the molecules of ozone converting them into oxygen molecules Cl + O3 »»» ClO + O2 ClO + O »»» Cl + O2

126
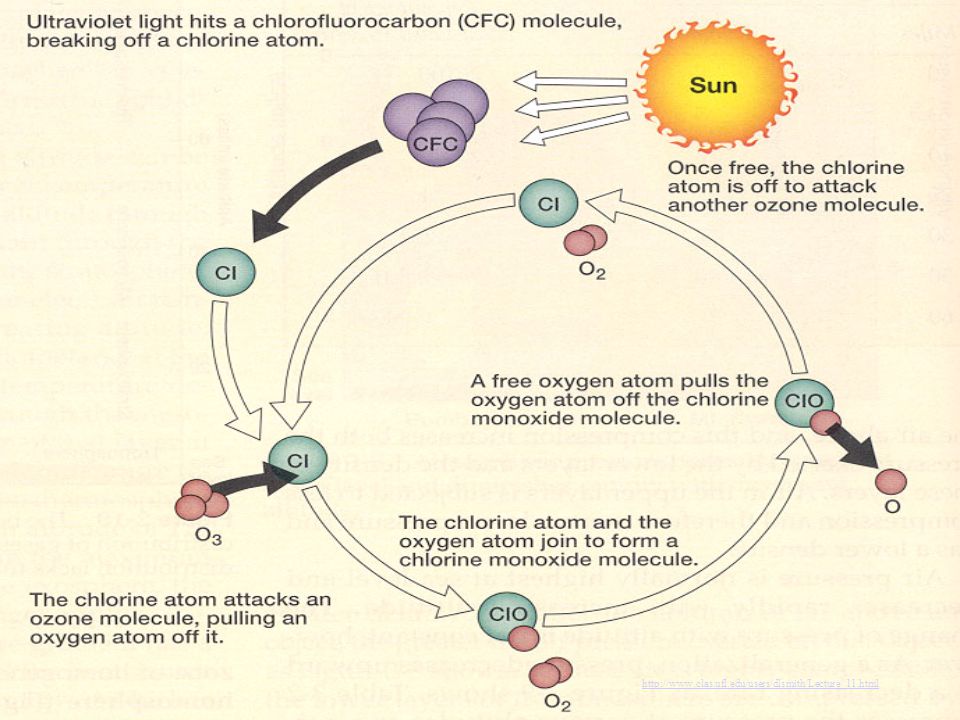
Ultraviolet light hits a chlorofluorocarbon
(CFC) molecule, such as CFCl3, breaking off a chlorine atom and leaving CFCl2. Sun Cl Cl Once free, the chlorine atom is off to attack another ozone molecule and begin the cycle again. C Cl F UV radiation Cl Cl O O A free oxygen atom pulls the oxygen atom off the chlorine monoxide molecule to form O2. The chlorine atom attacks an ozone (O3) molecule, pulling an oxygen atom off it and leaving an oxygen molecule (O2). Cl Cl O O O O O The chlorine atom and the oxygen atom join to form a chlorine monoxide molecule (ClO) Cl O O O
 molecule, such as CFCl3, breaking. off a chlorine atom and leaving. CFCl2. Sun. Cl. Cl. Once free, the chlorine atom is off. to attack another ozone molecule. and begin the cycle again. C. Cl. F. UV radiation. Cl. Cl. O. O. A free oxygen atom pulls. the oxygen atom off. the chlorine monoxide. molecule to form O2. The chlorine atom attacks. an ozone (O3) molecule, pulling an oxygen atom. off it and leaving. an oxygen. molecule (O2). Cl. Cl. O. O. O. O. O. The chlorine. atom and the. oxygen atom join. to form a chlorine. monoxide molecule (ClO) Cl. O. O. O.")
128
A single chlorine atom removes about 100,000 ozone molecules before it is taken out of operation by other substances

129
Low and Middle Latitudes
Current measurements indicate that the amount of ozone in the stratosphere of the low and middle latitudes has decreased by about 3% with estimates that it will decrease by10% by 2025

131
Harmful effects of UV radiation.
Skin cancer (ultraviolet radiation can destroy acids in DNA) Cataracts and sun burning Suppression of immune systems Adverse impact on crops and animals Reduction in the growth of ocean phytoplankton Cooling of the Earth's stratosphere and possibly some surface climatic effect Degradation of paints and plastic material
 Cataracts and sun burning. Suppression of immune systems. Adverse impact on crops and animals. Reduction in the growth of ocean phytoplankton. Cooling of the Earth s stratosphere and possibly some surface climatic effect. Degradation of paints and plastic material.")
132
matrix.ucdavis.edu/tumors/tradition/ gallery-ssmm.html

133
www.snec.com.sg/clinical_services/ cataract.asp

134
Conclusion Ozone Depletion Exists and effects certain areas of the Earth more than others Currently, one in five North Americans and one in two Australians will develop some form of skin cancer in their lifetime With a sustained 10% decrease in stratospheric ozone, an additional 300,000 non-melanoma and 4,500 melanoma skin cancers could be expected world-wide, according to UNEP estimates.

136
Acid Deposition

137
Measuring Acid Rain Acid rain is measured using a "pH" scale.
The lower a substance's pH, the more acidic it is. Pure water has a pH of 7.0. Normal rain is slightly acidic and has a pH of about 5.6 Any rainfall has a pH value less than 5.6 is defined as acid rain As of the year 2000, the most acidic rain falling in the US has a pH of about 4.3.

138
Two Forms… Wet Refers to acid rain, fog, sleet, cloud vapor and snow.
Dry Refers to acidic gases and particles.

139
Compounds Two main contributers to acid deposition:
Sulfur Dioxide (SO2) Nitrogen Oxides (NOx) * 66% of all sulfur dioxides and 25% of all nitrogen oxides comes from electric power generation that produces energy by burning fossil fuels.
 Nitrogen Oxides (NOx) * 66% of all sulfur dioxides and 25% of all nitrogen oxides comes from electric power generation that produces energy by burning fossil fuels.")
140
When gas pollutants e.g. sulphur dioxide, nitrogen dioxide dissolve in rain water, various acids are formed. CO2 + H2O H2CO3 (carbonic acid) SO2 + H2O H2SO3 (sulphorous acid) NO2 + H2O HNO2 (nitrous acid) HNO3 (nitric acid)
 SO2 + H2O H2SO3 (sulphorous acid) NO2 + H2O HNO2 (nitrous acid) + HNO3 (nitric acid)")
141
Causes of Acid Rain Sulfur dioxide (SO2) and nitrogen oxides (NOx) are the primary causes of acid rain. In the US, About 2/3 of all SO2 and 1/4 of all NOx comes from electric power generation that relies on burning fossil fuels like coal.

142
sulfuric acid nitric acid indirect health effects
Acidic Precipitation Primary Pollutants SO2 NO2 Secondary Pollutants H2SO4 HNO2 sulfuric acid nitric acid acidic precipitation vegetation direct toxicity indirect health effects water Fossil fuels Power plants Industrial emissions Auto emissions soils leaching of minerals sediments leaching aluminum

143
Several processes can result in the formation of acid deposition
Several processes can result in the formation of acid deposition. Nitrogen oxides (NOx) and sulfur dioxide (SO2) released into the atmosphere from a variety of sources call fall to the ground simply as dry deposition. This dry deposition can then be converted into acids when these deposited chemicals meet water. Most wet acid deposition forms when nitrogen oxides (NOx) and sulfur dioxide (SO2) are converted to nitric acid (HNO3) and sulfuric acid (H2SO4) through oxidation and dissolution. Wet deposition can also form when ammonia gas (NH3) from natural sources is converted into ammonium (NH4).
 and sulfur dioxide (SO2) released into the atmosphere from a variety of sources call fall to the ground simply as dry deposition. This dry deposition can then be converted into acids when these deposited chemicals meet water. Most wet acid deposition forms when nitrogen oxides (NOx) and sulfur dioxide (SO2) are converted to nitric acid (HNO3) and sulfuric acid (H2SO4) through oxidation and dissolution. Wet deposition can also form when ammonia gas (NH3) from natural sources is converted into ammonium (NH4).")
144
Acidic Precipitation Wind Transformation to sulfuric acid (H2SO4)
and nitric acid (HNO3) Windborne ammonia gas and particles of cultivated soil partially neutralize acids and form dry sulfate and nitrate salts Wet acid deposition (droplets of H2SO4 and HNO3 dissolved in rain and snow) Dry acid deposition (sulfur dioxide gas and particles of sulfate and nitrate salts) Sulfur dioxide (SO2) and NO Nitric oxide (NO) Acid fog Farm Lakes in deep soil high in limestone are buffered Ocean Lakes in shallow soil low in limestone become acidic
 Windborne ammonia gas. and particles of cultivated soil. partially neutralize acids and. form dry sulfate and nitrate salts. Wet acid deposition. (droplets of H2SO4 and. HNO3 dissolved in rain. and snow) Dry acid. deposition. (sulfur dioxide. gas and particles. of sulfate and. nitrate salts) Sulfur dioxide (SO2) and NO. Nitric oxide (NO) Acid fog. Farm. Lakes in. deep soil. high in limestone. are buffered. Ocean. Lakes in shallow. soil low in. limestone. become. acidic.")
145
BIOL 349 Atmosphere Fig , p. 428

146
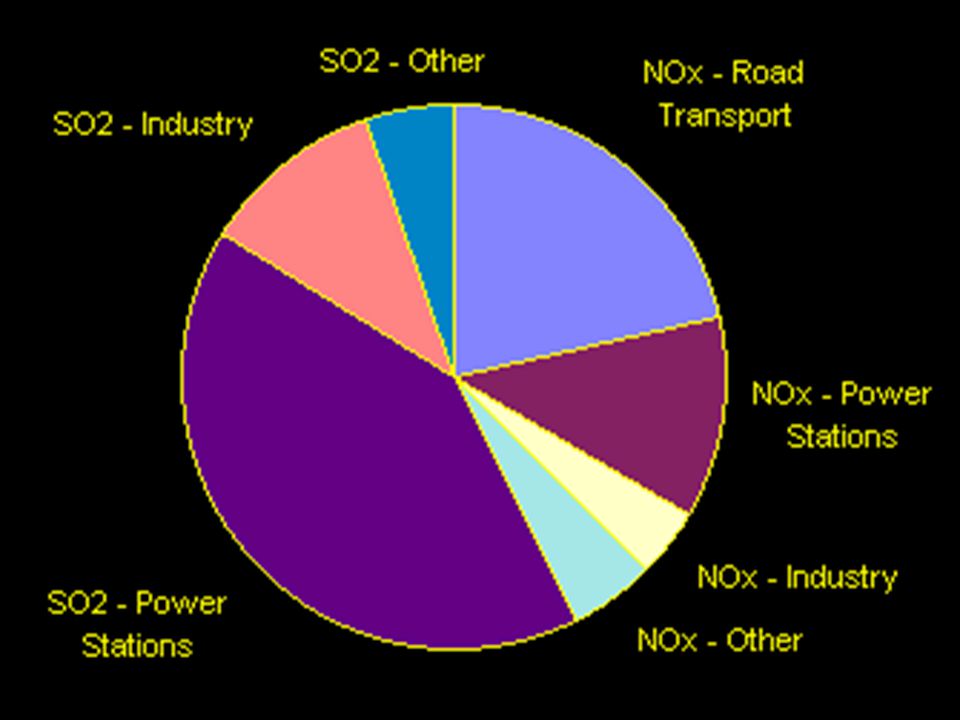
Sulphur dioxide emission (1997)
")
148
“Wet” Acid Rain Acidic water flows over and through the ground, it affects a variety of plants and animals.

149
“Dry” Acid Rain Dry deposition refers to acidic gases and particles.
About half of the acidity in the atmosphere falls back to earth through dry deposition. The wind blows these acidic particles and gases onto buildings, cars, homes, and trees.

150
Increased Acidity Dry deposited gases and particles can also be washed from trees and other surfaces by rainstorms. The runoff water adds those acids to the acid rain, making the combination more acidic than the falling rain alone.

151
Effects of Acid Rain The strength of the effects depend on many factors How acidic the water is The chemistry and buffering capacity of the soils involved The types of fish, trees, and other living things that rely on the water

152
Effects of Acid Rain Has a variety of effects, including damage to forests and soils, fish and other living things, materials, and human health. Also reduces how far and how clearly we can see through the air, an effect called visibility reduction. Effects of acid rain are most clearly seen in the aquatic environments Most lakes and streams have a pH between 6 and 8

153
Buffering Capacity Acid rain primarily affects sensitive bodies of water, which are located in watersheds whose soils have a limited "buffering capacity“ Lakes and streams become acidic when the water itself and its surrounding soil cannot buffer the acid rain enough to neutralize it.

154
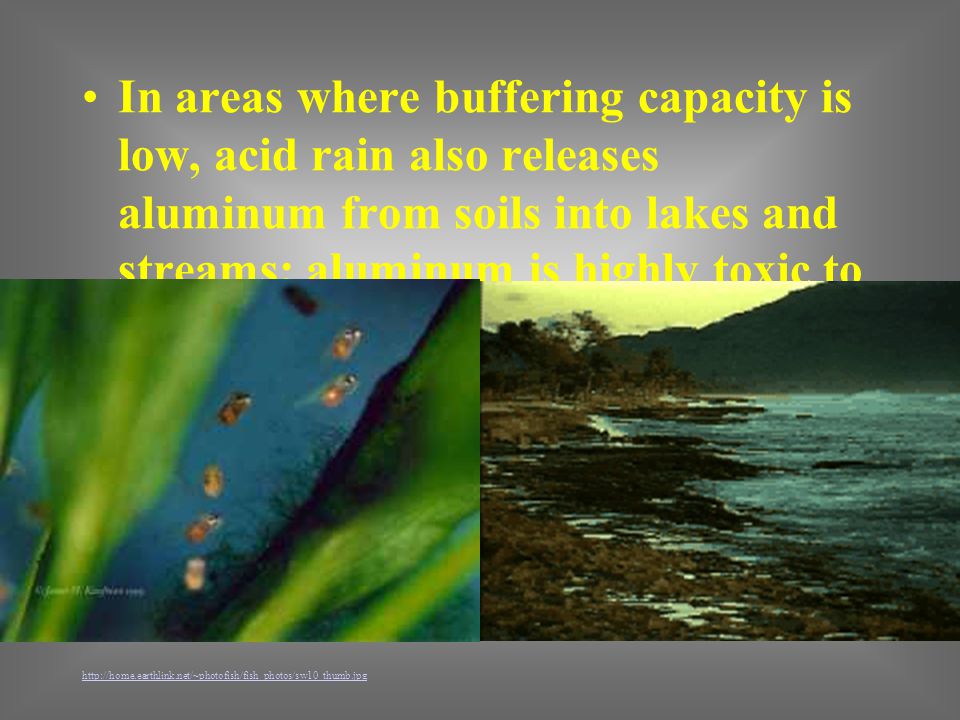
In areas where buffering capacity is low, acid rain also releases aluminum from soils into lakes and streams; aluminum is highly toxic to many species of aquatic organisms.
156
Effects on Wildlife Generally, the young of most species are more sensitive to environmental conditions than adults. At pH 5, most fish eggs cannot hatch. At lower pH levels, some adult fish die. Some acid lakes have no fish.

157
Effects on Wildlife Both low pH and increased aluminum levels are directly toxic to fish. In addition, low pH and increased aluminum levels cause chronic stress that may not kill individual fish, but leads to lower body weight and smaller size and makes fish less able to compete for food and habitat.

158
Acid Rain and Forests Acid rain does not usually kill trees directly.
Instead, it is more likely to weaken trees by damaging their leaves, limiting the nutrients available to them, or exposing them to toxic substances slowly released from the soil.

159
Mongolia Germany

160
Great Smoky Mountains, NC
Effects of Acid Rain Great Smoky Mountains, NC

161
Nutrients Acidic water dissolves the nutrients and helpful minerals in the soil and then washes them away before trees and other plants can use them to grow. Acid rain also causes the release of substances that are toxic to trees and plants, such as aluminum, into the soil.

163
Air Pollution Prevention

164
Specific Air Pollution Treatment Technology
Traditional Move factory to remote location Build taller smokestack so wind blows pollution elsewhere New Biofiltration : vapors pumped through soil where microbes degrade High-energy destruction: high-voltage electricity Membrane separation: diffusion of organic vapors through membrane Oxidation: High temperature combustor

165
Absorption

166
Adsorption

167
Combustion

168
Cyclone

169
Filtration

170
Electrostatic Precipitator

171
Liquid Scrubber

172
Sulfur Dioxide Control
Advanced Flue Gas Desulfurization Demonstration Project |Objective: To reduce SO2 emissions by 95% or more at approximately one-half the cost of conventional scrubbing technology, significantly reduce space requirements, and create no new waste streams. Technology/Project Description: Pure Air built a single SO2 absorber for a 528-MWe power plant. Although the largest capacity absorber module of its time in the United States, space requirements were modest because no spare or backup absorber modules were required. The absorber performed three functions in a single vessel: prequenching, absorbing, and oxidation of sludge to gypsum. Additionally, the absorber was of a co-current design, in which the flue gas and scrubbing slurry move in the same direction and at a relatively high velocity compared to that in conventional scrubbers. These features all combined to yield a state-of-the-art SO2 absorber that was more compact and less expensive than contemporary conventional scrubbers. Other technical features included the injection of pulverized limestone directly into the absorber, a device called an air rotary sparger located within the base of the absorber, and a novel wastewater evaporation system. The air rotary sparger combined the functions of agitation and air distribution into one piece of equipment to facilitate the oxidation of calcium sulfite to gypsum. Pure Air also demonstrated a unique gypsum agglomeration process, PowerChip®, to significantly enhance handling characteristics of adsorbed flue gas desulfurization AFGD-derived gypsum.

173
Air Pollution Results

174
Source: NATIONAL AIR POLLUTANT EMISSION TRENDS,
United States Environmental Protection Agency Office of Air Quality Planning and Standards EPA-454/R March 2000

175
Comparison of 1970 and 1999 Emissions
Source: Latest Findings on National Air Quality: 1999 Status and Trends EPA EPA-454/F Since the 1970 Clean Air Act was signed into law, emissions of each of the six pollutants decreased, with the exception of NOx . Between 1970 and 1999, emissions of NOx increased 17 percent. The majority of this increase can be attributed to heavy-duty diesel vehicles and coal-fired power plants. EPA has major initiatives to reduce emissions of NOx considerably from these sources. Emissions of NOx contribute to the formation of ground-level ozone (smog), acid rain, and other environmental problems, even after being carried by the wind hundreds of miles from their original source.
, acid rain, and other environmental problems, even after being carried by the. wind hundreds of miles from their original source.")
177
Between 1970 and 1999, U.S. population increased 33 percent, vehicle miles traveled increased 140 percent, and gross domestic product increased 147 percent. At the same time, total emissions of the six principal air pollutants decreased 31 percent.

178
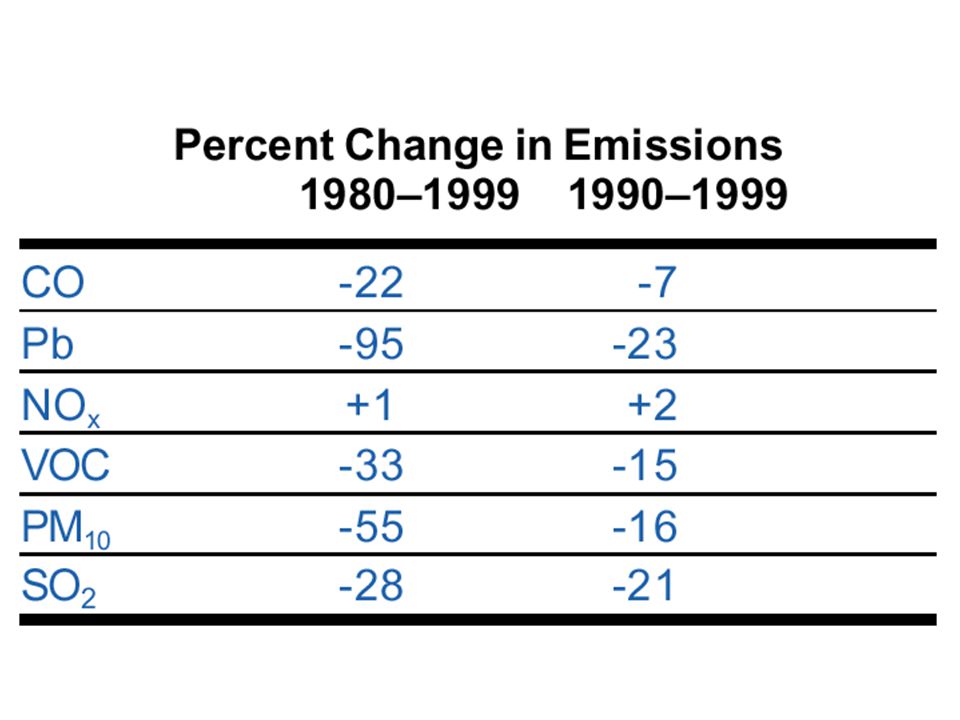
EPA tracks trends in air quality based on actual measurements of
pollutant concentrations in the ambient (outside) air at monitoring sites across the country. Monitoring stations are operated by state, tribal, and local government agencies as well as some federal agencies, including EPA. Trends are derived by averaging direct measurements from these monitoring stations on a yearly basis. The chart at above shows that the air quality based on concentrations of the principal pollutants has improved nationally over the last 20 years (1980–1999). The most notable improvements are seen for Pb, CO, and SO2 with 94-, 57- and 50-percent reductions, respectively.
 air at monitoring. sites across the country. Monitoring stations are operated by state, tribal, and local government agencies as well as some federal. agencies, including EPA. Trends are derived by averaging direct. measurements from these monitoring stations on a yearly basis. The. chart at above shows that the air quality based on concentrations of. the principal pollutants has improved nationally over the last 20. years (1980–1999). The most notable improvements are seen for Pb, CO, and SO2 with 94-, 57- and 50-percent reductions, respectively.")
179
Number of People Living in Counties with Air Quality Concentrations Above the Level of the National Ambient Air Quality Standards (NAAQS) in 1999 Despite great progress in air quality improvement, approximately 62 million people nationwide still lived in counties with pollution levels above the national air quality standards in This number does not take into consideration the 8-hour ozone standard. Blue bars represent 8-hour standard for ozone.

180
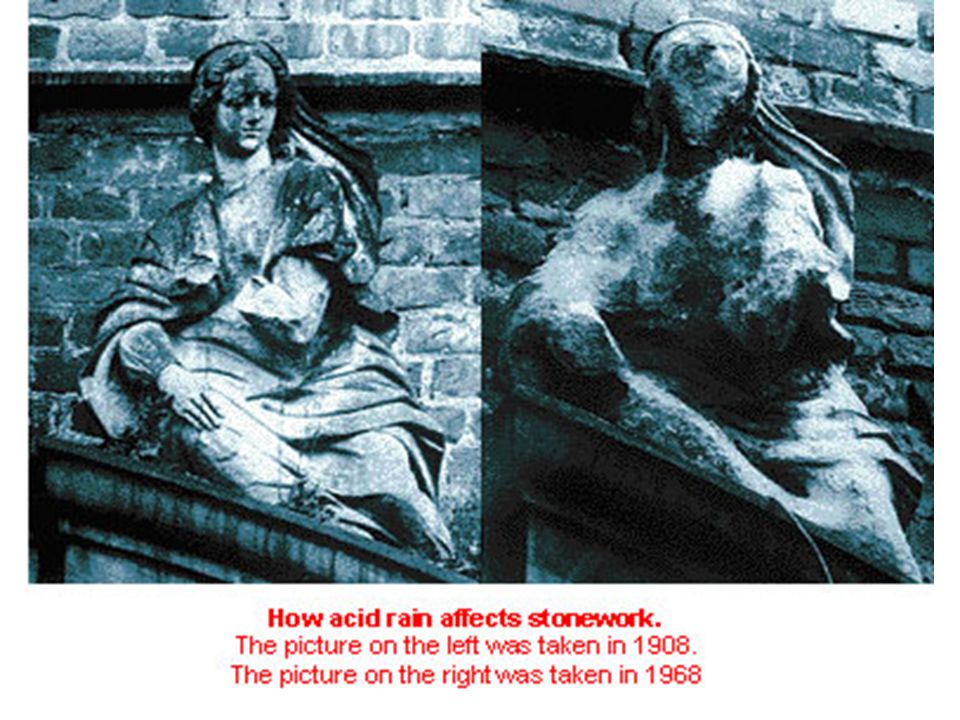
Trends in Sulfur Dioxide Emissions Following Implementation of Phase I of the Acid Rain Program: Total State-level Utility SO2 (1980, 1990, 1999) This set of maps illustrates the geographic and temporal trends in state-level utility sulfur dioxide (SO2) emissions before and during implementation of Phase I of the Acid Rain Program. The maps illustrate total state-level utility SO2 emissions in 1980, 1990, and 1999. Total sulfur dioxide emissions were significantly reduced during Phase I of the Acid Rain Program. In the first five years of the program, Phase I sources reduced SO2 emissions by more than 50% from 1980 levels; total utility SO2 emissions (Phase I and II sources) were reduced almost 30% nationwide. Although most SO2 emissions occur in the Midwestern U.S., it is important to note that over time, this same region has also seen the most significant decrease in SO2 emissions in the country. The highest SO2 emitting states in 1980 (Ohio, Indiana, and Pennsylvania), have achieved an average reduction of about 40%, from 1980 levels. Acid rain causes acidification of lakes and streams and contributes to damage of trees at high elevations (for example, red spruce trees above 2,000 feet) and many sensitive forest soils. In addition, acid rain accelerates the decay of building materials and paints, including irreplaceable buildings, statues,and sculptures that are part of our nation's cultural heritage. Prior to falling to the earth, SO2 and NOx gases and their particulate matter derivatives, sulfates and nitrates, contribute to visibility degradation and harm public health.
 emissions before and during implementation of Phase I of the Acid Rain Program. The maps illustrate total state-level utility SO2 emissions in 1980, 1990, and Total sulfur dioxide emissions were significantly reduced during Phase I of the Acid Rain Program. In the first five years of the program, Phase I sources reduced SO2 emissions by more than 50% from 1980 levels; total utility SO2 emissions (Phase I and II sources) were reduced almost 30% nationwide. Although most SO2 emissions occur in the Midwestern U.S., it is important to note that over time, this same region has also seen the most significant decrease in SO2 emissions in the country. The highest SO2 emitting states in 1980 (Ohio, Indiana, and Pennsylvania), have achieved an average reduction of about 40%, from 1980 levels. Acid rain causes acidification of lakes and streams and contributes to damage of trees at high elevations (for example, red spruce trees above 2,000 feet) and many sensitive forest soils. In addition, acid rain accelerates the decay of building materials and paints, including irreplaceable buildings, statues,and sculptures that are part of our nation s cultural heritage. Prior to falling to the earth, SO2 and NOx gases and their particulate matter derivatives, sulfates and nitrates, contribute to visibility degradation and harm public health.")
181
Fifty Years of Air Pollution
Figures are in millions of metric tons per year

182
Mobile Sources: The Last Ten Years
VOCs CO NOx PM10 SOx Lead Mobile Sources: The Last Ten Years -3% -8% -10% -24% -29% Percent reductions shown are based on estimates of tons/year from mobile sources over the time period -85%

183
Who is Affected by Air Pollution?
63 Over 74 million people are subjected to high levels of at least one of these pollutants Who is Affected by Air Pollution? 22 19 9 5 1 Ozone CO NO PM10 SO2 Lead Millions of people living in counties with air quality that exceeds each NAAQS (1990 data)
")
184
Milestones in the Control of Automotive Emissions
Autos linked to air pollution Original CAA, PCV valves HC & CO exhaust controls CAA amendments, EPA formed Evaporative controls First I/M Program NOx exhaust controls First catalytic converters New cars meet statutory limits Volatility limits on gasoline New CAA Amendments Milestones in the Control of Automotive Emissions

185
1987 Montreal Protocol: CFC emissions should be reduced by 50% by the year 2000 (they had been increasing 3% per year.) 1990 London amendments: production of CFCs, CCl4, and halons should cease entirely by 2000. 1992 Copenhagen agreements: phase-out accelerated to 1996.

186
What is the Kyoto Protocol?
How did we get to Kyoto? What are the goals of Kyoto? Is Kyoto enough?

187
Steps to Kyoto 1985 International Council of Scientific Unions (Prof. Bert Bolin) “Many important economic and social decisions are being made today on long term projects, all based on the assumption that past climatic data, without modification, are a reliable guide to the future. This is no longer a good assumption”

188
Steps to Kyoto 1988 - Toronto - creation of IPCC
warmest summer to date, international meeting in Toronto Intergovernmental Panel on Climate Change formed First report (FAR) overview of the current science of climate change
 overview of the current science of climate change.")
189
IPCC IPCC headed by Prof. Bert Bolin
3 working groups Climate Science Climate Impacts Response Strategies FAR used in Earth Summit meeting in Rio - United Nations Framework Convention on Climate Change

190
IPCC 1995 IPCC Second Assessment Report (SAR) completed, published in 1996 WG I Climate Science WG II Impact, Adaptation and Mitigation WG III Economic and Social Dimensions “The balance of evidence suggests a discernible human influence on global climate”

191
IPCC 1997 Kyoto meeting - binding targets set
culmination of a series of meetings since Rio (1992) 2001 Bonn - rescuing Kyoto 2001 IPCC Third Assessment Report (TAR) WG I Climate Science WG II Vulnerabilities, Impacts and Adaptation WG III Mitigation
 2001 Bonn - rescuing Kyoto IPCC Third Assessment Report (TAR) WG I Climate Science. WG II Vulnerabilities, Impacts and Adaptation. WG III Mitigation.")
192
IPCC TAR (2001) “There is new and stronger evidence that most of the warming observed over the last 50 years is attributable to human activities” (WG I) Global losses in weather related natural disasters have increased ten-fold from the 1960s to the 1990s, and that a portion of this increase must be due to increases in frequency and intensity of some extreme events. (WG II) “most of the opportunities to reduce emissions will come from energy efficiency gains and in reducing release of greenhouse gases from industry” (WG III)
 Global losses in weather related natural disasters have increased ten-fold from the 1960s to the 1990s, and that a portion of this increase must be due to increases in frequency and intensity of some extreme events. (WG II) most of the opportunities to reduce emissions will come from energy efficiency gains and in reducing release of greenhouse gases from industry (WG III)")
193
Goals of Kyoto Protocol
Reduction of greenhouse gases to below 1990 levels: 5.2% world wide reduction on average by 6% for Canada by When sufficient countries ratify the Protocol (at least 55 countries comprising at least 55% of emissions), Protocol comes into effect USA - 25% of emissions
, Protocol comes into effect. USA - 25% of emissions.")
194
Kyoto Emissions Agreement

195
Fossil-Fuel CO2 Emissions (million metric tonnes C)
Annex B Countries Non Annex B Countries Fossil-Fuel CO2 Emissions (million metric tonnes C) Bunkers (million metric tonnes C) 1990 3851 78 2126 41 1991 3751 88 2306 1992 3663 92 2291 43 1993 3610 2341 48 1994 3607 2487 50 1995 3624 95 2607 52 1996 3674 2704 58 1997 3696 97 2775 61 1998 3690 100 2756 62 Source: Gregg Marland and Tom Boden (CDIAC, Oak Ridge National Laboratory).
 Bunkers (million metric tonnes C) Source: Gregg Marland and Tom Boden (CDIAC, Oak Ridge National Laboratory).")
196
Greenhouse Effect - Conclusion
Since 1700, humans have directly or indirectly caused the concentration of the major greenhouse gases to increase Scientists predict that this increase may enhance the greenhouse effect making the planet warmer by 0.3 to 0.6 degrees Celsius

197
Cost of Regular Gasoline
$3.80 – Great Britain $3.80 – The Netherlands $3.74 – Italy $3.69 – Belgium $3.62 – France $3.57 – Germany $3.20 – Japan $1.39 – United States in U.S. dollars as of October 13, 1997

198
History of Global Warming
1904: Swedish scientist Svante Arrhenius was, according to NASA, "the first person to investigate the effect that doubling atmospheric carbon dioxide would have on global climate."

199
History of Global Warming
Arrhenius began studying rapid increases in anthropogenic – carbon emissions, determining that "the slight percentage of carbonic acid in the atmosphere may, by the advances of industry, be changed to a noticeable degree in the course of a few centuries."

200
History of Global Warming
The unique research of Arrhenius suggested that this increase could be beneficial, making Earth's climates "more equable" and stimulating plant growth and food production. Until about 1960, most scientists thought it implausible that humans could actually affect average global temperatures.

201
History of Global Warming
1950s: Geophysicist Roger Revelle, with the help of Hans Suess, demonstrated that carbon dioxide levels in the air had increased as a result of the use of fossil fuels.

202
History of Global Warming
1965: Serving on the President's Science Advisory Committee Panel on Environmental Pollution in 1965, Roger Revelle helped publish the first high-level government mention of global warming. The book-length report identified many of the environmental troubles the nation faced, and mentioned in a "subpanel report" the potential for global warming by carbon dioxide.

203
History of Global Warming
1977: "In 1977 the nonpartisan National Academy of Sciences issued a study called Energy and Climate, which carefully suggested that the possibility of global warming 'should lead neither to panic nor to complacency.'

204
History of Global Warming
Rather, the study continued, it should 'engender a lively sense of urgency in getting on with the work of illuminating the issues that have been identified and resolving the scientific uncertainties that remain.'

205
History of Global Warming
As is typical with National Academy studies, the primary recommendation was for more research." — From "Breaking the Global-Warming Gridlock" by Daniel Sarewitz and Roger Pielke Jr., THE ATLANTIC, July 2000

206
History of Global Warming
Roger Revelle chaired the National Academy Panel, which found that about forty percent of the anthropogenic carbon dioxide has remained in the atmosphere, two-thirds from fossil fuel and one-third from the clearing of forests. It is now known that carbon dioxide is one of the primary greenhouse gases that contributes to global warming and remains in the atmosphere for a century.

207
History of Global Warming
1980s: Representative Al Gore (D-TN), who had been a student of Revelle's, co-sponsored the first Congressional hearings to study the implications of global warming and to encourage the development of environmental technologies to combat global warming.
, who had been a student of Revelle s, co-sponsored the first Congressional hearings to study the implications of global warming and to encourage the development of environmental technologies to combat global warming.")
208
History of Global Warming
1982: Roger Revelle published a widely-read article in SCIENTIFIC AMERICAN addressing the rise in global sea level and the "relative role played by the melting of glaciers and ice sheets versus the thermal expansion of the warming surface waters."

209
History of Global Warming
1983: The Environmental Protection Agency released a report detailing some of the possible threats of the anthropogenic emission of carbon dioxide.

210
History of Global Warming
1988: NASA climate scientist James Hansen and his team reported to Congress on global warming, explaining, "the greenhouse warming should be clearly identifiable in the 1990s" and that "the temperature changes are sufficiently large to have major impacts on people and other parts of the biosphere, as shown by computed changes in the frequency of extreme events and comparison with previous climate trends."

211
History of Global Warming
With the increased awareness of global warming issues, the Intergovernmental Panel on Climate Change (IPCC) was established by the World Meteorological Organization and the United Nations Environment Programme to assess scientific, technical and socio-economic information relevant for the understanding of climate change, its potential impacts and options for adaptation and mitigation. The IPCC was the first international effort of this scale to address environmental issues.
 was established by the World Meteorological Organization and the United Nations Environment Programme to assess scientific, technical and socio-economic information relevant for the understanding of climate change, its potential impacts and options for adaptation and mitigation. The IPCC was the first international effort of this scale to address environmental issues.")
212
History of Global Warming
1990: Congress passed and President George Bush signed Public Law "The Global Change Research Act of The purpose of the legislation was "…to require the establishment of a United States Global Change Research Program aimed at understanding and responding to global change, including the cumulative effects of human activities and natural processes on the environment, to promote discussions towards international protocols in global change research, and for other purposes."

213
History of Global Warming
As part of the Act, the Global Change Research Information Office (GCRIO) was established "to disseminate to foreign governments, businesses, and institutions, as well as citizens of foreign countries, scientific research information available in the United States which would be useful in preventing, mitigating, or adapting to the effects of global change. The office began formal operation in 1993.
 was established to disseminate to foreign governments, businesses, and institutions, as well as citizens of foreign countries, scientific research information available in the United States which would be useful in preventing, mitigating, or adapting to the effects of global change. The office began formal operation in")
214
History of Global Warming
1992: In June of 1992, over 100 government leaders, representatives from 170 countries, and some 30,000 participants met in Rio de Janeiro at the U.N. Conference on Environment and Development (UNCED or the "Earth Summit").
.")
215
History of Global Warming
There, an international assembly formally recognized the need to integrate economic development and environmental protection into the goal of sustainable development.

216
History of Global Warming
1997: In December, 1997, more than 160 nations met in Kyoto, Japan, to negotiate binding limitations on greenhouse gases for the developed nations, pursuant to the objectives of the Framework Convention on Climate Change of 1992.

217
History of Global Warming
The outcome of the meeting was the Kyoto Protocol, in which the developed nations agreed to limit their greenhouse gas emissions, relative to the levels emitted in The United States agreed to reduce emissions from 1990 levels by 7 percent during the period 2008 to 2012.

218
History of Global Warming
1997: In December, 1997, more than 160 nations met in Kyoto, Japan, to negotiate binding limitations on greenhouse gases for the developed nations, pursuant to the objectives of the Framework Convention on Climate Change of 1992.

219
History of Global Warming
The outcome of the meeting was the Kyoto Protocol, in which the developed nations agreed to limit their greenhouse gas emissions, relative to the levels emitted in 1990. The United States agreed to reduce emissions from 1990 levels by 7 percent during the period 2008 to 2012.

220
History of Global Warming
Also that year, the United States Senate unanimously passed the Hagel-Byrd Resolution notifying the Clinton Administration that the Senate would not ratify any treaty that would (a) impose mandatory greenhouse gas emissions reductions for the United States without also imposing such reductions for developing nations, or (b) result in serious harm to our economy.
 impose mandatory greenhouse gas emissions reductions for the United States without also imposing such reductions for developing nations, or (b) result in serious harm to our economy.")
221
History of Global Warming
2001: The IPCC released its third assessment report, concluding on the basis of "new and stronger evidence that most of the observed warming over the last 50 years is attributable to human activities." They also observed that "the globally averaged surface temperature is projected to increase by 1.4 to 5.8 degrees Celsius over the period 1990 to 2100."

222
History of Global Warming
The same year, President George W. Bush announced that the United States would not ratify the Kyoto Protocol. The Protocol is now in limbo until one of the two crucial holdouts — Russia or the United States — will ratify the treaty.

223
History of Global Warming
2003: Senator John McCain (R-AZ) and Senator Joseph Lieberman (D-CT) co-sponsored a proposal for mandatory caps on "greenhouse gas" emissions from utilities and other industries.
 and Senator Joseph Lieberman (D-CT) co-sponsored a proposal for mandatory caps on greenhouse gas emissions from utilities and other industries.")
224
History of Global Warming
Although the proposal was rejected in the Senate by a margin of 55 to 43, it was the Senators' first attempt to garner Senate attention for the issue of global warming, and McCain and Lieberman were encouraged by the support for the measure.

Similar presentations


 Do not set up for CN. OBJ = SWBAT identify major air pollutants and explain their effect on humans.>")

. Can be “good” up.>")


