Download presentation
Presentation is loading. Please wait.

1
Culture Mapping: A Cognitive Analysis of The Education Culture Landscape in America Randy Keyworth

3
Culture Mapping or Going Down the Rabbit Hole (an adventure into the unknown) cognitive concepts: attitudes, beliefs, philosophies, ideologies qualitative research : surveys, interviews, focus groups, media analyses social sciences: anthropology, linguistics, cognitive psychology, sociology, political science, communications theory
 cognitive concepts: attitudes, beliefs, philosophies, ideologies qualitative research : surveys, interviews, focus groups, media analyses social sciences: anthropology, linguistics, cognitive psychology, sociology, political science, communications theory")
4
The scope of public thinking about American education. 1.Education policy has become a partisan issue. 2.Education policy is regularly covered by media at all levels. 3.Education policy generates widespread interest Many adults work within the field of education, or know people who do. Most adults have dealt with education as parents. All adults have dealt with education as students.

5
A systematic inquiry into patterns of public thinking about American education. Research :systematic review of social science and education literature Methodology:surveys review of national & local media focus groups in-depth interviews Reports: “Framing Education Reform: A FrameWorks Message Memo” Nall Bales (2010) “Magic Bullets Hanging By a Thread” O’Neil & Haydon (2013)
 Magic Bullets Hanging By a Thread O’Neil & Haydon (2013).")
6
Differing Views on the Influence of Evidence in Education 1.RATIONAL ACTOR MODEL: Reason is conscious, literal, logical, universal, unemotional, disembodied, and serves self interest. If people are made aware of the fact and figures, they should naturally come to the right conclusions. 2.FRAME MODEL: People evaluate information and make decisions in the context of their deeply held constructs—worldviews, beliefs, and assumptions—called “frames”. Frames are a small sets of internalized concepts and values that allow people to attach meaning to new information. Once a frame is established, it will “trump” numbers. If the facts don’t fit the frame, it’s the facts that are rejected, not the frame. Frameworks, Framing Public Issues, 2002

7
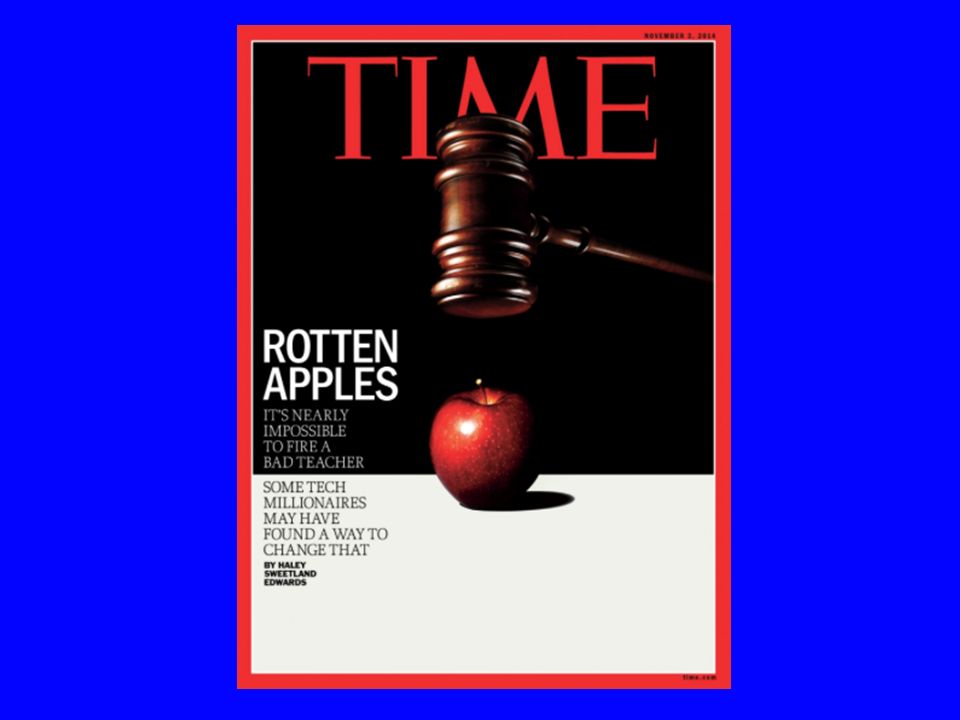
Culture Mapping: Patterns of Public Thinking FRAMES REGARDING EDUCATION SOLUTIONS 1.Individual Frame education “systems” are invisible, complex… focus goes to individual “actors”: parents, teachers, students 2.Blame Frame assume problems are the result of motivation, character, discipline, effort and/or caring “irresponsible parents”, “bad teachers”, “undisciplined students” 3.Visionary Leader Frame tendency to reduce the complexity of a multi-actor system to the actions and characteristics of a single individual in a leadership role Magic Bullets Hanging By a Thread”, O’Neil & Haydon, FrameWorks Institute, (2013)
")
8
Culture Mapping: Patterns of Public Thinking FRAMES REGARDING EDUCATION SOLUTIONS 4.Magic Bullet Frame belief there is one reform or policy initiative that will “magically” address the country’s educational woes 5.Local Solutions Frame innovation, dynamism, and meaningful programmatic change can only occur at the local level; state and federal actors are inflexible, out of touch, and ineffective 6.Private Sector Frame private sector is the only place capable of innovation and efficiency, public schools too mired in bureaucracy, “Magic Bullets Hanging By a Thread”, O’Neil & Haydon, FrameWorks Institute, (2013)
")
9
Culture Mapping: Patterns of Public Thinking FRAMES REGARDING EDUCATION SOLUTIONS 7.Back to Basics Frame failure of education is due to reforms getting away from the basics: reading, writing and arithmetic 8.More Funding Frame assumption that any reforms would require that much more money, and that more money will improve education 9.Computers Frame belief that having more computers in the classroom is a universal panacea for improving education “Magic Bullets Hanging By a Thread”, O’Neil & Haydon, FrameWorks Institute, (2013)
")
10
Culture Mapping: Impact of Cultural Beliefs EDUCATION REFORM INITIATIVES EVIDENCE vs. CULTURAL FRAMES CHARTER SCHOOLS SCHOOL IMPROVEMENT GRANTS (additional funding and staff replacement) ONE-TO-ONE COMPUTING
 ONE-TO-ONE COMPUTING.")
11
Culture Mapping: Impact of Cultural Beliefs Charter Schools 5.1% of K-12 students in charter schools100% enrollment growth since 2007-08 Model: 1.independently contract with outside group to operate schools 2.no specific education model, curriculum, pedagogy 3.no unions Percentage of children in charter schools New Orleans : 79% District of Columbia: 43% Detroit: 51% Chicago: 19% 70% of Americans support charter schools

12
Culture Mapping: Impact of Cultural Beliefs Charter Schools The Evaluation of Charter Schools Final Report (June 2010), IES “On average, charter middle schools that hold lotteries are neither more nor less successful than traditional public schools in improving achievement, behavior, and school progress.” “The impact of charter middle schools on student achievement varies significantly across schools” CULTURAL FRAMES Private Sector Frame Visionary Leader Frame Magic Bullet Frame Local Solutions Frame Charter School Performance in 16 States (2009), CREDO, Stanford “On average, academic growth be somewhat lower than their traditional public school peers…” “tremendous variation in academic quality among charter schools is the strongest result of the study…” EVIDENCE
, IES On average, charter middle schools that hold lotteries are neither more nor less successful than traditional public schools in improving achievement, behavior, and school progress. The impact of charter middle schools on student achievement varies significantly across schools CULTURAL FRAMES Private Sector Frame Visionary Leader Frame Magic Bullet Frame Local Solutions Frame Charter School Performance in 16 States (2009), CREDO, Stanford On average, academic growth be somewhat lower than their traditional public school peers… tremendous variation in academic quality among charter schools is the strongest result of the study… EVIDENCE")
13
Culture Mapping: Impact of Cultural Beliefs School Improvement Grants Model (funding and staff replacement) 1.funding over three years (2010-11, 2011-12, 2012-13 ) toward the goal of turning around the 1,200 of the nation’s lowest-performing schools 2.up to $ 2 million per school per year, $ 3.5 Billion total 3.must use one of the following four models for turnaround: Hurlburt, et.al. 2011, Institute of Education Sciences Turnaround model: replace the principal and no less than 50% of the staff; and introduce significant reforms (20% of schools) Restart model: reopen the school under management of a charter school operator, or an ed. mgmt. organization (4% of schools) School closure: close the school and reassign students to higher achieving schools (2% of schools) Transformational model: replace the principal, introduce significant reforms (74% of schools)
 Restart model: reopen the school under management of a charter school operator, or an ed. mgmt. organization (4% of schools) School closure: close the school and reassign students to higher achieving schools (2% of schools) Transformational model: replace the principal, introduce significant reforms (74% of schools).")
14
Culture Mapping: Impact of Cultural Beliefs School Improvement Grants EVIDENCE FUNDING Funding increased by 30% from 1995-2009 Disconnect between funding levels and performance at all levels STAFF REPLACEMENT 5 years NCLB data implementing staff replacement model 80% no change 8% small improvement 1% successful turnaround 11% closed CULTURAL FRAMES More Funding Frame Individual Frame Blame Frame Magic Bullet Frame Local Solutions Frame Private Sector Frame

15
Culture Mapping: Impact of Cultural Beliefs One-to-One Computing Model: Each student and teacher is given a computing device: computer, access to the internet and software. Computers include personal computer, laptop, netbook, handheld, or tablet. Untold billions of dollars being spent across many states and nations The vast majority of 1-1 computing initiatives drop computers into classrooms without consideration of pedagogy, curriculum, or teaching The focus on the technology, not the teaching spray and pray: “spray” on the technology, and then “pray” that you get an increase in learning belief that students can be left to their own devices

16
Culture Mapping: Impact of Cultural Beliefs One-to-One Computing LAUSD$ 1 Billion to get iPADS to 650,000 students cost over-runs (support, maintenance, WiFi, replacement, electricity) inadequate, untested curriculum poor planning, implementation inadequate training for teachers lack of integration with district 36% teacher support
 inadequate, untested curriculum poor planning, implementation inadequate training for teachers lack of integration with district 36% teacher support")
17
Culture Mapping: Impact of Cultural Beliefs One-to-One Computing EVIDENCE “one-to-one computer programs are only as effective as their teachers” Bebell & Key, The Journal of Technology, Learning & Assessment, (2010) “Factors related to successful implemented reported in the research include extensive teacher professional development, technical support, and positive teacher attitudes toward student technology use.” Penuel, SRI International, Journal of Research on Technology in Education, (2006) CULTURAL FRAMES Computers Frame Magic Bullet Frame Local Solutions Frame Private Sector Frame
 Factors related to successful implemented reported in the research include extensive teacher professional development, technical support, and positive teacher attitudes toward student technology use. Penuel, SRI International, Journal of Research on Technology in Education, (2006) CULTURAL FRAMES Computers Frame Magic Bullet Frame Local Solutions Frame Private Sector Frame")
18
How cultural constructs have influenced education policy at the national level. How to influence cultural constructs regarding education policy at the national level.

19
1.Understand the complexity of effective communication People are not blank slates Communication is interactive Communication resonates with people’s deeply held values and worldviews Communication is frame based When communication is inadequate, people default to the “pictures in their heads” When communication is effective, people can see an issue from a different perspective.

20
2.Recognize the limitations of evidence, numbers, data, research on influencing public opinion. Being “right” is never enough. 3.Craft the message within the context of dominant frames LEVEL ONE: Big ideas, like freedom, justice, community, success, prevention, responsibility LEVEL TWO: Issue-types, like the environment or childcare LEVEL THREE:Specific issues, like rainforests or earned tax credits

21
4.Use numbers as part of the story, not as the story. Begin with the interpretation, then the numbers Never provide numbers without telling them what they mean. 5.The choice of messenger is as important as the message itself. 6.Use tools to make extensive inferences beyond the words actually used visuals metaphors

24
How do you get rid of “bad” teachers? Make them “good” teachers.

25
Thank you

Similar presentations