Download presentation
Presentation is loading. Please wait.

3
World Population

4
World Population Numbers In 1999 the world’s population reached 6,000 million. 360,187 people are estimated to be born every day (140,348 die). 250 are born each minute (103 die).
. 250 are born each minute (103 die)..")
5
World Population Distribution

6
World Population Distribution II Where we live - global population densities. Density is indicated by the intensity of colour.

7
World Population When human population was small, our impact on world systems was small. Population numbers now have large effects on the planet in terms of resource use, pollution and impact on the physical landscape. The effects on a per capita basis are greatest in the more developed countries.

8
The Census

9
Population study depends on accurate counts. Fortunately, nearly every country attempts to do this regularly. This count is called a census and it is is conducted every 10 years. In Canada we count numbers every 5 years. Countries gather lots information about their people, including demographic and social characteristics.

10
The Census Canadian data is made available through Statistics Canada.Statistics Canada

11
The Census Economic & population data is made available to those who want it. Businesses and governments find this data invaluable.

12
The Census Businesses use census data to decide particular markets and identify sources of labour. Governments use census data to plan the delivery of services, plan taxation measures, and to distribute political representation by population.

13
The Census Canada’s population in 2001 was around 31,007,094 British Columbia’s population in 2001 was about 3,907,738 Greater Vancouver’s population was about 1,986,965

14
Vital Statistics Between each census, governments continue to monitor demographic information, keeping track of Births Deaths Immigration Emigration

15
Population Growth

16
Birth/Fertility Rates Birth rates give the number of live births per thousand of population in a year. Total live births Total population X 1,000 Total live births Total women between 15-44 X 1,000 The general fertility rate measures births per thousand women between 15 and 44.

17
Birth Rates Birth rates vary largely from country to country. http://www.searo.who.int/en/Section1243/Section1382/Section1386/Section1898_9250.htm
18
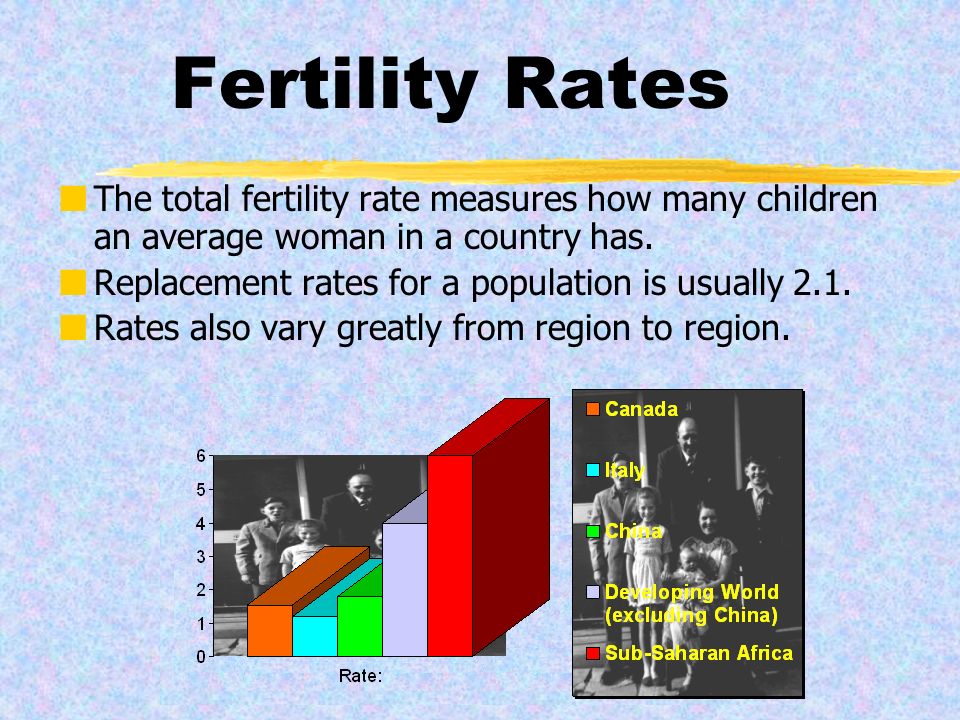
Fertility Rates The total fertility rate measures how many children an average woman in a country has. Replacement rates for a population is usually 2.1. Rates also vary greatly from region to region.

19
Mortality Rates Births give only one part of the story. Population numbers must also consider deaths. Like births, it is calculated per 1000 population.

21
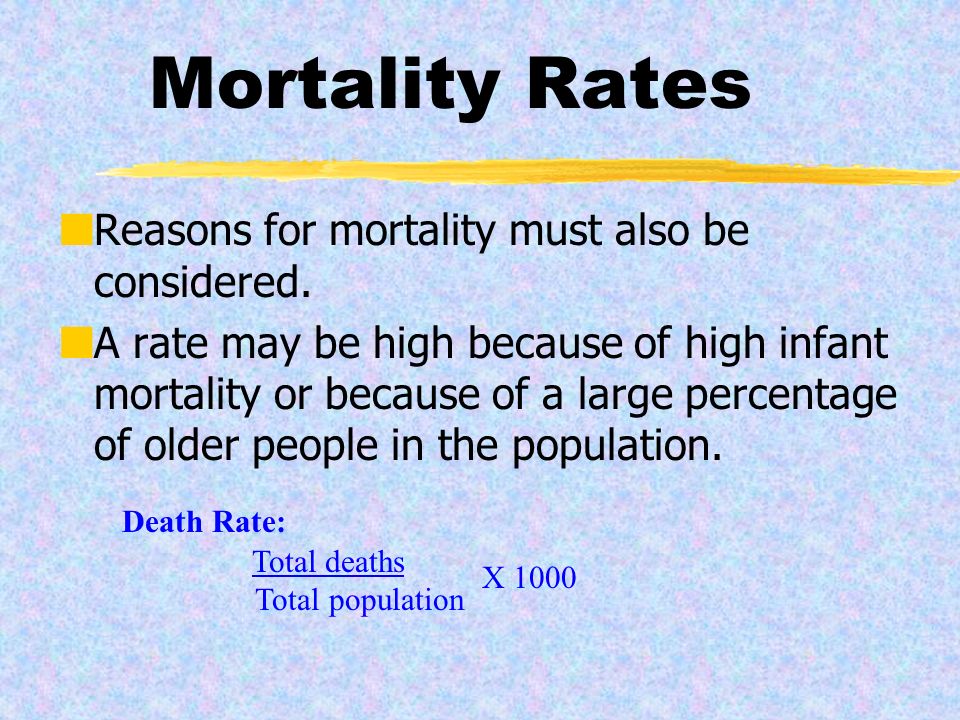
Mortality Rates Reasons for mortality must also be considered. A rate may be high because of high infant mortality or because of a large percentage of older people in the population. Total deaths Total population X 1000 Death Rate:

22
Age Specific Death Rate A more meaningful comparison of death rates between countries takes into account the age structures of respective populations. Total deaths of people aged 5-9 Total number of people aged 5-9 X 1000 Age Specific Death Rates or Total deaths of people aged 65-69 Total number of people aged 65-69 X 1000

23
Infant Mortality Rate One of the most meaningful comparisons of mortality measures is infant mortality, deaths between birth and one year of age. Total deaths of infants under 1 year Total live births X 1000 CanadaChinaBhutanSri Lanka

25
Causes of Mortality In pre-industrial societies, mortality targets the very young. The age specific death rates for those under 10 were very high.

26
Causes of Mortality In the industrial and post-industrial worlds, the main causes of death are degenerative diseases. Improved hygiene and sanitation has reduced the diseases typhoid and cholera. Advances in health care through vaccination programs and the use of antibiotics has reduced the impact many diseases.

27
Life Expectancy Another useful comparative measure is life expectancy. This indicates how long the average person in a country is be expected to live from the time of birth.

28
Doubling Time The difference between the birth rate and the death rate has huge implications for population growth or shrinkage. The following equation can be used to estimate the number of years it will take for a population to double. This uses the “rule of 70”, which takes this figure as representing a generation’s lifetime. 70 % rate of growth of population years for = population to double

29
Doubling Time Large differences exist between countries in terms of doubling times. Some developed countries have shrinking populations. Some of the least developed countries have very short doubling times.

30
Doubling Time Immigration & emigration should also be considered. If a population is “closed” there is little to no migration. Some countries have significant movement and are described as “open”.

31
The Population Equation P1 is the starting population size. P2 is the size after a particular length of time. B is the number of births between P1 & P2. D is the number of deaths between P1 & P2. IM is the number of in-migrants in the time period. OM is the number of out-migrants in the time period. P1 + (B - D) + (IM - OM) = P2 Use the following equation to calculate population change over time.
 + (IM - OM) = P2 Use the following equation to calculate population change over time..")
32
The Demographic Transition

33
The Demographic Transition Model Declining fertility was seen in many countries in the period after World War I. The Demographic Transition Model notes this change, but does not explain it. It notes that populations arrive at a balance and adjust to changing conditions in short time frames. Lots of people believe that catastrophe is avoidable. They see man as able to foresee potential disasters and to make the necessary adaptations to avoid them.

34
Demographic Transition Model The demographic transition model notes that development resulted in rapid population growth, but that developed societies reacted to this by lowering in fertility. The characteristic “S” curve indicates that population growth has stopped. Time Population The “S” Curve

35
Demographic Transition Model A look at the differences in population pyramids between less developed and more developed countries clearly shows this demographic shift. Germany 1998 (Developed) Mali, 1998 (Less Developed)
 Mali, 1998 (Less Developed).")
36
Demographic Transition Model The balance of high birth rate and high mortality rate in less developed societies is lost because development brings improvement in health and sanitation, which reduces mortality. This is particularly true in the late 20th century. Population rises as a result.

37
Demographic Transition Model Fertility declines as people reduce the size of their families. Eventually a population balance returns and Zero Population Growth is achieved.

39
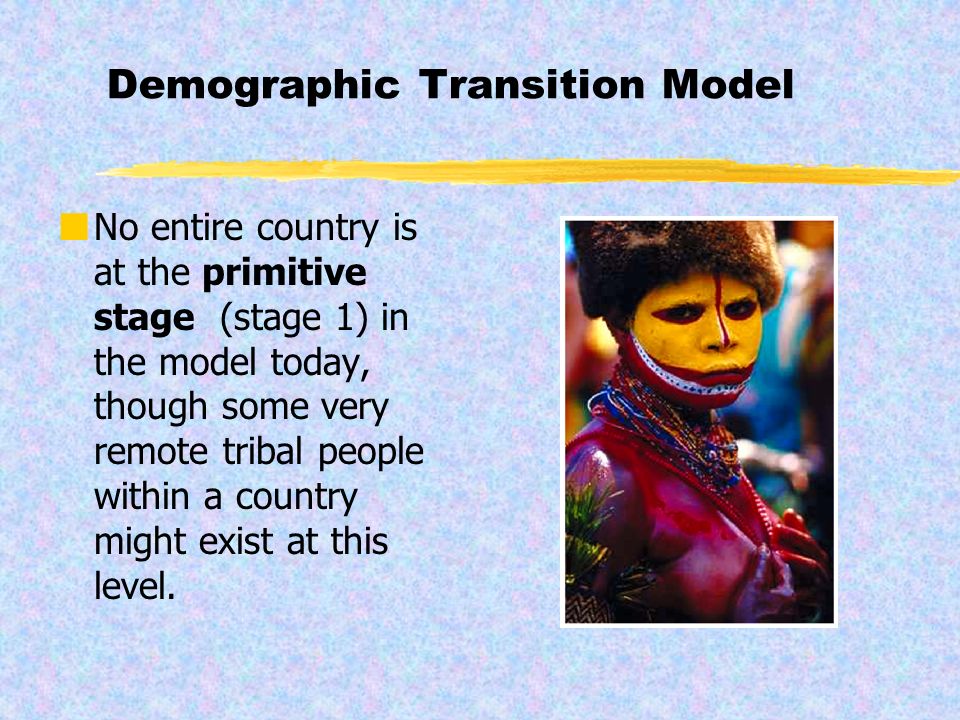
Demographic Transition Model No entire country is at the primitive stage (stage 1) in the model today, though some very remote tribal people within a country might exist at this level.
 in the model today, though some very remote tribal people within a country might exist at this level.")
40
Demographic Transition Model Nations at stage 2 and 3 are developing countries. They often have population growth rates of 2-3% per year. Age structures include a large number of young people.

41
Demographic Transition Model Nations at stage 4 are developed. Economic stability and strength has been achieved. A high cost of living and a longer period of dependency for youths make large families impractical.

42
Urbanization

43
Another part of development is the increasing size and importance of cities. The second half of this century has seen tremendous growth in the cities of the developing world. Humanity has become a largely urban and the trend strengthens with every passing year.

44
Urbanization World’s largest cities in 1900: World’s largest cities in 2015 (projected) London 6.4 million New York 4.2 million Paris 3.3 million Berlin 2.4 million Chicago 1.7 million Tokyo 28.7 million Bombay 27.4 million Lagos 24.4 million Shanghai 23.4 million Jakarta 21.2 million
 London 6.4 million New York 4.2 million Paris 3.3 million Berlin 2.4 million Chicago 1.7 million Tokyo 28.7 million Bombay 27.4 million Lagos 24.4 million Shanghai 23.4 million Jakarta 21.2 million")
45
Urbanization In 2005, for the first time, a majority of people will live in cities. City Growth in Billions

46
Urbanization Urban growth rates are much faster than population growth rates. In developing countries the overall rate is 1.9%, but the urban growth rate for cities is around 3.5%. The World Resources Institute estimates that for every 1% increase in national population brings a 1.7% growth in urban population.

47
Urbanization In the developing world, city growth places a lot of pressure on urban infrastructure. Water and air quality are stressed. Open spaces are encroached upon. High rates of unemployment, homelessness and crime are an outcome.

48
Urbanization Despite the huge problems faced by the inhabitants of slums, shantytowns, barrios and favellas, there is still great optimism. Cities, with their size and complexity, offer a wide range of opportunities unavailable in rural economies.

Similar presentations


 in a given year.>")


